Delaware, OH (Ohio) Houses and Residents
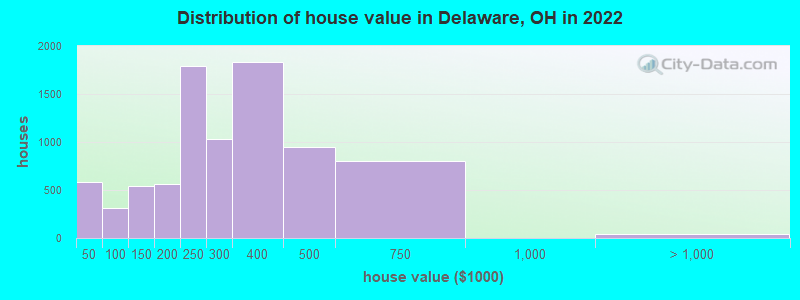
Estimated median house or condo value in 2022: $280,713 (it was $124,400 in 2000 )
Delaware:
$280,713Ohio:
$204,100
Lower value quartile - upper value quartile: $214,779 - $405,701Mean price in 2022: Detached houses: $302,734 Here:
$302,734State:
$254,366
Townhouses or other attached units: $219,787 Here:
$219,787State:
$225,733
In 2-unit structures: $259,632 Here:
$259,632State:
$144,384
In 3-to-4-unit structures: $138,775 Here:
$138,775State:
$203,002
In 5-or-more-unit structures: $153,869 Here:
$153,869State:
$211,593
Mobile homes: $29,255 Here:
$29,255State:
$62,719
Total population: 37,372 (Urban population: 24,544 (all inside urban clusters), Rural population: 672 (9 farm, 663 nonfarm ))
Houses: 17,757 (16,875 occupied: 10,558 owner occupied, 6,345 renter occupied )
% of renters here:
38%State:
33%
Housing density: 1,184 houses/condos per square mile
Median price asked for vacant for-sale houses and condos in 2022: $482,095.
Median contract rent in 2022: $988 (lower quartile is $793, upper quartile is $1,339)
Median rent asked for vacant for-rent units in 2022: $1,599
Median gross rent in Delaware, OH in 2022: $1,170
Housing units in Delaware with a mortgage: 7,436 (861 second mortgage, 14 home equity loan, 742 both second mortgage and home equity loan )Houses without a mortgage: 245
Median household income for houses/condos with a mortgage: $116,482
Median household income for apartments without a mortgage: $73,213
Median monthly housing costs: $1,245
Data:
Median house or condo value ($)
Median house or condo value ($ change since 2000)
Median house or condo value ($) - White
Median house or condo value ($) - Black or African American
Median house or condo value ($) - Asian
Median house or condo value ($) - Hispanic or Latino
Median house or condo value ($) - American Indian and Alaska Native
Median house or condo value ($) - Multirace
Median house or condo value ($) - Other Race
Median price asked for mobile homes ($)
Household density (households per square mile)
Mean house or condo value by units in structure - 1, detached ($)
Mean house or condo value by units in structure - 1, attached ($)
Mean house or condo value by units in structure - 2 ($)
Mean house or condo value by units in structure by units in structure - 3 or 4 ($)
Mean house or condo value by units in structure - 5 or more ($)
Mean house or condo value by units in structure - Boat, RV, van, etc. ($)
Mean house or condo value by units in structure - Mobile home ($)
Median contract rent ($)
Median contract rent - Lower quartile ($)
Median contract rent - Upper quartile ($)
Median gross rent ($)
Urban houses (%)
Rural houses (%)
Houses occupied (%)
Houses occupied (% change since 2000)
Houses owner occupied (%)
Houses owner occupied (% change since 2000)
Houses renter occupied (%)
Houses renter occupied (% change since 2000)
Vacant housing units - For rent (%)
Vacant housing units - For rent (% change since 2000)
Vacant housing units - For sale only (%)
Vacant housing units - For sale only (% change since 2000)
Vacant housing units - Rented or sold, not occupied (%)
Vacant housing units - Rented or sold, not occupied (% change since 2000)
Vacant housing units - For seasonal, recreational, or occasional use (%)
Vacant housing units - For seasonal, recreational, or occasional use (% change since 2000)
Vacant housing units - For migrant workers (%)
Vacant housing units - For migrant workers (% change since 2000)
Vacant housing units - Other vacant (%)
Vacant housing units - Other vacant (% change since 2000)
Median monthly housing costs ($)
Median household income for houses/condos with a mortgage ($)
Median household income for houses/condos without a mortgage ($)
Median household income ($)
Median household income ($) - White
Median household income ($) - Black or African American
Median household income ($) - Asian
Median household income ($) - Hispanic or Latino
Median household income ($) - American Indian and Alaska Native
Median household income ($) - Multirace
Median household income ($) - Other Race
Mortgage status - with mortgage (%)
Mortgage status - with second mortgage (%)
Mortgage status - with home equity loan (%)
Mortgage status - with both second mortgage and home equity loan (%)
Mortgage status - without a mortgage (%)
Median year house/condo built
Median year apartment built
Household type by relationship - Male householder living alone (%)
Household type by relationship - Male householder not living alone (%)
Household type by relationship - Female householder living alone (%)
Household type by relationship - Female householder not living alone (%)
Household type by relationship - Opposite-Sex spouse (%)
Household type by relationship - Same-Sex spouse (%)
Household type by relationship - Opposite-Sex unmarried partner (%)
Household type by relationship - Same-Sex unmarried partner (%)
Household type by relationship - In group quarters (%)
Size of family households - 2-person household (%)
Size of family households - 3-person household (%)
Size of family households - 4-person household (%)
Size of family households - 5-person household (%)
Size of family households - 6-person household (%)
Size of family households - 7-or-more-person household (%)
Size of nonfamily households - 1-person household (%)
Size of nonfamily households - 2-person household (%)
Size of nonfamily households - 3-person household (%)
Size of nonfamily households - 4-person household (%)
Size of nonfamily households - 5-person household (%)
Size of nonfamily households - 6-person household (%)
Size of nonfamily households - 7-or-moreperson household (%)
Year house built - Built 2010 or later (%)
Year house built - Built 2000 to 2009 (%)
Year house built - Built 1990 to 1999 (%)
Year house built - Built 1980 to 1989 (%)
Year house built - Built 1970 to 1979 (%)
Year house built - Built 1960 to 1969 (%)
Year house built - Built 1950 to 1959 (%)
Year house built - Built 1940 to 1949 (%)
Year house built - Built 1939 or earlier (%)
Median number of rooms in houses and condos
Median number of rooms in apartments
Median number of bedrooms in owner occupied houses
Mean number of bedrooms in owner occupied houses
Median number of bedrooms in renter occupied houses
Mean number of bedrooms in renter occupied houses
Median number of vehichles in owner occupied houses
Mean number of vehichles in owner occupied houses
Median number of vehichles in renter occupied houses
Mean number of vehichles in renter occupied houses
Rooms in owner-occupied houses - 1 room (%)
Rooms in owner-occupied houses - 2 rooms (%)
Rooms in owner-occupied houses - 3 rooms (%)
Rooms in owner-occupied houses - 4 rooms (%)
Rooms in owner-occupied houses - 5 rooms (%)
Rooms in owner-occupied houses - 6 rooms (%)
Rooms in owner-occupied houses - 7 rooms (%)
Rooms in owner-occupied houses - 8 rooms (%)
Rooms in owner-occupied houses - 9+ rooms (%)
Rooms in renter-occupied houses - 1 room (%)
Rooms in renter-occupied houses - 2 rooms (%)
Rooms in renter-occupied houses - 3 rooms (%)
Rooms in renter-occupied houses - 4 rooms (%)
Rooms in renter-occupied houses - 5 rooms (%)
Rooms in renter-occupied houses - 6 rooms (%)
Rooms in renter-occupied houses - 7 rooms (%)
Rooms in renter-occupied houses - 8 rooms (%)
Rooms in renter-occupied houses - 9+ rooms (%)
Bedrooms in owner-occupied houses - no bedrooms (%)
Bedrooms in owner-occupied houses - 1 bedroom (%)
Bedrooms in owner-occupied houses - 2 bedrooms (%)
Bedrooms in owner-occupied houses - 3 bedrooms (%)
Bedrooms in owner-occupied houses - 4 bedrooms (%)
Bedrooms in owner-occupied houses - 5+ bedrooms (%)
Bedrooms in renter-occupied houses - no bedrooms (%)
Bedrooms in renter-occupied houses - 1 bedroom (%)
Bedrooms in renter-occupied houses - 2 bedrooms (%)
Bedrooms in renter-occupied houses - 3 bedrooms (%)
Bedrooms in renter-occupied houses - 4 bedrooms (%)
Bedrooms in renter-occupied houses - 5+ bedrooms (%)
Vehicles available in owner-occupied houses - no vehicle available (%)
Vehicles available in owner-occupied houses - 1 vehicle available(%)
Vehicles available in owner-occupied houses - 2 Vehicles available (%)
Vehicles available in owner-occupied houses - 3 Vehicles available (%)
Vehicles available in owner-occupied houses - 4 Vehicles available (%)
Vehicles available in owner-occupied houses - 5+ Vehicles available (%)
Vehicles available in renter-occupied houses - no vehicle available (%)
Vehicles available in renter-occupied houses - 1 vehicle available (%)
Vehicles available in renter-occupied houses - 2 Vehicles available (%)
Vehicles available in renter-occupied houses - 3 Vehicles available (%)
Vehicles available in renter-occupied houses - 4 Vehicles available (%)
Vehicles available in renter-occupied houses - 5+ Vehicles available (%)
Housing units in structures - 1, detached (%)
Housing units in structures - 1, attached (%)
Housing units in structures - 2 (%)
Housing units in structures - 3 or 4 (%)
Housing units in structures - 5 to 9 (%)
Housing units in structures - 10 to 19 (%)
Housing units in structures - 20 to 49 (%)
Housing units in structures - 50 or more (%)
Housing units in structures - Mobile home (%)
Housing units in structures - Boat, RV, van, etc. (%)
Housing units in structures - Owners - 1, detached (%)
Housing units in structures - Owners - 1, attached (%)
Housing units in structures - Owners - 2 (%)
Housing units in structures - Owners - 3 or 4 (%)
Housing units in structures - Owners - 5 to 9 (%)
Housing units in structures - Owners - 10 to 19 (%)
Housing units in structures - Owners - 20 to 49 (%)
Housing units in structures - Owners - 50 or more (%)
Housing units in structures - Owners - Mobile home (%)
Housing units in structures - Owners - Boat, RV, van, etc. (%)
Housing units in structures - Renters - 1, detached (%)
Housing units in structures - Renters - 1, attached (%)
Housing units in structures - Renters - 2 (%)
Housing units in structures - Renters - 3 or 4 (%)
Housing units in structures - Renters - 5 to 9 (%)
Housing units in structures - Renters - 10 to 19 (%)
Housing units in structures - Renters - 20 to 49 (%)
Housing units in structures - Renters - 50 or more (%)
Housing units in structures - Renters - Mobile home (%)
Housing units in structures - Renters - Boat, RV, van, etc. (%)
House/condo owner moved in on average (years ago)
Renter moved in on average (years ago)
Year householder moved into unit - Moved in 1999 to March 2000 (%)
Year householder moved into unit - Moved in 1999 to March 2000 (%) - White
Year householder moved into unit - Moved in 1999 to March 2000 (%) - Black or African American
Year householder moved into unit - Moved in 1999 to March 2000 (%) - Asian
Year householder moved into unit - Moved in 1999 to March 2000 (%) - Hispanic or Latino
Year householder moved into unit - Moved in 1999 to March 2000 (%) - American Indian and Alaska Native
Year householder moved into unit - Moved in 1999 to March 2000 (%) - Multirace
Year householder moved into unit - Moved in 1999 to March 2000 (%) - Other Race
Year householder moved into unit - Moved in 1995 to 1998 (%)
Year householder moved into unit - Moved in 1995 to 1998 (%) - White
Year householder moved into unit - Moved in 1995 to 1998 (%) - Black or African American
Year householder moved into unit - Moved in 1995 to 1998 (%) - Asian
Year householder moved into unit - Moved in 1995 to 1998 (%) - Hispanic or Latino
Year householder moved into unit - Moved in 1995 to 1998 (%) - American Indian and Alaska Native
Year householder moved into unit - Moved in 1995 to 1998 (%) - Multirace
Year householder moved into unit - Moved in 1995 to 1998 (%) - Other Race
Year householder moved into unit - Moved in 1990 to 1994 (%)
Year householder moved into unit - Moved in 1990 to 1994 (%) - White
Year householder moved into unit - Moved in 1990 to 1994 (%) - Black or African American
Year householder moved into unit - Moved in 1990 to 1994 (%) - Asian
Year householder moved into unit - Moved in 1990 to 1994 (%) - Hispanic or Latino
Year householder moved into unit - Moved in 1990 to 1994 (%) - American Indian and Alaska Native
Year householder moved into unit - Moved in 1990 to 1994 (%) - Multirace
Year householder moved into unit - Moved in 1990 to 1994 (%) - Other Race
Year householder moved into unit - Moved in 1980 to 1989 (%)
Year householder moved into unit - Moved in 1980 to 1989 (%) - White
Year householder moved into unit - Moved in 1980 to 1989 (%) - Black or African American
Year householder moved into unit - Moved in 1980 to 1989 (%) - Asian
Year householder moved into unit - Moved in 1980 to 1989 (%) - Hispanic or Latino
Year householder moved into unit - Moved in 1980 to 1989 (%) - American Indian and Alaska Native
Year householder moved into unit - Moved in 1980 to 1989 (%) - Multirace
Year householder moved into unit - Moved in 1980 to 1989 (%) - Other Race
Year householder moved into unit - Moved in 1970 to 1979 (%)
Year householder moved into unit - Moved in 1970 to 1979 (%) - White
Year householder moved into unit - Moved in 1970 to 1979 (%) - Black or African American
Year householder moved into unit - Moved in 1970 to 1979 (%) - Asian
Year householder moved into unit - Moved in 1970 to 1979 (%) - Hispanic or Latino
Year householder moved into unit - Moved in 1970 to 1979 (%) - American Indian and Alaska Native
Year householder moved into unit - Moved in 1970 to 1979 (%) - Multirace
Year householder moved into unit - Moved in 1970 to 1979 (%) - Other Race
Year householder moved into unit - Moved in 1969 or earlier (%)
Year householder moved into unit - Moved in 1969 or earlier (%) - White
Year householder moved into unit - Moved in 1969 or earlier (%) - Black or African American
Year householder moved into unit - Moved in 1969 or earlier (%) - Asian
Year householder moved into unit - Moved in 1969 or earlier (%) - Hispanic or Latino
Year householder moved into unit - Moved in 1969 or earlier (%) - American Indian and Alaska Native
Year householder moved into unit - Moved in 1969 or earlier (%) - Multirace
Year householder moved into unit - Moved in 1969 or earlier (%) - Other Race
Housing units lacking complete plumbing facilities (%)
Housing units lacking complete kitchen facilities (%)
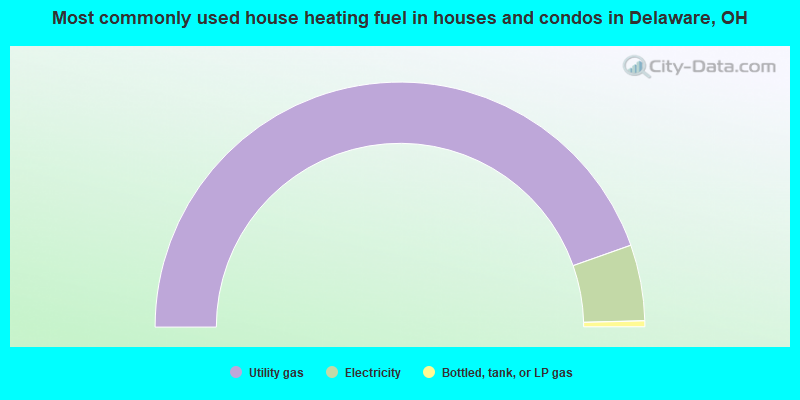
House heating fuel used in houses and condos - Utility gas (%)
House heating fuel used in houses and condos - Bottled, tank, or LP gas (%)
House heating fuel used in houses and condos - Electricity (%)
House heating fuel used in houses and condos - Fuel oil, kerosene, etc. (%)
House heating fuel used in houses and condos - Coal or coke (%)
House heating fuel used in houses and condos - Wood (%)
House heating fuel used in houses and condos - Solar energy (%)
House heating fuel used in houses and condos - Other fuel (%)
House heating fuel used in houses and condos - No fuel used (%)
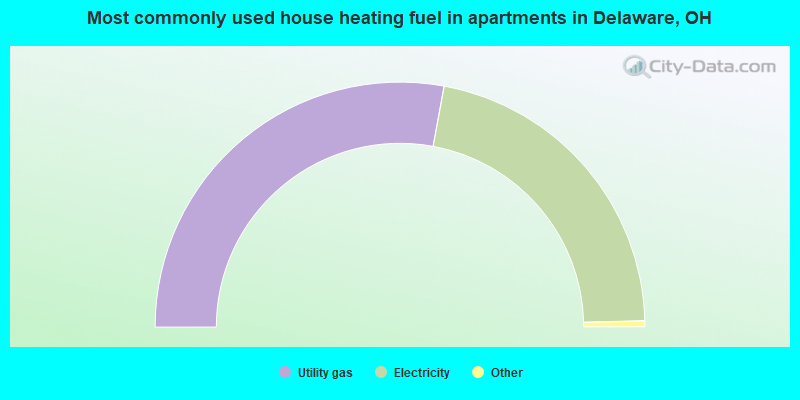
House heating fuel used in apartments - Utility gas (%)
House heating fuel used in apartments - Bottled, tank, or LP gas (%)
House heating fuel used in apartments - Electricity (%)
House heating fuel used in apartments - Fuel oil, kerosene, etc. (%)
House heating fuel used in apartments - Coal or coke (%)
House heating fuel used in apartments - Wood (%)
House heating fuel used in apartments - Solar energy (%)
House heating fuel used in apartments - Other fuel (%)
House heating fuel used in apartments - No fuel used (%)
Latest news about housing in Delaware, OH collected exclusively by city-data.com from local newspapers, TV, and radio stations
Median year house/condo built: 1995Median year apartment built: 1989Household type by relationship:
Households: 43,909
Male householders: 8,960 (2,021 living alone ), Female householders: 7,823 (2,200 living alone )8,667 spouses (8,595 opposite-sex spouses ), 1,099 unmarried partners , (1,099 opposite-sex unmarried partners ), 13,004 children (12,149 natural , 252 adopted , 602 stepchildren ), 449 grandchildren , 135 brothers or sisters , 390 parents , 54 foster children , 489 other relatives , 962 non-relatives In group quarters: 1,872
Size of family households: 5,190 2-persons , 2,709 3-persons , 2,327 4-persons , 1,060 5-persons , 223 6-persons , 137 7-or-more-persons .
Size of nonfamily households: 4,072 1-person , 1,004 2-persons , 83 3-persons , 65 4-persons , 5 5-persons .
7,048 married couples with children. single-parent households (484 men , 1,686 women ).
93.0% of residents of Delaware speak English at home. of residents speak Spanish at home (61% speak English very well , 35% speak English well , 4% speak English not well ).of residents speak other Indo-European language at home (90% speak English very well , 8% speak English well , 2% speak English not well ).of residents speak Asian or Pacific Island language at home (66% speak English very well , 18% speak English well , 15% speak English not well ).of residents speak other language at home (93% speak English very well , 3% speak English well , 4% speak English not well ).
Foreign born population: 2,532 (5.8%)of them are naturalized citizens )
Median number of rooms in houses and condos:
Median number of rooms in apartments
Owner-occupied Renter-occupied
Rooms in owner-occupied houses in Delaware, Ohio
0 1 room 27 2 rooms 88 3 rooms 591 4 rooms 1,608 5 rooms 1,926 6 rooms 2,169 7 rooms 2,043 8 rooms 2,107 9+ rooms
Rooms in renter-occupied apartments in Delaware, Ohio
292 1 room 223 2 rooms 1,174 3 rooms 2,098 4 rooms 1,265 5 rooms 500 6 rooms 333 7 rooms 282 8 rooms 179 9+ rooms
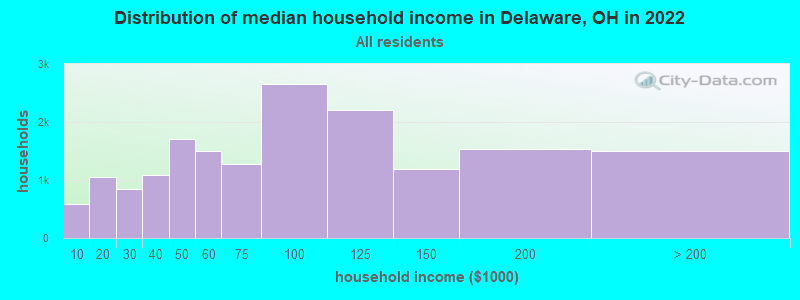
Delaware, OH household income distribution 588 Less than $10,0001,048 $10,000 to $19,999853 $20,000 to $29,9991,092 $30,000 to $39,9991,709 $40,000 to $49,9991,500 $50,000 to $59,9991,275 $60,000 to $74,9992,655 $75,000 to $99,9992,213 $100,000 to $124,9991,194 $125,000 to $149,9991,534 $150,000 to $199,9991,506 $200,000 or more
Home value of owner - occupied houses in 2022 in Delaware, OH 330 Less than $10,00059 $10,000 to $14,99933 $15,000 to $19,99933 $20,000 to $24,99923 $25,000 to $29,99958 $30,000 to $34,9998 $35,000 to $39,99940 $40,000 to $49,99925 $50,000 to $59,99985 $60,000 to $69,99964 $70,000 to $79,99972 $80,000 to $89,99927 $90,000 to $99,999119 $100,000 to $124,999423 $125,000 to $149,999287 $150,000 to $174,999272 $175,000 to $199,9991,794 $200,000 to $249,9991,028 $250,000 to $299,9991,835 $300,000 to $399,999948 $400,000 to $499,999798 $500,000 to $749,99916 $1,000,000 to $1,499,99919 $2,000,000 or moreRent paid by renters in 2022 in Delaware, OH 15 Less than $10028 $200 to $24927 $250 to $29963 $300 to $34963 $350 to $399114 $400 to $44982 $450 to $499167 $500 to $54945 $550 to $599178 $600 to $649224 $650 to $699417 $700 to $749137 $750 to $799882 $800 to $899659 $900 to $9991,307 $1,000 to $1,249677 $1,250 to $1,499722 $1,500 to $1,999182 $2,000 to $2,49919 $2,500 to $2,99922 $3,500 or more92 No cash rent
Percentage of workers working in this county: 67.3%Number of people working at home: 4,214 (18.6% of all workers )
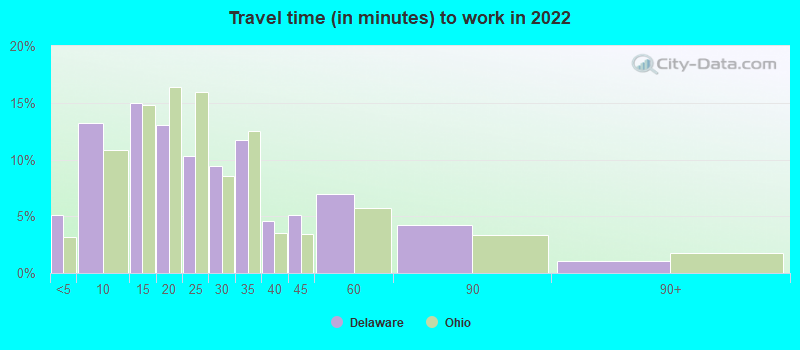
Travel time to work (commute)
Less than 5 minutes: 6955 to 9 minutes: 2,12810 to 14 minutes: 2,16915 to 19 minutes: 2,15420 to 24 minutes: 1,58325 to 29 minutes: 1,64630 to 34 minutes: 2,83635 to 39 minutes: 1,63940 to 44 minutes: 77645 to 59 minutes: 1,36960 to 89 minutes: 69090 or more minutes: 282
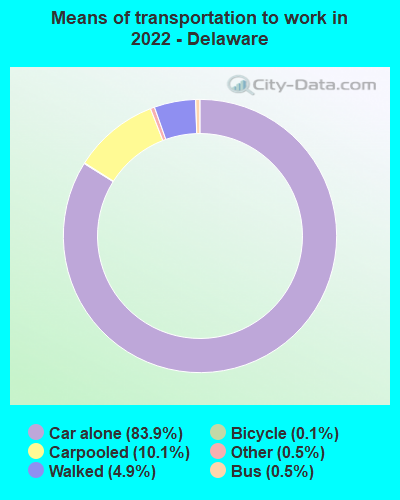
Means of transportation to work:
Drove a car alone: 13,381 (67.5%)Carpooled: 1,726 (8.7%)Bus : 74 (0.4%)Taxi: 101 (0.5%)Bicycle: 24 (0.1%)Walked: 778 (3.9%)Worked at home: 4,214 (21.2%)
Unemployment by race in 2022
Unemployment rate for White non-Hispanic residents 6.6% Males1.7% FemalesUnemployment rate for Black residents 8.5% Males6.4% FemalesUnemployment rate for American Indian and Alaska Native residents 100.0% FemalesUnemployment rate for Asian residents 3.5% FemalesUnemployment rate for two or more race residents 1.3% Males1.1% FemalesUnemployment rate for Hispanic or Latino residents 1.9% Males2.1% Females
Year of entry for the foreign-born population in Delaware, Ohio
1,053 2010 or later 483 2000 to 2009 431 1990 to 1999 62 1980 to 1989 46 1970 to 1979 72 Before 1970
First ancestries reported:
German: 3,070 (17.9%)
English: 2,357 (13.7%)
Irish: 1,738 (10.1%)
American: 1,264 (7.4%)
European: 878 (5.1%)
Italian: 664 (3.9%)
Welsh: 297 (1.7%)
Scottish: 281 (1.6%)
British: 181 (1.1%)
Polish: 152 (0.9%)
Scotch-Irish: 150 (0.9%)
African: 124 (0.7%)
French: 115 (0.7%)
Eastern European: 113 (0.7%)
Norwegian: 108 (0.6%)
Ghanaian: 104 (0.6%)
Scandinavian: 99 (0.6%)
Sierra Leonean: 93 (0.5%)
Somali: 92 (0.5%)
Kenyan: 82 (0.5%)
Hungarian: 81 (0.5%)
Dutch: 71 (0.4%)
Greek: 60 (0.3%)
Czechoslovakian: 54 (0.3%)
Northern European: 52 (0.3%)
Lithuanian: 41 (0.2%)
Austrian: 29 (0.2%)
Russian: 24 (0.1%)
Swedish: 21 (0.1%)
Czech: 20 (0.1%)
Slovak: 19 (0.1%)
French Canadian: 18 (0.1%)
Swiss: 14 (0.08%)
Haitian: 14 (0.08%)
Cypriot: 13 (0.08%)
Romanian: 11 (0.06%)
Nigerian: 11 (0.06%)
Canadian: 10 (0.06%)
Slavic: 10 (0.06%)
Yugoslavian: 10 (0.06%)
Croatian: 9 (0.05%)
Lebanese: 8 (0.05%)
Ethiopian: 3 (0.02%)
South African: 3 (0.02%)
Jamaican: 1 (0.01%) Most common places of birth for foreign-born residents (%): India Delaware:
39.3% (838)Ohio:
11.6% (66,525)
China, excluding Hong Kong and Taiwan Delaware:
6.9% (148)Ohio:
6.2% (35,703)
Pakistan Delaware:
6.7% (142)Ohio:
1.0% (5,444)
Ghana Delaware:
4.2% (89)Ohio:
1.8% (10,561)
Vietnam Delaware:
4.1% (87)Ohio:
1.9% (10,960)
Brazil Delaware:
3.6% (76)Ohio:
0.9% (5,101)
Belize Delaware:
3.2% (69)Ohio:
0.0% (268)
Peru Delaware:
2.6% (55)Ohio:
0.6% (3,210)
Korea Delaware:
2.4% (51)Ohio:
2.0% (11,398)
Germany Delaware:
2.3% (50)Ohio:
2.2% (12,846)
Mexico Delaware:
2.2% (47)Ohio:
7.8% (44,796)
Kenya Delaware:
2.2% (47)Ohio:
1.0% (5,674)
Canada Delaware:
2.0% (43)Ohio:
2.6% (14,988)
Somalia Delaware:
1.8% (39)Ohio:
2.2% (12,861)
Sierra Leone Delaware:
1.7% (37)Ohio:
0.5% (2,658)
Place of birth for U.S.-born residents:
This state: 31,471Other state: 9,185Northeast: 2,855Midwest: 2,193South: 2,987West: 1,171 84.2% of Delaware residents lived in the same house 1 years ago.
Out of people who lived in different houses, 31.8% lived in this county.
Out of people who lived in different counties, 80.9% lived in Ohio.
Delaware:
84.2%State average:
87.8%
Education attainment for males 25 years and older:
No schooling: 94Nursery to 4th grade: 05th and 6th grade: 127th and 8th grade: 629th grade: 15610th grade: 9411th grade: 30512th grade, no diploma: 261High school graduate (or equivalency): 3,668Less than 1 year of college: 912Some college more than 1 year, no degree: 2,025Associate degree: 708Bachelor's degree: 3,983Master's degree: 1,763Professional school degree: 206Doctorate degree: 310
Education attainment for females 25 years and older:
No schooling: 55Nursery to 4th grade: 05th and 6th grade: 07th and 8th grade: 129th grade: 10810th grade: 11211th grade: 12912th grade, no diploma: 252High school graduate (or equivalency): 3,790Less than 1 year of college: 766Some college more than 1 year, no degree: 1,835Associate degree: 1,220Bachelor's degree: 4,231Master's degree: 1,898Professional school degree: 195Doctorate degree: 227
Housing units in structures:
One, detached: 10,946One, attached: 1,624Two: 4953 or 4: 1,5285 to 9: 1,15110 to 19: 61820 to 49: 49850 or more: 575Mobile homes: 316Median worth of mobile homes: $14,668
Housing units lacking complete plumbing facilities in 2022: 1.1%Housing units lacking complete kitchen facilities in 2022: 1.6%House/condo owner moved in on average 11 years ago
Renter moved in on average 3 years ago
Private vs. public school enrollment:
Students in private schools in grades 1 to 8 (elementary and middle school): 631 Students in private schools in grades 9 to 12 (high school): 178 Students in private undergraduate colleges: 1,391