Housing density: 787 houses/condos per square mile
Median price asked for vacant for-sale houses and condos in 2022 in this county: $79,921.
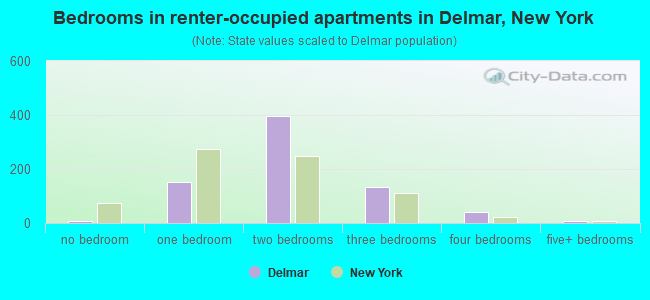
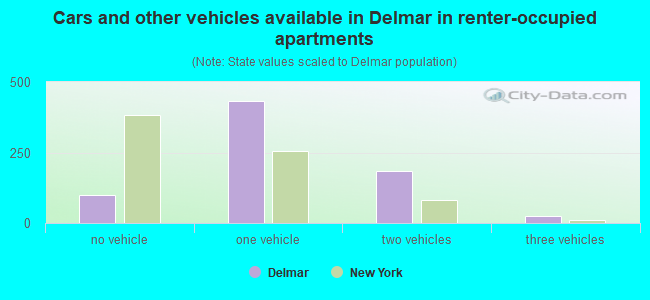
Median contract rent in 2022: $1,244 (lower quartile is $952, upper quartile is $1,482)
Median rent asked for vacant for-rent units in 2022: $965
Median gross rent in Delmar, NY in 2022: $1,335
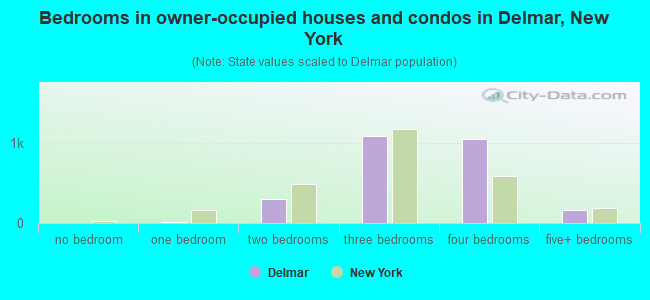
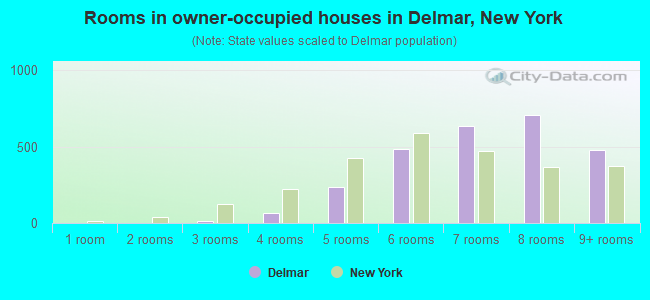
Housing units in Delmar with a mortgage: 1,768 (90 second mortgage, 315 home equity loan, 18 both second mortgage and home equity loan) Houses without a mortgage: 738
In family households: 216,717 (46,016 male householders, 25,348 female householders)
50,642 spouses, 76,299 children (72,025 natural, 1,918 adopted, 2,356 stepchildren), 3,969 grandchildren, 2,717 brothers or sisters, 2,237 parents, foster children, 2,377 other relatives, 5,881 non-relatives
In nonfamily households: 70,463 (25,546 male householders (18,848 living alone)), 29,341 female householders (23,879 living alone)), 15,576 nonrelatives
In group quarters: 17,024 (3,059 institutionalized population)
42,356 married couples with children.
18,822 single-parent households (3,253 men, 15,569 women).
93.9% of residents of Delmar speak English at home.
1.5% of residents speak Spanish at home (100% speak English very well).
3.6% of residents speak other Indo-European language at home (77% speak English very well, 17% speak English well, 7% speak English not well).
0.7% of residents speak Asian or Pacific Island language at home (17% speak English very well, 83% speak English not well).
0.3% of residents speak other language at home (27% speak English very well, 73% speak English well).
Foreign born population: 988 (11.2%)
(69.4% of them are naturalized citizens)
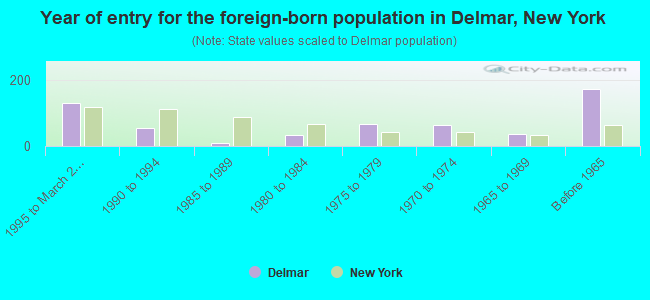
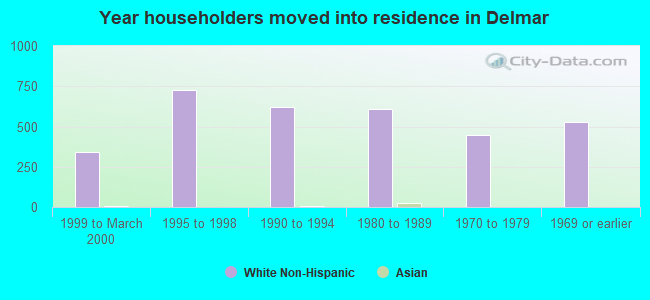
Year of entry for the foreign-born population in Delmar, New York
1311995 to March 2000
541990 to 1994
91985 to 1989
341980 to 1984
661975 to 1979
641970 to 1974
371965 to 1969
172Before 1965
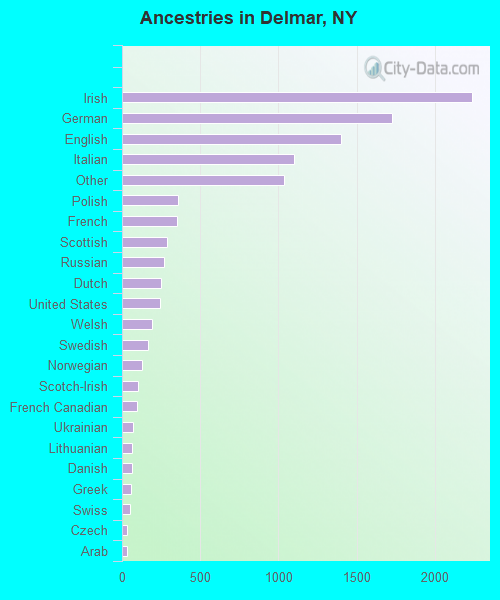
First ancestries reported:
Irish: 2,235 (21.6%)
German: 1,724 (16.7%)
English: 1,401 (13.5%)
Italian: 1,103 (10.7%)
Other: 1,036 (10.0%)
Polish: 357 (3.5%)
French: 351 (3.4%)
Scottish: 289 (2.8%)
Russian: 266 (2.6%)
Dutch: 250 (2.4%)
United States: 243 (2.4%)
Welsh: 195 (1.9%)
Swedish: 165 (1.6%)
Norwegian: 125 (1.2%)
Scotch-Irish: 104 (1.0%)
French Canadian: 96 (0.9%)
Ukrainian: 68 (0.7%)
Lithuanian: 65 (0.6%)
Danish: 62 (0.6%)
Greek: 56 (0.5%)
Swiss: 50 (0.5%)
Czech: 35 (0.3%)
Arab: 29 (0.3%)
Slovak: 15 (0.1%)
Hungarian: 13 (0.1%)
Portuguese: 7 (0.07%)
Most common places of birth for foreign-born residents (%):
Germany
Delmar:
15.5% (88)
New York:
1.8% (69,327)
Canada
Delmar:
12.2% (69)
New York:
1.4% (54,876)
United Kingdom
Delmar:
11.3% (64)
New York:
1.6% (62,237)
China, excluding Hong Kong and Taiwan
Delmar:
9.3% (53)
New York:
6.0% (233,766)
Pakistan
Delmar:
6.3% (36)
New York:
1.3% (51,055)
Korea
Delmar:
6.2% (35)
New York:
2.5% (97,933)
Guyana
Delmar:
4.4% (25)
New York:
3.7% (142,154)
Jordan
Delmar:
3.9% (22)
New York:
0.1% (4,084)
Russia
Delmar:
3.5% (20)
New York:
2.4% (94,595)
Other South Central Asia
Delmar:
3.2% (18)
New York:
0.6% (23,797)
Colombia
Delmar:
3.2% (18)
New York:
2.9% (111,727)
Ireland
Delmar:
3.0% (17)
New York:
1.1% (41,934)
Czechoslovakia (includes Czech Republic and Slovakia)
Delmar:
2.1% (12)
New York:
0.3% (13,246)
Iran
Delmar:
2.1% (12)
New York:
0.4% (17,323)
Venezuela
Delmar:
2.1% (12)
New York:
0.3% (10,645)
Taiwan
Delmar:
1.6% (9)
New York:
0.8% (30,473)
India
Delmar:
1.6% (9)
New York:
3.0% (117,238)
Place of birth for U.S.-born residents:
This state: 5,824
Other state: 1,833
Northeast: 1,043
Midwest: 356
South: 290
West: 144
70% of Delmar residents lived in the same house 5 years ago. Out of people who lived in different houses, 68% lived in this county. Out of people who lived in different counties, 62% lived in New York.
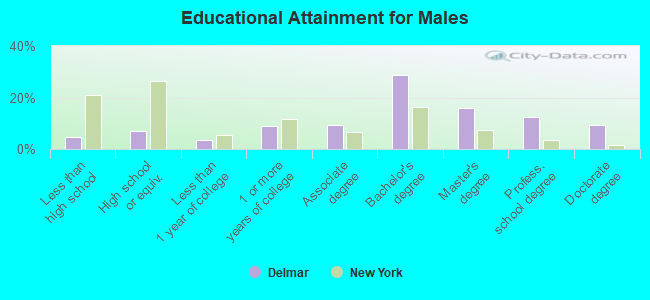
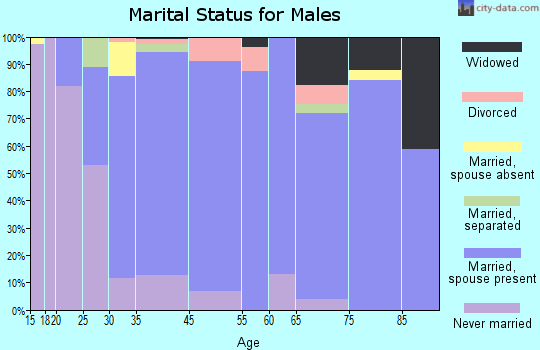
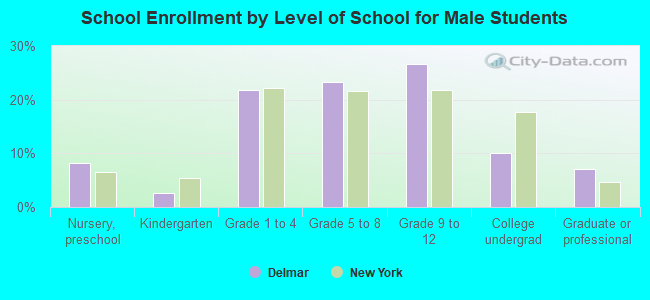
Education attainment for males 25 years and older:
No schooling: 17
Nursery to 4th grade: 6
5th and 6th grade: 0
7th and 8th grade: 9
9th grade: 0
10th grade: 31
11th grade: 19
12th grade, no diploma: 38
High school graduate (or equivalency): 188
Less than 1 year of college: 93
Some college more than 1 year, no degree: 239
Associate degree: 246
Bachelor's degree: 755
Master's degree: 421
Professional school degree: 327
Doctorate degree: 245
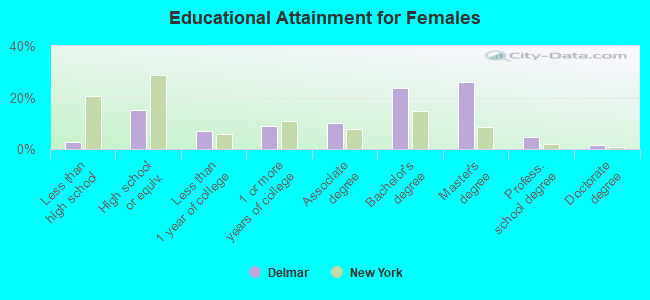
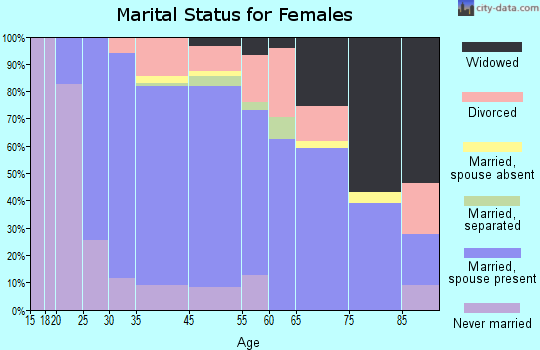
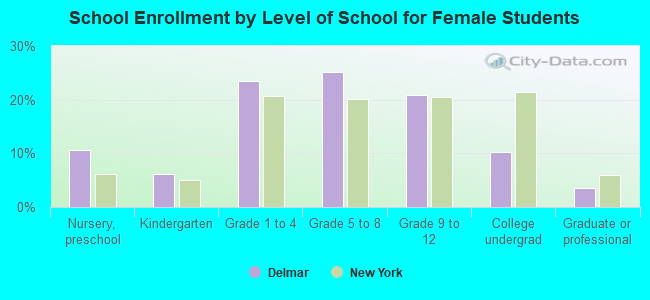
Education attainment for females 25 years and older:
No schooling: 0
Nursery to 4th grade: 7
5th and 6th grade: 0
7th and 8th grade: 6
9th grade: 16
10th grade: 0
11th grade: 8
12th grade, no diploma: 44
High school graduate (or equivalency): 480
Less than 1 year of college: 221
Some college more than 1 year, no degree: 287
Associate degree: 318
Bachelor's degree: 757
Master's degree: 827
Professional school degree: 148
Doctorate degree: 53
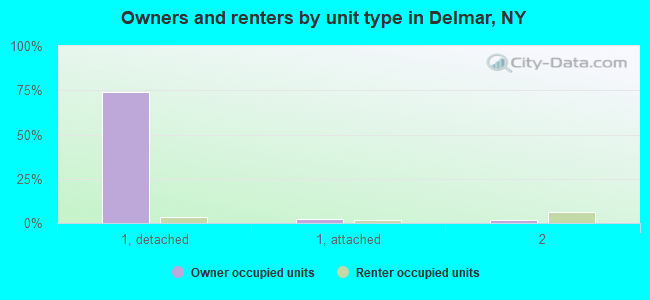
Housing units in structures:
One, detached: 2,658
One, attached: 131
Two: 288
3 or 4: 312
5 to 9: 27
10 to 19: 14
20 to 49: 19
Housing units lacking complete plumbing facilities: 0.2%