Dentsville, SC (South Carolina) Houses and Residents
Estimated median house or condo value in 2022: $170,025 (it was $85,500 in 2000 )
Dentsville:
$170,025South Carolina:
$254,600
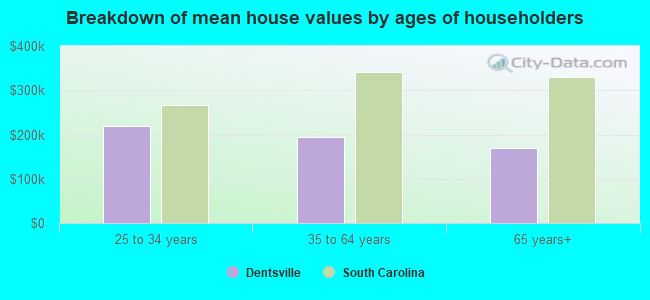
Lower value quartile - upper value quartile: $116,294 - $209,667Mean price in 2022: Detached houses: $181,059 Here:
$181,059State:
$368,255
Townhouses or other attached units: $112,528 Here:
$112,528State:
$292,023
In 3-to-4-unit structures: $114,467 Here:
$114,467State:
$230,702
In 5-or-more-unit structures: $601,570 Here:
$601,570State:
$326,361
Mobile homes: $144,173 Here:
$144,173State:
$102,531
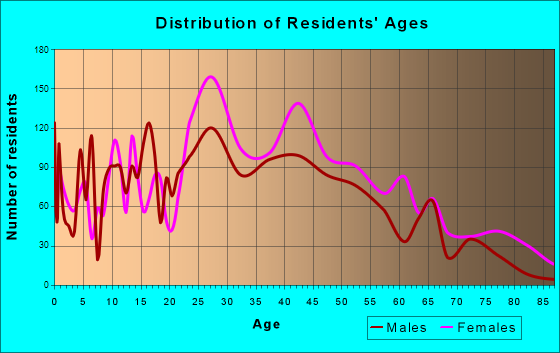
Total population: 14,062 (Urban population: 12,824, Rural population: 0)
Houses: 8,051 (7,368 occupied: 2,712 owner occupied, 4,740 renter occupied )
% of renters here:
64%State:
28%
Housing density: 1,142 houses/condos per square mile
Median price asked for vacant for-sale houses and condos in 2022: $143,807.
Median contract rent in 2022: $931 (lower quartile is $772, upper quartile is $1,133)
Median rent asked for vacant for-rent units in 2022: $1,943
Median gross rent in Dentsville, SC in 2022: $1,150
Housing units in Dentsville with a mortgage: 1,872 (52 second mortgage, 0 home equity loan, 45 both second mortgage and home equity loan )Houses without a mortgage: 0
Median household income for houses/condos with a mortgage: $59,434
Median household income for apartments without a mortgage: $36,146
Median monthly housing costs: $1,090
Data:
Median house or condo value ($)
Median house or condo value ($ change since 2000)
Median house or condo value ($) - White
Median house or condo value ($) - Black or African American
Median house or condo value ($) - Asian
Median house or condo value ($) - Hispanic or Latino
Median house or condo value ($) - American Indian and Alaska Native
Median house or condo value ($) - Multirace
Median house or condo value ($) - Other Race
Median price asked for mobile homes ($)
Household density (households per square mile)
Mean house or condo value by units in structure - 1, detached ($)
Mean house or condo value by units in structure - 1, attached ($)
Mean house or condo value by units in structure - 2 ($)
Mean house or condo value by units in structure by units in structure - 3 or 4 ($)
Mean house or condo value by units in structure - 5 or more ($)
Mean house or condo value by units in structure - Boat, RV, van, etc. ($)
Mean house or condo value by units in structure - Mobile home ($)
Median contract rent ($)
Median contract rent - Lower quartile ($)
Median contract rent - Upper quartile ($)
Median gross rent ($)
Urban houses (%)
Rural houses (%)
Houses occupied (%)
Houses occupied (% change since 2000)
Houses owner occupied (%)
Houses owner occupied (% change since 2000)
Houses renter occupied (%)
Houses renter occupied (% change since 2000)
Vacant housing units - For rent (%)
Vacant housing units - For rent (% change since 2000)
Vacant housing units - For sale only (%)
Vacant housing units - For sale only (% change since 2000)
Vacant housing units - Rented or sold, not occupied (%)
Vacant housing units - Rented or sold, not occupied (% change since 2000)
Vacant housing units - For seasonal, recreational, or occasional use (%)
Vacant housing units - For seasonal, recreational, or occasional use (% change since 2000)
Vacant housing units - For migrant workers (%)
Vacant housing units - For migrant workers (% change since 2000)
Vacant housing units - Other vacant (%)
Vacant housing units - Other vacant (% change since 2000)
Median monthly housing costs ($)
Median household income for houses/condos with a mortgage ($)
Median household income for houses/condos without a mortgage ($)
Median household income ($)
Median household income ($) - White
Median household income ($) - Black or African American
Median household income ($) - Asian
Median household income ($) - Hispanic or Latino
Median household income ($) - American Indian and Alaska Native
Median household income ($) - Multirace
Median household income ($) - Other Race
Mortgage status - with mortgage (%)
Mortgage status - with second mortgage (%)
Mortgage status - with home equity loan (%)
Mortgage status - with both second mortgage and home equity loan (%)
Mortgage status - without a mortgage (%)
Median year house/condo built
Median year apartment built
Household type by relationship - Male householder living alone (%)
Household type by relationship - Male householder not living alone (%)
Household type by relationship - Female householder living alone (%)
Household type by relationship - Female householder not living alone (%)
Household type by relationship - Opposite-Sex spouse (%)
Household type by relationship - Same-Sex spouse (%)
Household type by relationship - Opposite-Sex unmarried partner (%)
Household type by relationship - Same-Sex unmarried partner (%)
Household type by relationship - In group quarters (%)
Size of family households - 2-person household (%)
Size of family households - 3-person household (%)
Size of family households - 4-person household (%)
Size of family households - 5-person household (%)
Size of family households - 6-person household (%)
Size of family households - 7-or-more-person household (%)
Size of nonfamily households - 1-person household (%)
Size of nonfamily households - 2-person household (%)
Size of nonfamily households - 3-person household (%)
Size of nonfamily households - 4-person household (%)
Size of nonfamily households - 5-person household (%)
Size of nonfamily households - 6-person household (%)
Size of nonfamily households - 7-or-moreperson household (%)
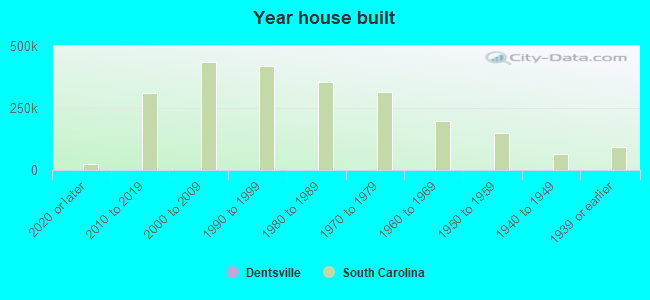
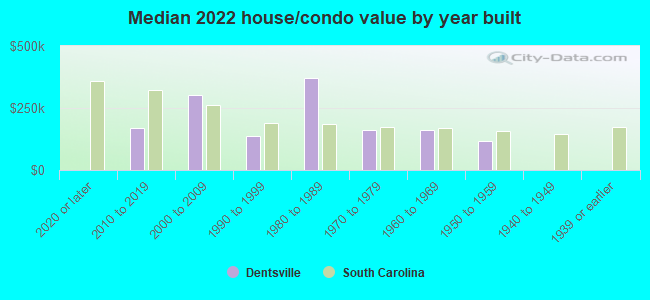
Year house built - Built 2010 or later (%)
Year house built - Built 2000 to 2009 (%)
Year house built - Built 1990 to 1999 (%)
Year house built - Built 1980 to 1989 (%)
Year house built - Built 1970 to 1979 (%)
Year house built - Built 1960 to 1969 (%)
Year house built - Built 1950 to 1959 (%)
Year house built - Built 1940 to 1949 (%)
Year house built - Built 1939 or earlier (%)
Median number of rooms in houses and condos
Median number of rooms in apartments
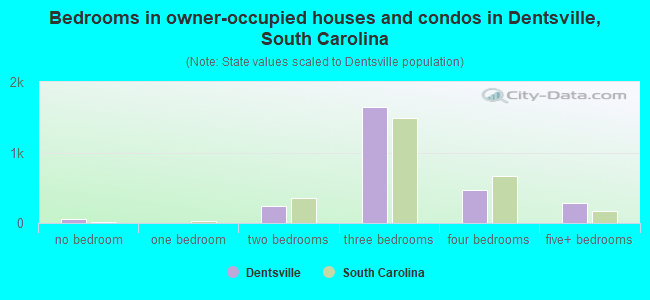
Median number of bedrooms in owner occupied houses
Mean number of bedrooms in owner occupied houses
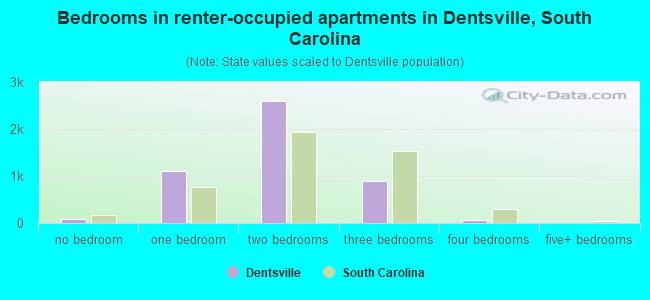
Median number of bedrooms in renter occupied houses
Mean number of bedrooms in renter occupied houses
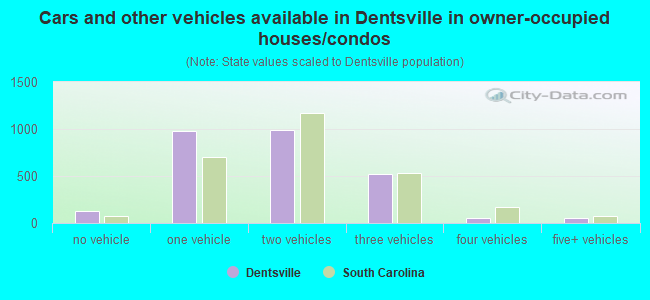
Median number of vehichles in owner occupied houses
Mean number of vehichles in owner occupied houses
Median number of vehichles in renter occupied houses
Mean number of vehichles in renter occupied houses
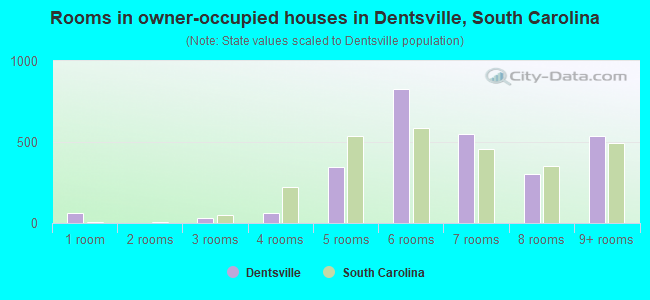
Rooms in owner-occupied houses - 1 room (%)
Rooms in owner-occupied houses - 2 rooms (%)
Rooms in owner-occupied houses - 3 rooms (%)
Rooms in owner-occupied houses - 4 rooms (%)
Rooms in owner-occupied houses - 5 rooms (%)
Rooms in owner-occupied houses - 6 rooms (%)
Rooms in owner-occupied houses - 7 rooms (%)
Rooms in owner-occupied houses - 8 rooms (%)
Rooms in owner-occupied houses - 9+ rooms (%)
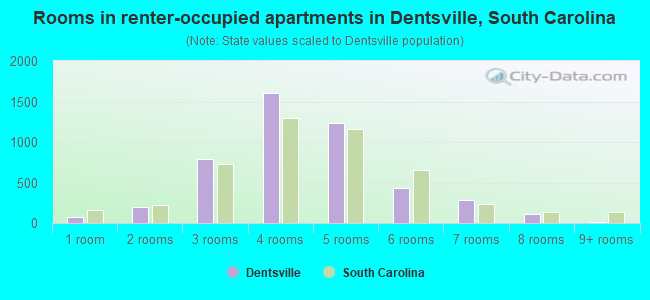
Rooms in renter-occupied houses - 1 room (%)
Rooms in renter-occupied houses - 2 rooms (%)
Rooms in renter-occupied houses - 3 rooms (%)
Rooms in renter-occupied houses - 4 rooms (%)
Rooms in renter-occupied houses - 5 rooms (%)
Rooms in renter-occupied houses - 6 rooms (%)
Rooms in renter-occupied houses - 7 rooms (%)
Rooms in renter-occupied houses - 8 rooms (%)
Rooms in renter-occupied houses - 9+ rooms (%)
Bedrooms in owner-occupied houses - no bedrooms (%)
Bedrooms in owner-occupied houses - 1 bedroom (%)
Bedrooms in owner-occupied houses - 2 bedrooms (%)
Bedrooms in owner-occupied houses - 3 bedrooms (%)
Bedrooms in owner-occupied houses - 4 bedrooms (%)
Bedrooms in owner-occupied houses - 5+ bedrooms (%)
Bedrooms in renter-occupied houses - no bedrooms (%)
Bedrooms in renter-occupied houses - 1 bedroom (%)
Bedrooms in renter-occupied houses - 2 bedrooms (%)
Bedrooms in renter-occupied houses - 3 bedrooms (%)
Bedrooms in renter-occupied houses - 4 bedrooms (%)
Bedrooms in renter-occupied houses - 5+ bedrooms (%)
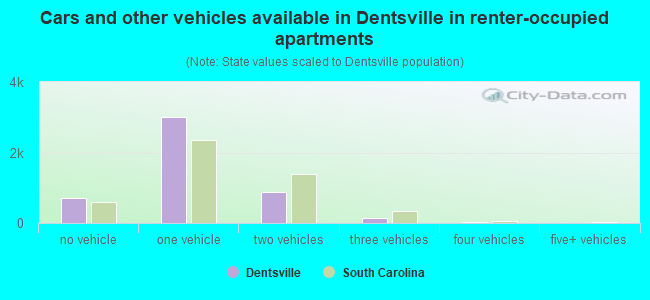
Vehicles available in owner-occupied houses - no vehicle available (%)
Vehicles available in owner-occupied houses - 1 vehicle available(%)
Vehicles available in owner-occupied houses - 2 Vehicles available (%)
Vehicles available in owner-occupied houses - 3 Vehicles available (%)
Vehicles available in owner-occupied houses - 4 Vehicles available (%)
Vehicles available in owner-occupied houses - 5+ Vehicles available (%)
Vehicles available in renter-occupied houses - no vehicle available (%)
Vehicles available in renter-occupied houses - 1 vehicle available (%)
Vehicles available in renter-occupied houses - 2 Vehicles available (%)
Vehicles available in renter-occupied houses - 3 Vehicles available (%)
Vehicles available in renter-occupied houses - 4 Vehicles available (%)
Vehicles available in renter-occupied houses - 5+ Vehicles available (%)
Housing units in structures - 1, detached (%)
Housing units in structures - 1, attached (%)
Housing units in structures - 2 (%)
Housing units in structures - 3 or 4 (%)
Housing units in structures - 5 to 9 (%)
Housing units in structures - 10 to 19 (%)
Housing units in structures - 20 to 49 (%)
Housing units in structures - 50 or more (%)
Housing units in structures - Mobile home (%)
Housing units in structures - Boat, RV, van, etc. (%)
Housing units in structures - Owners - 1, detached (%)
Housing units in structures - Owners - 1, attached (%)
Housing units in structures - Owners - 2 (%)
Housing units in structures - Owners - 3 or 4 (%)
Housing units in structures - Owners - 5 to 9 (%)
Housing units in structures - Owners - 10 to 19 (%)
Housing units in structures - Owners - 20 to 49 (%)
Housing units in structures - Owners - 50 or more (%)
Housing units in structures - Owners - Mobile home (%)
Housing units in structures - Owners - Boat, RV, van, etc. (%)
Housing units in structures - Renters - 1, detached (%)
Housing units in structures - Renters - 1, attached (%)
Housing units in structures - Renters - 2 (%)
Housing units in structures - Renters - 3 or 4 (%)
Housing units in structures - Renters - 5 to 9 (%)
Housing units in structures - Renters - 10 to 19 (%)
Housing units in structures - Renters - 20 to 49 (%)
Housing units in structures - Renters - 50 or more (%)
Housing units in structures - Renters - Mobile home (%)
Housing units in structures - Renters - Boat, RV, van, etc. (%)
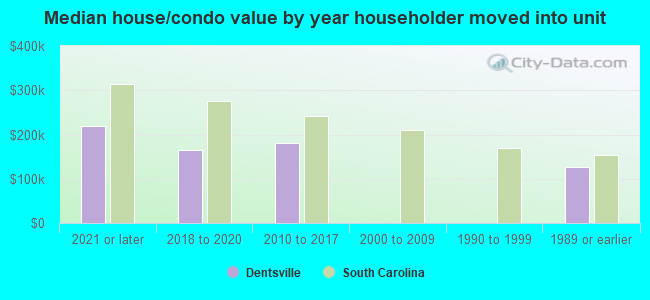
House/condo owner moved in on average (years ago)
Renter moved in on average (years ago)
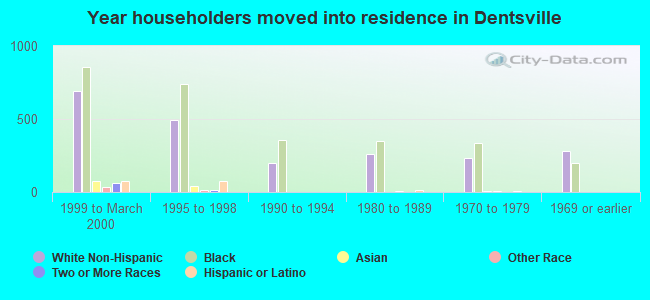
Year householder moved into unit - Moved in 1999 to March 2000 (%)
Year householder moved into unit - Moved in 1999 to March 2000 (%) - White
Year householder moved into unit - Moved in 1999 to March 2000 (%) - Black or African American
Year householder moved into unit - Moved in 1999 to March 2000 (%) - Asian
Year householder moved into unit - Moved in 1999 to March 2000 (%) - Hispanic or Latino
Year householder moved into unit - Moved in 1999 to March 2000 (%) - American Indian and Alaska Native
Year householder moved into unit - Moved in 1999 to March 2000 (%) - Multirace
Year householder moved into unit - Moved in 1999 to March 2000 (%) - Other Race
Year householder moved into unit - Moved in 1995 to 1998 (%)
Year householder moved into unit - Moved in 1995 to 1998 (%) - White
Year householder moved into unit - Moved in 1995 to 1998 (%) - Black or African American
Year householder moved into unit - Moved in 1995 to 1998 (%) - Asian
Year householder moved into unit - Moved in 1995 to 1998 (%) - Hispanic or Latino
Year householder moved into unit - Moved in 1995 to 1998 (%) - American Indian and Alaska Native
Year householder moved into unit - Moved in 1995 to 1998 (%) - Multirace
Year householder moved into unit - Moved in 1995 to 1998 (%) - Other Race
Year householder moved into unit - Moved in 1990 to 1994 (%)
Year householder moved into unit - Moved in 1990 to 1994 (%) - White
Year householder moved into unit - Moved in 1990 to 1994 (%) - Black or African American
Year householder moved into unit - Moved in 1990 to 1994 (%) - Asian
Year householder moved into unit - Moved in 1990 to 1994 (%) - Hispanic or Latino
Year householder moved into unit - Moved in 1990 to 1994 (%) - American Indian and Alaska Native
Year householder moved into unit - Moved in 1990 to 1994 (%) - Multirace
Year householder moved into unit - Moved in 1990 to 1994 (%) - Other Race
Year householder moved into unit - Moved in 1980 to 1989 (%)
Year householder moved into unit - Moved in 1980 to 1989 (%) - White
Year householder moved into unit - Moved in 1980 to 1989 (%) - Black or African American
Year householder moved into unit - Moved in 1980 to 1989 (%) - Asian
Year householder moved into unit - Moved in 1980 to 1989 (%) - Hispanic or Latino
Year householder moved into unit - Moved in 1980 to 1989 (%) - American Indian and Alaska Native
Year householder moved into unit - Moved in 1980 to 1989 (%) - Multirace
Year householder moved into unit - Moved in 1980 to 1989 (%) - Other Race
Year householder moved into unit - Moved in 1970 to 1979 (%)
Year householder moved into unit - Moved in 1970 to 1979 (%) - White
Year householder moved into unit - Moved in 1970 to 1979 (%) - Black or African American
Year householder moved into unit - Moved in 1970 to 1979 (%) - Asian
Year householder moved into unit - Moved in 1970 to 1979 (%) - Hispanic or Latino
Year householder moved into unit - Moved in 1970 to 1979 (%) - American Indian and Alaska Native
Year householder moved into unit - Moved in 1970 to 1979 (%) - Multirace
Year householder moved into unit - Moved in 1970 to 1979 (%) - Other Race
Year householder moved into unit - Moved in 1969 or earlier (%)
Year householder moved into unit - Moved in 1969 or earlier (%) - White
Year householder moved into unit - Moved in 1969 or earlier (%) - Black or African American
Year householder moved into unit - Moved in 1969 or earlier (%) - Asian
Year householder moved into unit - Moved in 1969 or earlier (%) - Hispanic or Latino
Year householder moved into unit - Moved in 1969 or earlier (%) - American Indian and Alaska Native
Year householder moved into unit - Moved in 1969 or earlier (%) - Multirace
Year householder moved into unit - Moved in 1969 or earlier (%) - Other Race
Housing units lacking complete plumbing facilities (%)
Housing units lacking complete kitchen facilities (%)
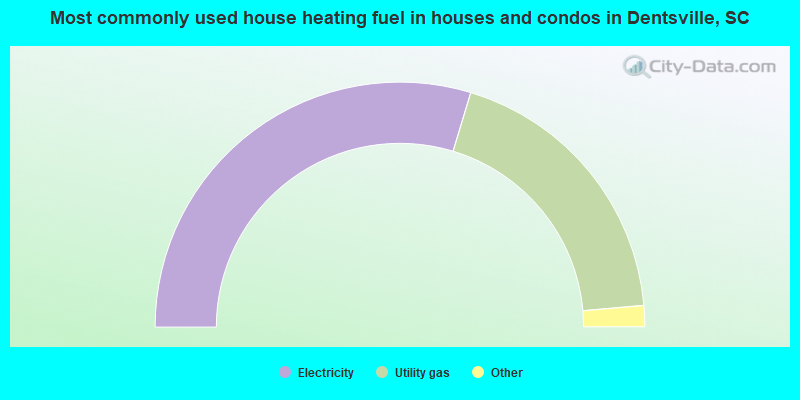
House heating fuel used in houses and condos - Utility gas (%)
House heating fuel used in houses and condos - Bottled, tank, or LP gas (%)
House heating fuel used in houses and condos - Electricity (%)
House heating fuel used in houses and condos - Fuel oil, kerosene, etc. (%)
House heating fuel used in houses and condos - Coal or coke (%)
House heating fuel used in houses and condos - Wood (%)
House heating fuel used in houses and condos - Solar energy (%)
House heating fuel used in houses and condos - Other fuel (%)
House heating fuel used in houses and condos - No fuel used (%)
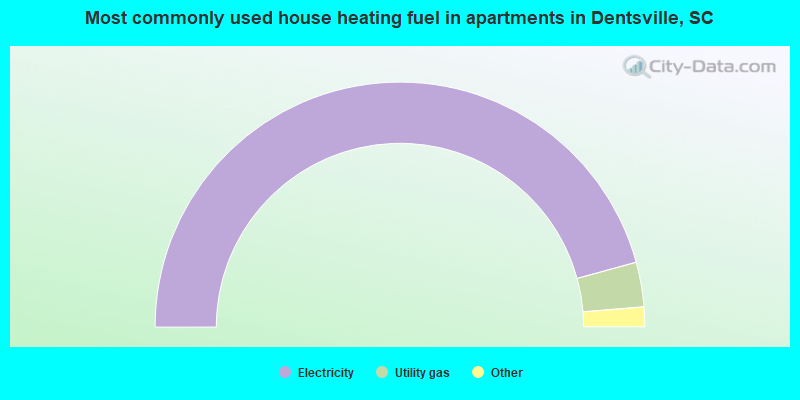
House heating fuel used in apartments - Utility gas (%)
House heating fuel used in apartments - Bottled, tank, or LP gas (%)
House heating fuel used in apartments - Electricity (%)
House heating fuel used in apartments - Fuel oil, kerosene, etc. (%)
House heating fuel used in apartments - Coal or coke (%)
House heating fuel used in apartments - Wood (%)
House heating fuel used in apartments - Solar energy (%)
House heating fuel used in apartments - Other fuel (%)
House heating fuel used in apartments - No fuel used (%)
Latest news about housing in Dentsville, SC collected exclusively by city-data.com from local newspapers, TV, and radio stations
Median year house/condo built: 1973Median year apartment built: 1989Household type by relationship:
Households: 16,611
Male householders: 2,793 (1,218 living alone ), Female householders: 4,481 (1,997 living alone )1,762 spouses (1,659 opposite-sex spouses ), 345 unmarried partners , (345 opposite-sex unmarried partners ), 5,314 children (5,174 natural , 69 adopted , 69 stepchildren ), 509 grandchildren , 236 brothers or sisters , 153 parents , 0 foster children , 462 other relatives , 314 non-relatives In group quarters: 238
Size of family households: 1,402 2-persons , 1,080 3-persons , 1,106 4-persons , 157 5-persons , 24 6-persons , 28 7-or-more-persons .
Size of nonfamily households: 3,266 1-person , 251 2-persons , 13 4-persons .
1,312 married couples with children. single-parent households (473 men , 1,317 women ).
92.2% of residents of Dentsville speak English at home. of residents speak Spanish at home (79% speak English very well , 7% speak English well , 14% speak English not well ).of residents speak other Indo-European language at home (69% speak English very well , 16% speak English well , 14% speak English not well , 1% don't speak English at all ).of residents speak Asian or Pacific Island language at home (76% speak English very well , 13% speak English well , 8% speak English not well , 2% don't speak English at all ).of residents speak other language at home (50% speak English very well , 50% speak English well ).
Foreign born population: 1,007 (6.1%)of them are naturalized citizens )
Median number of rooms in houses and condos:
Median number of rooms in apartments
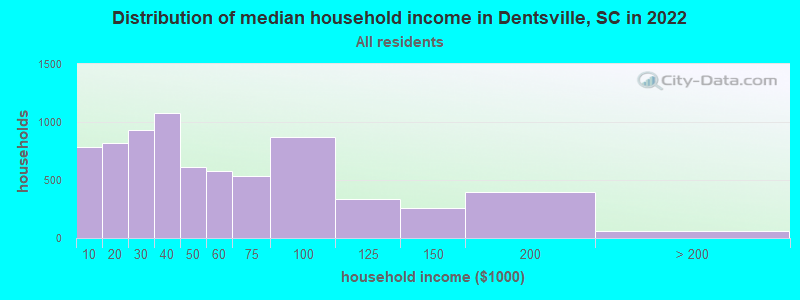
Dentsville, SC household income distribution 783 Less than $10,000820 $10,000 to $19,999932 $20,000 to $29,9991,081 $30,000 to $39,999615 $40,000 to $49,999576 $50,000 to $59,999537 $60,000 to $74,999868 $75,000 to $99,999340 $100,000 to $124,999255 $125,000 to $149,999399 $150,000 to $199,99962 $200,000 or more
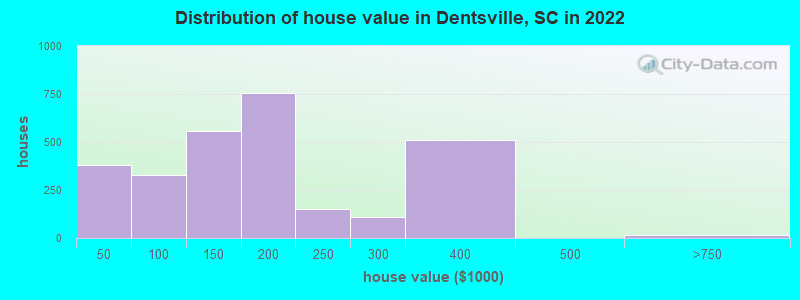
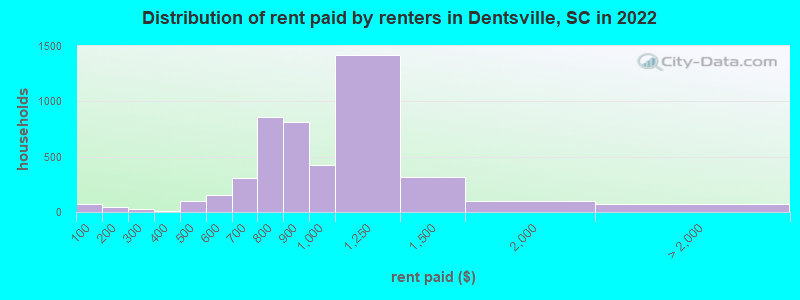
Home value of owner - occupied houses in 2022 in Dentsville, SC 32 Less than $10,000104 $10,000 to $14,99985 $15,000 to $19,9994 $30,000 to $34,999147 $35,000 to $39,9997 $40,000 to $49,99926 $50,000 to $59,99997 $60,000 to $69,99982 $70,000 to $79,99966 $80,000 to $89,99945 $90,000 to $99,999241 $100,000 to $124,999315 $125,000 to $149,999587 $150,000 to $174,999164 $175,000 to $199,999151 $200,000 to $249,999108 $250,000 to $299,999508 $300,000 to $399,9999 $500,000 to $749,9995 $750,000 to $999,999Rent paid by renters in 2022 in Dentsville, SC 68 Less than $10035 $100 to $1494 $150 to $19926 $250 to $2996 $300 to $34978 $400 to $44918 $450 to $49998 $500 to $54957 $550 to $599176 $600 to $649131 $650 to $699573 $700 to $749286 $750 to $799816 $800 to $899423 $900 to $9991,423 $1,000 to $1,249313 $1,250 to $1,499100 $1,500 to $1,99974 No cash rent
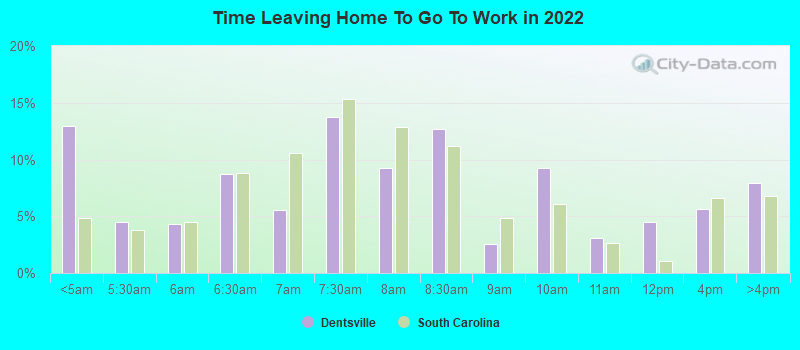
Percentage of workers working in this county: 79.9%Number of people working at home: 680 (8.6% of all workers )
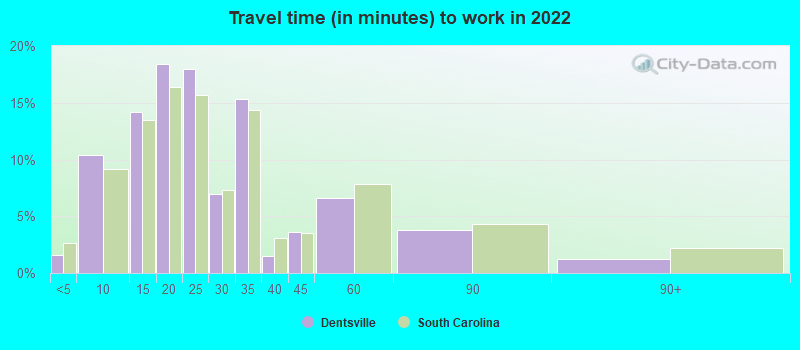
Travel time to work (commute)
Less than 5 minutes: 1135 to 9 minutes: 1,41210 to 14 minutes: 1,40015 to 19 minutes: 1,19220 to 24 minutes: 1,01225 to 29 minutes: 36530 to 34 minutes: 1,00635 to 39 minutes: 3540 to 44 minutes: 6845 to 59 minutes: 14560 to 89 minutes: 22590 or more minutes: 307
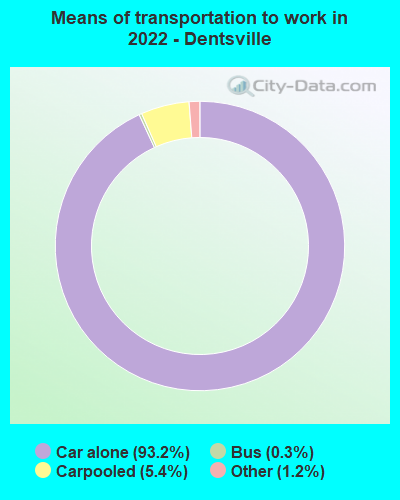
Means of transportation to work:
Drove a car alone: 6,149 (83.9%)Carpooled: 445 (6.1%)Bus : 22 (0.3%)Taxi: 112 (1.5%)Worked at home: 680 (9.3%)
Unemployment by race in 2022
Unemployment rate for White non-Hispanic residents 4.1% Males5.3% FemalesUnemployment rate for Black residents 5.7% Males10.2% FemalesUnemployment rate for Asian residents 16.0% FemalesUnemployment rate for other race residents 46.3% FemalesUnemployment rate for two or more race residents 1.0% FemalesUnemployment rate for Hispanic or Latino residents 15.8% Females
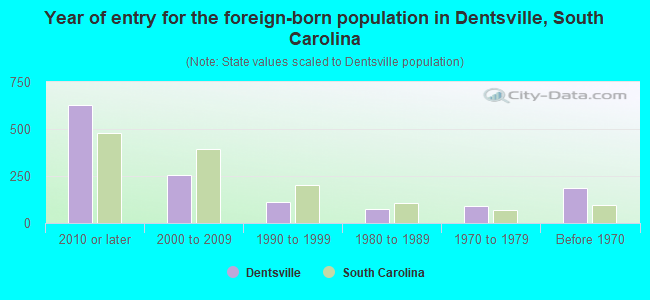
Year of entry for the foreign-born population in Dentsville, South Carolina
630 2010 or later 255 2000 to 2009 114 1990 to 1999 75 1980 to 1989 90 1970 to 1979 186 Before 1970
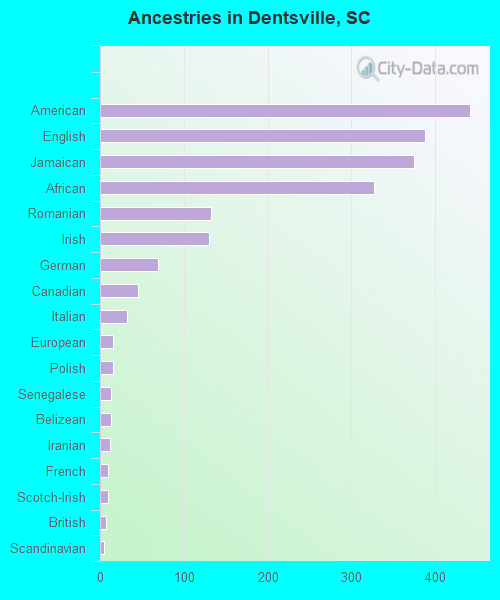
First ancestries reported:
American: 442 (4.5%)
English: 388 (4.0%)
Jamaican: 375 (3.8%)
African: 327 (3.3%)
Romanian: 133 (1.4%)
Irish: 130 (1.3%)
German: 69 (0.7%)
Canadian: 45 (0.5%)
Italian: 32 (0.3%)
European: 16 (0.2%)
Polish: 15 (0.2%)
Senegalese: 13 (0.1%)
Belizean: 13 (0.1%)
Iranian: 12 (0.1%)
French: 10 (0.1%)
Scotch-Irish: 9 (0.09%)
British: 7 (0.07%)
Scandinavian: 5 (0.05%) Most common places of birth for foreign-born residents (%): Jamaica Dentsville:
21.3% (234)South Carolina:
2.6% (7,073)
India Dentsville:
19.5% (215)South Carolina:
6.8% (18,307)
Romania Dentsville:
11.6% (128)South Carolina:
0.6% (1,507)
Pakistan Dentsville:
8.1% (89)South Carolina:
0.4% (1,109)
Bangladesh Dentsville:
6.5% (71)South Carolina:
0.2% (628)
Philippines Dentsville:
6.3% (69)South Carolina:
4.1% (11,031)
Dominican Republic Dentsville:
5.7% (63)South Carolina:
0.9% (2,357)
Germany Dentsville:
4.8% (53)South Carolina:
3.7% (9,982)
Honduras Dentsville:
3.1% (34)South Carolina:
4.8% (12,834)
Mexico Dentsville:
3.1% (34)South Carolina:
22.5% (60,774)
United Kingdom, excluding England and Scotland Dentsville:
2.9% (32)South Carolina:
1.2% (3,296)
China, excluding Hong Kong and Taiwan Dentsville:
2.9% (32)South Carolina:
3.2% (8,721)
Nigeria Dentsville:
2.3% (25)South Carolina:
0.6% (1,652)
Other Western Africa Dentsville:
1.7% (19)South Carolina:
0.1% (298)
Senegal Dentsville:
1.5% (17)South Carolina:
0.1% (228)
Place of birth for U.S.-born residents:
This state: 12,436Other state: 3,248Northeast: 1,065Midwest: 591South: 1,469West: 143 82.3% of Dentsville residents lived in the same house 1 years ago.
Out of people who lived in different houses, 38.0% lived in this county.
Out of people who lived in different counties, 76.9% lived in South Carolina.
Dentsville:
82.3%State average:
86.5%
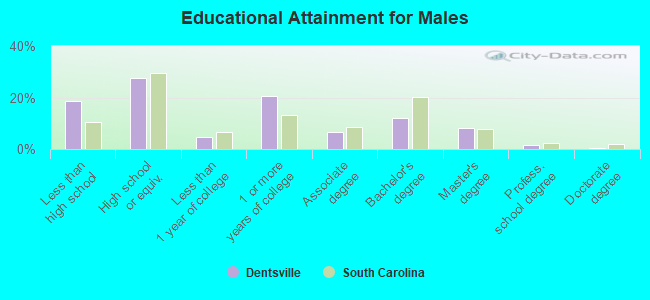
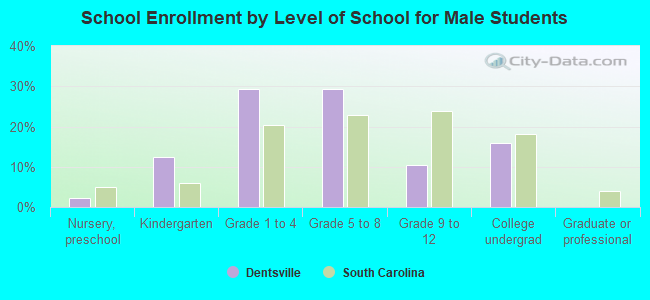
Education attainment for males 25 years and older:
No schooling: 38Nursery to 4th grade: 05th and 6th grade: 167th and 8th grade: 139th grade: 910th grade: 4311th grade: 19612th grade, no diploma: 586High school graduate (or equivalency): 1,315Less than 1 year of college: 226Some college more than 1 year, no degree: 986Associate degree: 321Bachelor's degree: 579Master's degree: 384Professional school degree: 69Doctorate degree: 12
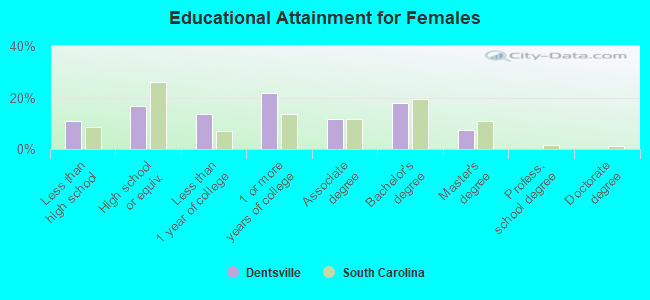
Education attainment for females 25 years and older:
No schooling: 71Nursery to 4th grade: 05th and 6th grade: 97th and 8th grade: 109th grade: 710th grade: 12711th grade: 36212th grade, no diploma: 139High school graduate (or equivalency): 1,109Less than 1 year of college: 884Some college more than 1 year, no degree: 1,431Associate degree: 766Bachelor's degree: 1,184Master's degree: 476Professional school degree: 12Doctorate degree: 0
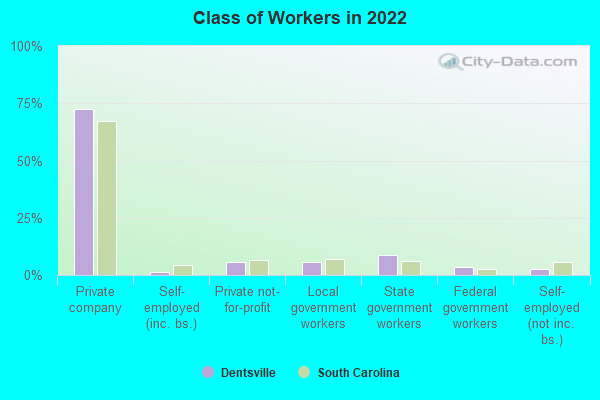
Housing units in structures:
One, detached: 3,351One, attached: 126Two: 3103 or 4: 5345 to 9: 1,56910 to 19: 1,19020 to 49: 39850 or more: 327Mobile homes: 243Housing units lacking complete plumbing facilities in 2022: 1.9%Housing units lacking complete kitchen facilities in 2022: 1.3%House/condo owner moved in on average 13 years ago
Renter moved in on average 3 years ago
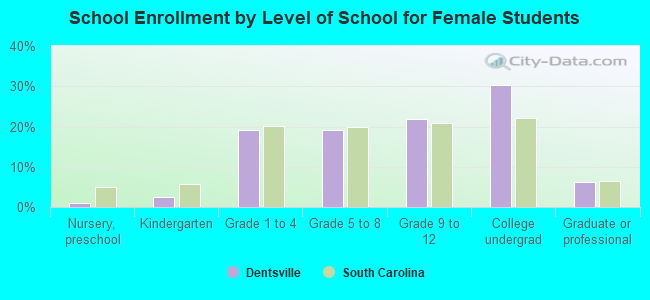
Private vs. public school enrollment:
Students in private schools in grades 1 to 8 (elementary and middle school): 167 Here:
9.4%South Carolina:
14.4%
Students in private schools in grades 9 to 12 (high school): 39 Here:
5.2%South Carolina:
11.1%
Students in private undergraduate colleges: 461 Here:
40.8%South Carolina:
21.9%