Housing density: 2,355 houses/condos per square mile
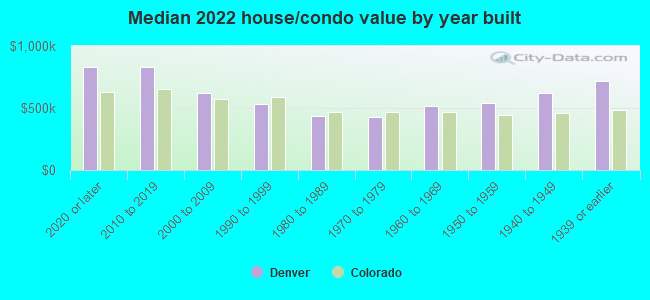
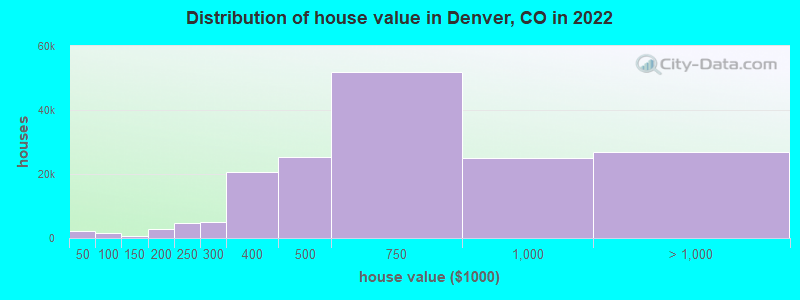
Median price asked for vacant for-sale houses and condos in 2022: $999,123.
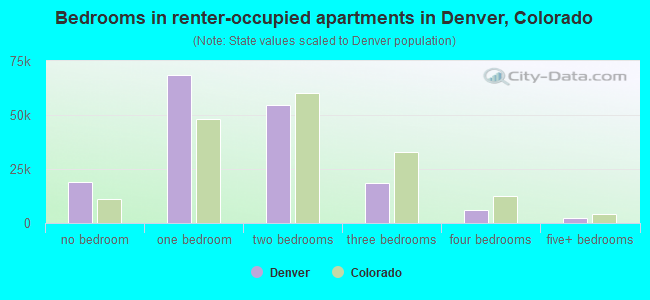
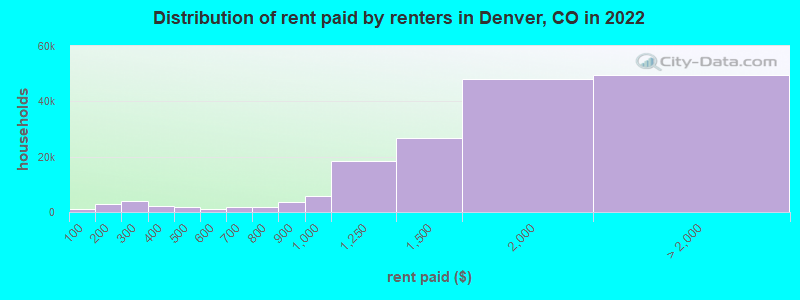
Median contract rent in 2022: $1,623 (lower quartile is $1,212, upper quartile is over $2,000)
Median rent asked for vacant for-rent units in 2022: $2,628
Median gross rent in Denver, CO in 2022: $1,711
Housing units in Denver with a mortgage: 125,626 (12,562 second mortgage, 66 home equity loan, 10,804 both second mortgage and home equity loan) Houses without a mortgage: 1,831
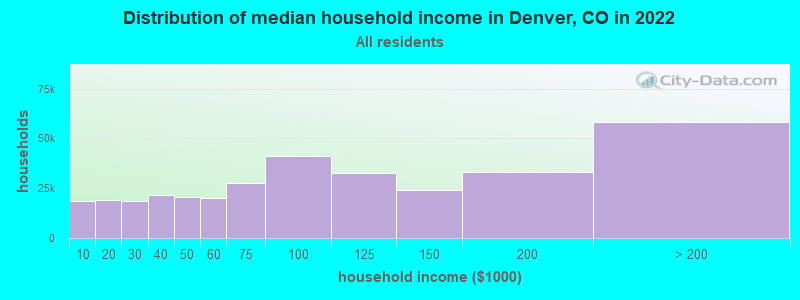
Median household income for houses/condos with a mortgage: $126,327
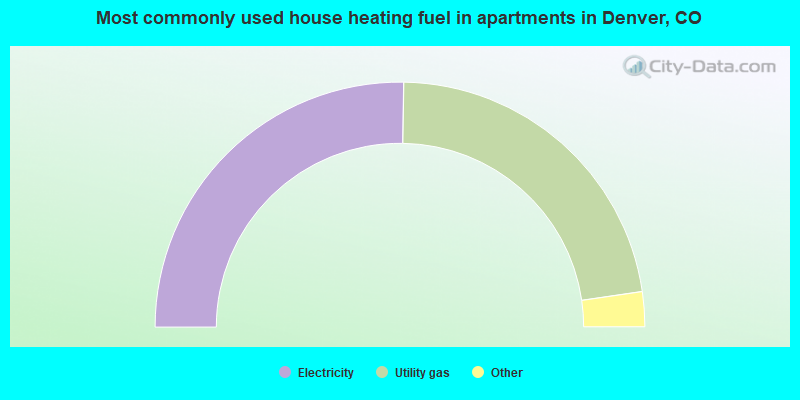
Median household income for apartments without a mortgage: $84,650
79,138 married couples with children.
35,624 single-parent households (10,385 men, 25,239 women).
75.3% of residents of Denver speak English at home.
16.4% of residents speak Spanish at home (66% speak English very well, 18% speak English well, 12% speak English not well, 5% don't speak English at all).
3.3% of residents speak other Indo-European language at home (76% speak English very well, 17% speak English well, 6% speak English not well, 1% don't speak English at all).
2.5% of residents speak Asian or Pacific Island language at home (51% speak English very well, 21% speak English well, 25% speak English not well, 3% don't speak English at all).
2.6% of residents speak other language at home (66% speak English very well, 25% speak English well, 9% speak English not well).
Foreign born population: 98,567 (13.8%)
(43.6% of them are naturalized citizens)
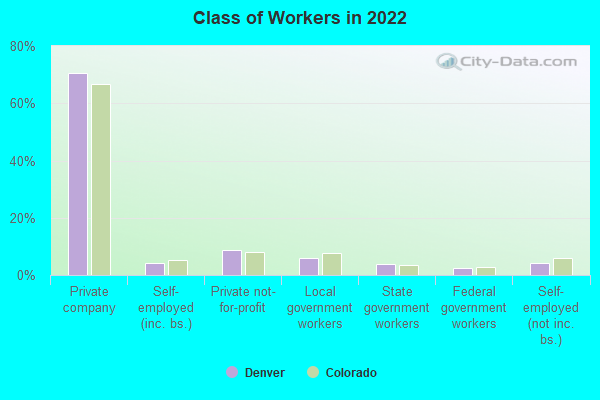
Percentage of workers working in this county: 69.8% Number of people working at home: 115,001 (27.2% of all workers)
Travel time to work (commute)
Less than 5 minutes: 5,150
5 to 9 minutes: 23,591
10 to 14 minutes: 38,221
15 to 19 minutes: 50,107
20 to 24 minutes: 52,720
25 to 29 minutes: 26,863
30 to 34 minutes: 52,989
35 to 39 minutes: 12,845
40 to 44 minutes: 11,449
45 to 59 minutes: 18,325
60 to 89 minutes: 11,934
90 or more minutes: 4,314
Means of transportation to work:
Drove a car alone: 349,650 (62.6%)
Carpooled: 40,203 (7.2%)
Bus: 12,730 (2.3%)
Subway or elevated rail: 1,296 (0.2%)
Long-distance train or commuter rail: 1,149 (0.2%)
Light rail, streetcar or trolley: 10,268 (1.8%)
Ferryboat: 79 (0.0%)
Taxi: 7,425 (1.3%)
Bicycle: 5,682 (1.0%)
Walked: 15,225 (2.7%)
Worked at home: 115,001 (20.6%)
Unemployment by race in 2022
Unemployment rate for White non-Hispanic residents
2.9%Males
2.3%Females
Unemployment rate for Black residents
5.7%Males
7.4%Females
Unemployment rate for American Indian and Alaska Native residents
15.8%Males
6.4%Females
Unemployment rate for Asian residents
4.4%Males
3.8%Females
Unemployment rate for other race residents
5.9%Males
7.2%Females
Unemployment rate for two or more race residents
4.3%Males
2.9%Females
Unemployment rate for Hispanic or Latino residents
5.1%Males
5.5%Females
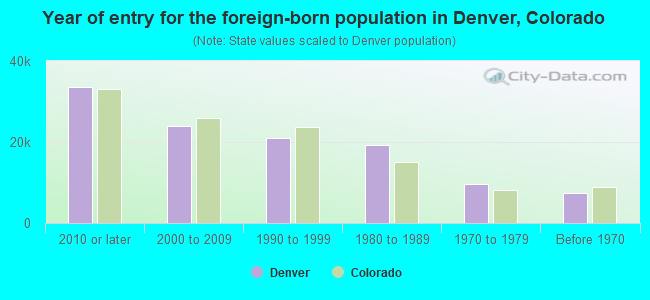
Year of entry for the foreign-born population in Denver, Colorado
33,6372010 or later
23,9602000 to 2009
21,0361990 to 1999
19,2221980 to 1989
9,7041970 to 1979
7,359Before 1970
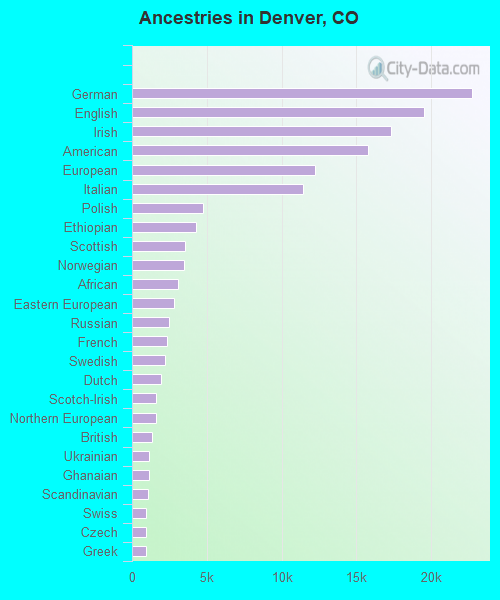
First ancestries reported:
German: 22,730 (6.3%)
English: 19,539 (5.4%)
Irish: 17,337 (4.8%)
American: 15,779 (4.4%)
European: 12,208 (3.4%)
Italian: 11,446 (3.2%)
Polish: 4,779 (1.3%)
Ethiopian: 4,281 (1.2%)
Scottish: 3,568 (1.0%)
Norwegian: 3,452 (1.0%)
African: 3,055 (0.8%)
Eastern European: 2,822 (0.8%)
Russian: 2,468 (0.7%)
French: 2,309 (0.6%)
Swedish: 2,223 (0.6%)
Dutch: 1,918 (0.5%)
Scotch-Irish: 1,604 (0.4%)
Northern European: 1,582 (0.4%)
British: 1,309 (0.4%)
Ukrainian: 1,167 (0.3%)
Ghanaian: 1,134 (0.3%)
Scandinavian: 1,074 (0.3%)
Swiss: 934 (0.3%)
Czech: 928 (0.3%)
Greek: 911 (0.3%)
French Canadian: 903 (0.2%)
Iraqi: 889 (0.2%)
Hungarian: 886 (0.2%)
Iranian: 835 (0.2%)
Welsh: 708 (0.2%)
Danish: 673 (0.2%)
Yugoslavian: 597 (0.2%)
Sudanese: 592 (0.2%)
Nigerian: 583 (0.2%)
Brazilian: 482 (0.1%)
Romanian: 466 (0.1%)
Canadian: 447 (0.1%)
Armenian: 436 (0.1%)
Jamaican: 422 (0.1%)
Lebanese: 413 (0.1%)
Senegalese: 410 (0.1%)
Croatian: 405 (0.1%)
Slavic: 399 (0.1%)
Lithuanian: 359 (0.10%)
Slovak: 306 (0.08%)
Somali: 300 (0.08%)
Bulgarian: 290 (0.08%)
Turkish: 286 (0.08%)
Moroccan: 257 (0.07%)
Haitian: 250 (0.07%)
Austrian: 242 (0.07%)
Portuguese: 231 (0.06%)
Egyptian: 227 (0.06%)
Belgian: 213 (0.06%)
Slovene: 212 (0.06%)
Latvian: 181 (0.05%)
Ugandan: 180 (0.05%)
Israeli: 177 (0.05%)
British West Indian: 160 (0.04%)
Basque: 147 (0.04%)
Serbian: 146 (0.04%)
Arab: 139 (0.04%)
Palestinian: 132 (0.04%)
Liberian: 120 (0.03%)
Australian: 114 (0.03%)
West Indian: 109 (0.03%)
Syrian: 107 (0.03%)
Guyanese: 105 (0.03%)
Finnish: 104 (0.03%)
Trinidadian and Tobagonian: 78 (0.02%)
Assyrian: 71 (0.02%)
Cape Verdean: 70 (0.02%)
Afghan: 69 (0.02%)
German Russian: 63 (0.02%)
U.S. Virgin Islander: 55 (0.02%)
Czechoslovakian: 49 (0.01%)
South African: 49 (0.01%)
Barbadian: 43 (0.01%)
Jordanian: 32 (0.01%)
Cajun: 31 (0.01%)
Icelander: 30 (0.01%)
Pennsylvania German: 24 (0.01%)
New Zealander: 22 (0.01%)
Soviet Union: 20 (0.01%)
Most common places of birth for foreign-born residents (%):
Mexico
Denver:
43.2% (43,534)
Colorado:
38.3% (209,491)
Ethiopia
Denver:
4.0% (4,080)
Colorado:
1.9% (10,372)
Vietnam
Denver:
3.3% (3,347)
Colorado:
3.0% (16,616)
China, excluding Hong Kong and Taiwan
Denver:
2.4% (2,400)
Colorado:
3.3% (17,998)
Colombia
Denver:
2.3% (2,337)
Colorado:
1.1% (5,971)
Canada
Denver:
2.3% (2,298)
Colorado:
2.7% (15,026)
Venezuela
Denver:
2.3% (2,294)
Colorado:
0.9% (4,829)
El Salvador
Denver:
2.1% (2,077)
Colorado:
2.2% (12,150)
India
Denver:
1.6% (1,593)
Colorado:
4.0% (21,689)
Place of birth for U.S.-born residents:
This state: 274,367
Other state: 328,489
Northeast: 60,852
Midwest: 110,432
South: 81,522
West: 75,683
79.0% of Denver residents lived in the same house 1 years ago. Out of people who lived in different houses, 31.1% lived in this county. Out of people who lived in different counties, 54.9% lived in Colorado.
Denver:
79.0%
State average:
83.6%
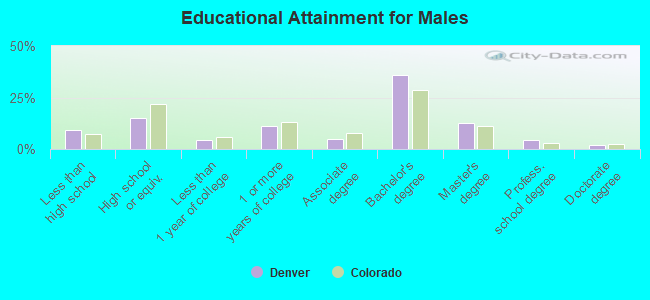
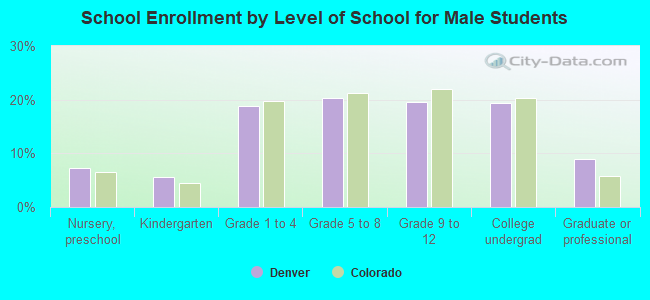
Education attainment for males 25 years and older:
No schooling: 4,242
Nursery to 4th grade: 1,041
5th and 6th grade: 2,697
7th and 8th grade: 1,629
9th grade: 2,798
10th grade: 3,020
11th grade: 3,977
12th grade, no diploma: 5,117
High school graduate (or equivalency): 40,599
Less than 1 year of college: 11,139
Some college more than 1 year, no degree: 30,175
Associate degree: 12,685
Bachelor's degree: 95,760
Master's degree: 34,361
Professional school degree: 12,223
Doctorate degree: 5,700
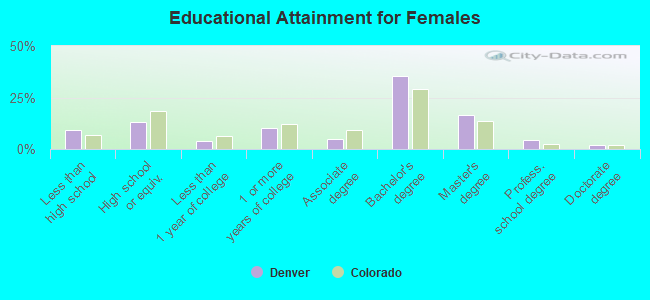
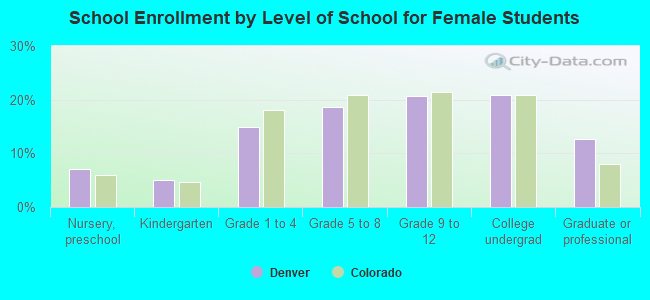
Education attainment for females 25 years and older:
No schooling: 4,152
Nursery to 4th grade: 1,053
5th and 6th grade: 1,936
7th and 8th grade: 3,697
9th grade: 3,246
10th grade: 2,095
11th grade: 3,350
12th grade, no diploma: 4,018
High school graduate (or equivalency): 33,822
Less than 1 year of college: 10,160
Some college more than 1 year, no degree: 26,902
Associate degree: 12,251
Bachelor's degree: 91,866
Master's degree: 43,039
Professional school degree: 11,805
Doctorate degree: 5,215
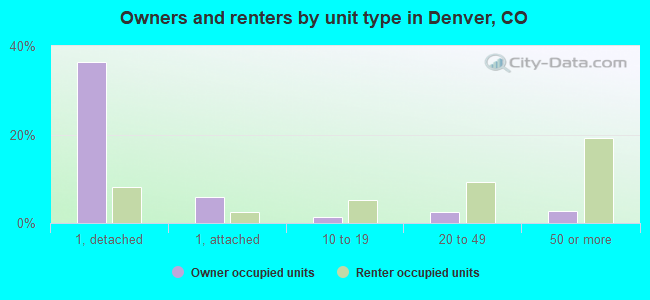
Housing units in structures:
One, detached: 146,959
One, attached: 35,282
Two: 6,173
3 or 4: 11,171
5 to 9: 16,364
10 to 19: 28,178
20 to 49: 32,659
50 or more: 84,079
Mobile homes: 219
Boats, RVs, vans, etc.: 128
Housing units lacking complete plumbing facilities in 2022: 0.6%
Housing units lacking complete kitchen facilities in 2022: 1.1%