Des Moines, IA (Iowa) Houses and Residents
Estimated median house or condo value in 2022: $178,600 (it was $79,900 in 2000 )
Des Moines:
$178,600Iowa:
$194,600
Lower value quartile - upper value quartile: $127,900 - $257,100Mean price in 2022: Detached houses: $201,532 Here:
$201,532State:
$245,224
Townhouses or other attached units: $241,703 Here:
$241,703State:
$238,767
In 2-unit structures: $52,554 Here:
$52,554State:
$243,070
In 3-to-4-unit structures: $216,141 Here:
$216,141State:
$162,139
In 5-or-more-unit structures: $230,080 Here:
$230,080State:
$190,519
Mobile homes: $46,079 Here:
$46,079State:
$51,271
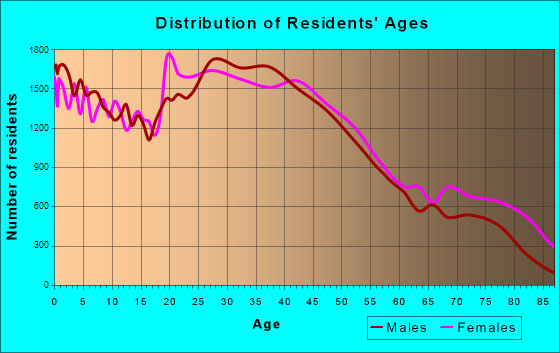
Total population: 209,220 (Urban population: 197,533, Rural population: 1,155 (26 farm, 1,129 nonfarm ))
Houses: 100,258 (93,091 occupied: 56,299 owner occupied, 36,792 renter occupied )
% of renters here:
40%State:
28%
Housing density: 1,323 houses/condos per square mile
Median price asked for vacant for-sale houses and condos in 2022: $174,987.
Median contract rent in 2022: $873 (lower quartile is $725, upper quartile is $1,112)
Median rent asked for vacant for-rent units in 2022: $793
Median gross rent in Des Moines, IA in 2022: $982
Housing units in Des Moines with a mortgage: 39,217 (4,797 second mortgage, 215 home equity loan, 3,602 both second mortgage and home equity loan )Houses without a mortgage: 1,254
Median household income for houses/condos with a mortgage: $85,559
Median household income for apartments without a mortgage: $58,958
Median monthly housing costs: $1,072
Data:
Median house or condo value ($)
Median house or condo value ($ change since 2000)
Median house or condo value ($) - White
Median house or condo value ($) - Black or African American
Median house or condo value ($) - Asian
Median house or condo value ($) - Hispanic or Latino
Median house or condo value ($) - American Indian and Alaska Native
Median house or condo value ($) - Multirace
Median house or condo value ($) - Other Race
Median price asked for mobile homes ($)
Household density (households per square mile)
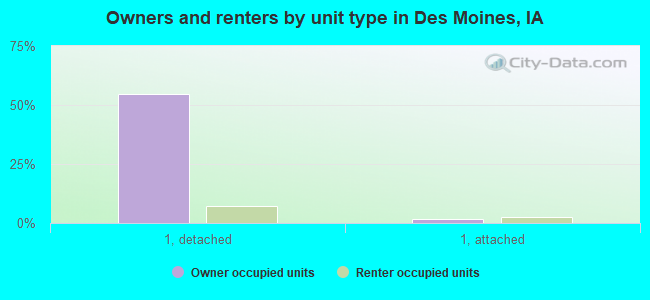
Mean house or condo value by units in structure - 1, detached ($)
Mean house or condo value by units in structure - 1, attached ($)
Mean house or condo value by units in structure - 2 ($)
Mean house or condo value by units in structure by units in structure - 3 or 4 ($)
Mean house or condo value by units in structure - 5 or more ($)
Mean house or condo value by units in structure - Boat, RV, van, etc. ($)
Mean house or condo value by units in structure - Mobile home ($)
Median contract rent ($)
Median contract rent - Lower quartile ($)
Median contract rent - Upper quartile ($)
Median gross rent ($)
Urban houses (%)
Rural houses (%)
Houses occupied (%)
Houses occupied (% change since 2000)
Houses owner occupied (%)
Houses owner occupied (% change since 2000)
Houses renter occupied (%)
Houses renter occupied (% change since 2000)
Vacant housing units - For rent (%)
Vacant housing units - For rent (% change since 2000)
Vacant housing units - For sale only (%)
Vacant housing units - For sale only (% change since 2000)
Vacant housing units - Rented or sold, not occupied (%)
Vacant housing units - Rented or sold, not occupied (% change since 2000)
Vacant housing units - For seasonal, recreational, or occasional use (%)
Vacant housing units - For seasonal, recreational, or occasional use (% change since 2000)
Vacant housing units - For migrant workers (%)
Vacant housing units - For migrant workers (% change since 2000)
Vacant housing units - Other vacant (%)
Vacant housing units - Other vacant (% change since 2000)
Median monthly housing costs ($)
Median household income for houses/condos with a mortgage ($)
Median household income for houses/condos without a mortgage ($)
Median household income ($)
Median household income ($) - White
Median household income ($) - Black or African American
Median household income ($) - Asian
Median household income ($) - Hispanic or Latino
Median household income ($) - American Indian and Alaska Native
Median household income ($) - Multirace
Median household income ($) - Other Race
Mortgage status - with mortgage (%)
Mortgage status - with second mortgage (%)
Mortgage status - with home equity loan (%)
Mortgage status - with both second mortgage and home equity loan (%)
Mortgage status - without a mortgage (%)
Median year house/condo built
Median year apartment built
Household type by relationship - Male householder living alone (%)
Household type by relationship - Male householder not living alone (%)
Household type by relationship - Female householder living alone (%)
Household type by relationship - Female householder not living alone (%)
Household type by relationship - Opposite-Sex spouse (%)
Household type by relationship - Same-Sex spouse (%)
Household type by relationship - Opposite-Sex unmarried partner (%)
Household type by relationship - Same-Sex unmarried partner (%)
Household type by relationship - In group quarters (%)
Size of family households - 2-person household (%)
Size of family households - 3-person household (%)
Size of family households - 4-person household (%)
Size of family households - 5-person household (%)
Size of family households - 6-person household (%)
Size of family households - 7-or-more-person household (%)
Size of nonfamily households - 1-person household (%)
Size of nonfamily households - 2-person household (%)
Size of nonfamily households - 3-person household (%)
Size of nonfamily households - 4-person household (%)
Size of nonfamily households - 5-person household (%)
Size of nonfamily households - 6-person household (%)
Size of nonfamily households - 7-or-moreperson household (%)
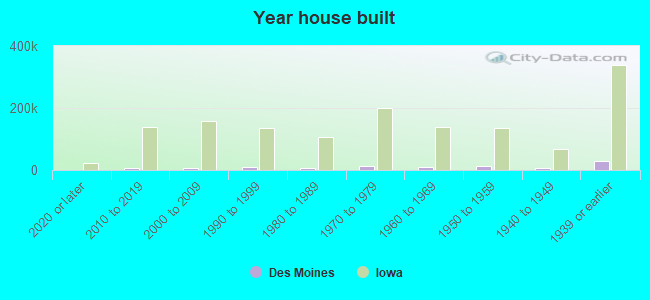
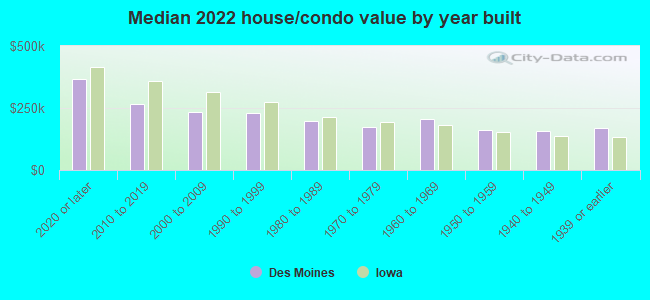
Year house built - Built 2010 or later (%)
Year house built - Built 2000 to 2009 (%)
Year house built - Built 1990 to 1999 (%)
Year house built - Built 1980 to 1989 (%)
Year house built - Built 1970 to 1979 (%)
Year house built - Built 1960 to 1969 (%)
Year house built - Built 1950 to 1959 (%)
Year house built - Built 1940 to 1949 (%)
Year house built - Built 1939 or earlier (%)
Median number of rooms in houses and condos
Median number of rooms in apartments
Median number of bedrooms in owner occupied houses
Mean number of bedrooms in owner occupied houses
Median number of bedrooms in renter occupied houses
Mean number of bedrooms in renter occupied houses
Median number of vehichles in owner occupied houses
Mean number of vehichles in owner occupied houses
Median number of vehichles in renter occupied houses
Mean number of vehichles in renter occupied houses
Rooms in owner-occupied houses - 1 room (%)
Rooms in owner-occupied houses - 2 rooms (%)
Rooms in owner-occupied houses - 3 rooms (%)
Rooms in owner-occupied houses - 4 rooms (%)
Rooms in owner-occupied houses - 5 rooms (%)
Rooms in owner-occupied houses - 6 rooms (%)
Rooms in owner-occupied houses - 7 rooms (%)
Rooms in owner-occupied houses - 8 rooms (%)
Rooms in owner-occupied houses - 9+ rooms (%)
Rooms in renter-occupied houses - 1 room (%)
Rooms in renter-occupied houses - 2 rooms (%)
Rooms in renter-occupied houses - 3 rooms (%)
Rooms in renter-occupied houses - 4 rooms (%)
Rooms in renter-occupied houses - 5 rooms (%)
Rooms in renter-occupied houses - 6 rooms (%)
Rooms in renter-occupied houses - 7 rooms (%)
Rooms in renter-occupied houses - 8 rooms (%)
Rooms in renter-occupied houses - 9+ rooms (%)
Bedrooms in owner-occupied houses - no bedrooms (%)
Bedrooms in owner-occupied houses - 1 bedroom (%)
Bedrooms in owner-occupied houses - 2 bedrooms (%)
Bedrooms in owner-occupied houses - 3 bedrooms (%)
Bedrooms in owner-occupied houses - 4 bedrooms (%)
Bedrooms in owner-occupied houses - 5+ bedrooms (%)
Bedrooms in renter-occupied houses - no bedrooms (%)
Bedrooms in renter-occupied houses - 1 bedroom (%)
Bedrooms in renter-occupied houses - 2 bedrooms (%)
Bedrooms in renter-occupied houses - 3 bedrooms (%)
Bedrooms in renter-occupied houses - 4 bedrooms (%)
Bedrooms in renter-occupied houses - 5+ bedrooms (%)
Vehicles available in owner-occupied houses - no vehicle available (%)
Vehicles available in owner-occupied houses - 1 vehicle available(%)
Vehicles available in owner-occupied houses - 2 Vehicles available (%)
Vehicles available in owner-occupied houses - 3 Vehicles available (%)
Vehicles available in owner-occupied houses - 4 Vehicles available (%)
Vehicles available in owner-occupied houses - 5+ Vehicles available (%)
Vehicles available in renter-occupied houses - no vehicle available (%)
Vehicles available in renter-occupied houses - 1 vehicle available (%)
Vehicles available in renter-occupied houses - 2 Vehicles available (%)
Vehicles available in renter-occupied houses - 3 Vehicles available (%)
Vehicles available in renter-occupied houses - 4 Vehicles available (%)
Vehicles available in renter-occupied houses - 5+ Vehicles available (%)
Housing units in structures - 1, detached (%)
Housing units in structures - 1, attached (%)
Housing units in structures - 2 (%)
Housing units in structures - 3 or 4 (%)
Housing units in structures - 5 to 9 (%)
Housing units in structures - 10 to 19 (%)
Housing units in structures - 20 to 49 (%)
Housing units in structures - 50 or more (%)
Housing units in structures - Mobile home (%)
Housing units in structures - Boat, RV, van, etc. (%)
Housing units in structures - Owners - 1, detached (%)
Housing units in structures - Owners - 1, attached (%)
Housing units in structures - Owners - 2 (%)
Housing units in structures - Owners - 3 or 4 (%)
Housing units in structures - Owners - 5 to 9 (%)
Housing units in structures - Owners - 10 to 19 (%)
Housing units in structures - Owners - 20 to 49 (%)
Housing units in structures - Owners - 50 or more (%)
Housing units in structures - Owners - Mobile home (%)
Housing units in structures - Owners - Boat, RV, van, etc. (%)
Housing units in structures - Renters - 1, detached (%)
Housing units in structures - Renters - 1, attached (%)
Housing units in structures - Renters - 2 (%)
Housing units in structures - Renters - 3 or 4 (%)
Housing units in structures - Renters - 5 to 9 (%)
Housing units in structures - Renters - 10 to 19 (%)
Housing units in structures - Renters - 20 to 49 (%)
Housing units in structures - Renters - 50 or more (%)
Housing units in structures - Renters - Mobile home (%)
Housing units in structures - Renters - Boat, RV, van, etc. (%)
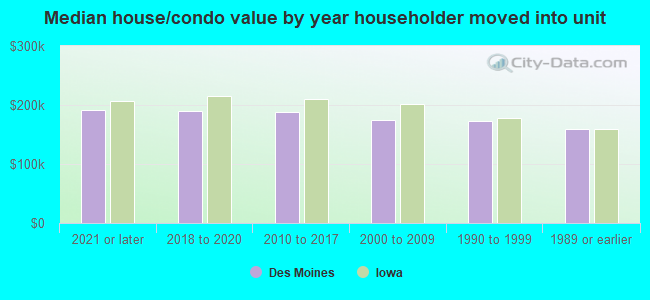
House/condo owner moved in on average (years ago)
Renter moved in on average (years ago)
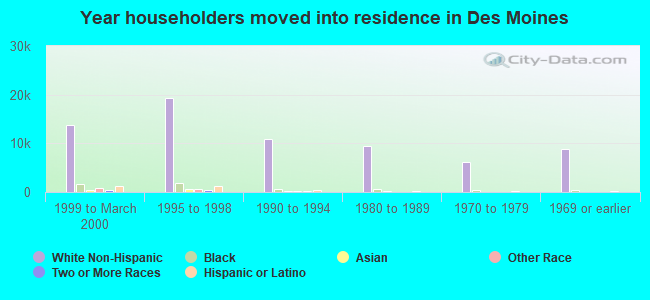
Year householder moved into unit - Moved in 1999 to March 2000 (%)
Year householder moved into unit - Moved in 1999 to March 2000 (%) - White
Year householder moved into unit - Moved in 1999 to March 2000 (%) - Black or African American
Year householder moved into unit - Moved in 1999 to March 2000 (%) - Asian
Year householder moved into unit - Moved in 1999 to March 2000 (%) - Hispanic or Latino
Year householder moved into unit - Moved in 1999 to March 2000 (%) - American Indian and Alaska Native
Year householder moved into unit - Moved in 1999 to March 2000 (%) - Multirace
Year householder moved into unit - Moved in 1999 to March 2000 (%) - Other Race
Year householder moved into unit - Moved in 1995 to 1998 (%)
Year householder moved into unit - Moved in 1995 to 1998 (%) - White
Year householder moved into unit - Moved in 1995 to 1998 (%) - Black or African American
Year householder moved into unit - Moved in 1995 to 1998 (%) - Asian
Year householder moved into unit - Moved in 1995 to 1998 (%) - Hispanic or Latino
Year householder moved into unit - Moved in 1995 to 1998 (%) - American Indian and Alaska Native
Year householder moved into unit - Moved in 1995 to 1998 (%) - Multirace
Year householder moved into unit - Moved in 1995 to 1998 (%) - Other Race
Year householder moved into unit - Moved in 1990 to 1994 (%)
Year householder moved into unit - Moved in 1990 to 1994 (%) - White
Year householder moved into unit - Moved in 1990 to 1994 (%) - Black or African American
Year householder moved into unit - Moved in 1990 to 1994 (%) - Asian
Year householder moved into unit - Moved in 1990 to 1994 (%) - Hispanic or Latino
Year householder moved into unit - Moved in 1990 to 1994 (%) - American Indian and Alaska Native
Year householder moved into unit - Moved in 1990 to 1994 (%) - Multirace
Year householder moved into unit - Moved in 1990 to 1994 (%) - Other Race
Year householder moved into unit - Moved in 1980 to 1989 (%)
Year householder moved into unit - Moved in 1980 to 1989 (%) - White
Year householder moved into unit - Moved in 1980 to 1989 (%) - Black or African American
Year householder moved into unit - Moved in 1980 to 1989 (%) - Asian
Year householder moved into unit - Moved in 1980 to 1989 (%) - Hispanic or Latino
Year householder moved into unit - Moved in 1980 to 1989 (%) - American Indian and Alaska Native
Year householder moved into unit - Moved in 1980 to 1989 (%) - Multirace
Year householder moved into unit - Moved in 1980 to 1989 (%) - Other Race
Year householder moved into unit - Moved in 1970 to 1979 (%)
Year householder moved into unit - Moved in 1970 to 1979 (%) - White
Year householder moved into unit - Moved in 1970 to 1979 (%) - Black or African American
Year householder moved into unit - Moved in 1970 to 1979 (%) - Asian
Year householder moved into unit - Moved in 1970 to 1979 (%) - Hispanic or Latino
Year householder moved into unit - Moved in 1970 to 1979 (%) - American Indian and Alaska Native
Year householder moved into unit - Moved in 1970 to 1979 (%) - Multirace
Year householder moved into unit - Moved in 1970 to 1979 (%) - Other Race
Year householder moved into unit - Moved in 1969 or earlier (%)
Year householder moved into unit - Moved in 1969 or earlier (%) - White
Year householder moved into unit - Moved in 1969 or earlier (%) - Black or African American
Year householder moved into unit - Moved in 1969 or earlier (%) - Asian
Year householder moved into unit - Moved in 1969 or earlier (%) - Hispanic or Latino
Year householder moved into unit - Moved in 1969 or earlier (%) - American Indian and Alaska Native
Year householder moved into unit - Moved in 1969 or earlier (%) - Multirace
Year householder moved into unit - Moved in 1969 or earlier (%) - Other Race
Housing units lacking complete plumbing facilities (%)
Housing units lacking complete kitchen facilities (%)
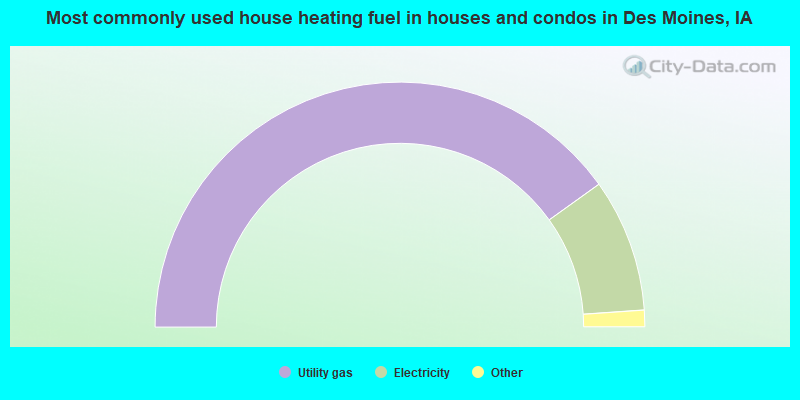
House heating fuel used in houses and condos - Utility gas (%)
House heating fuel used in houses and condos - Bottled, tank, or LP gas (%)
House heating fuel used in houses and condos - Electricity (%)
House heating fuel used in houses and condos - Fuel oil, kerosene, etc. (%)
House heating fuel used in houses and condos - Coal or coke (%)
House heating fuel used in houses and condos - Wood (%)
House heating fuel used in houses and condos - Solar energy (%)
House heating fuel used in houses and condos - Other fuel (%)
House heating fuel used in houses and condos - No fuel used (%)
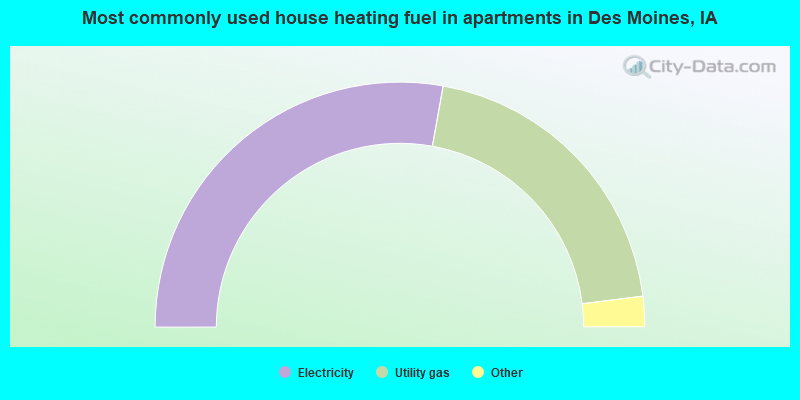
House heating fuel used in apartments - Utility gas (%)
House heating fuel used in apartments - Bottled, tank, or LP gas (%)
House heating fuel used in apartments - Electricity (%)
House heating fuel used in apartments - Fuel oil, kerosene, etc. (%)
House heating fuel used in apartments - Coal or coke (%)
House heating fuel used in apartments - Wood (%)
House heating fuel used in apartments - Solar energy (%)
House heating fuel used in apartments - Other fuel (%)
House heating fuel used in apartments - No fuel used (%)
Median year house/condo built: 1955Median year apartment built: 1973Household type by relationship:
Households: 210,936
Male householders: 45,325 (16,666 living alone ), Female householders: 47,766 (19,217 living alone )30,628 spouses (29,714 opposite-sex spouses ), 9,511 unmarried partners , (8,583 opposite-sex unmarried partners ), 54,249 children (50,886 natural , 1,281 adopted , 2,082 stepchildren ), 3,725 grandchildren , 2,182 brothers or sisters , 2,360 parents , 0 foster children , 4,378 other relatives , 6,062 non-relatives In group quarters: 4,750
Size of family households: 21,011 2-persons , 10,862 3-persons , 8,120 4-persons , 4,455 5-persons , 943 6-persons , 2,178 7-or-more-persons .
Size of nonfamily households: 35,883 1-person , 8,679 2-persons , 488 3-persons , 305 4-persons , 167 5-persons .
24,676 married couples with children. single-parent households (3,660 men , 13,157 women ).
78.9% of residents of Des Moines speak English at home. of residents speak Spanish at home (58% speak English very well , 18% speak English well , 15% speak English not well , 8% don't speak English at all ).of residents speak other Indo-European language at home (58% speak English very well , 23% speak English well , 16% speak English not well , 3% don't speak English at all ).of residents speak Asian or Pacific Island language at home (48% speak English very well , 16% speak English well , 28% speak English not well , 7% don't speak English at all ).of residents speak other language at home (44% speak English very well , 23% speak English well , 31% speak English not well , 2% don't speak English at all ).
Foreign born population: 34,192 (16.2%)of them are naturalized citizens )
Median number of rooms in houses and condos:
Median number of rooms in apartments
Owner-occupied Renter-occupied
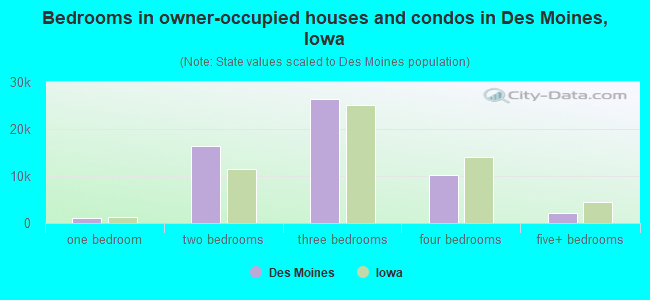
Bedrooms in owner-occupied houses and condos in Des Moines, Iowa
20 no bedroom 1,155 1 bedroom 16,435 2 bedrooms 26,314 3 bedrooms 10,189 4 bedrooms 2,186 5+ bedrooms
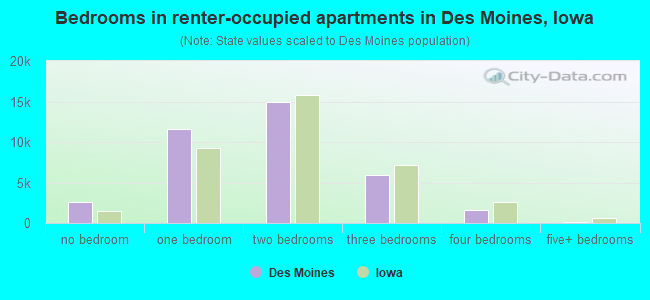
Bedrooms in renter-occupied apartments in Des Moines, Iowa
2,589 no bedroom 11,605 1 bedroom 14,913 2 bedrooms 5,898 3 bedrooms 1,644 4 bedrooms 143 5+ bedrooms
Owner-occupied Renter-occupied
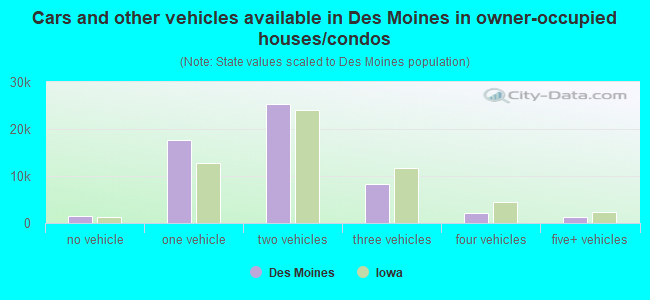
Cars and other vehicles available in Des Moines in owner-occupied houses/condos
1,558 no vehicle 17,682 1 vehicle 25,379 2 vehicles 8,299 3 vehicles 2,099 4 vehicles 1,282 5+ vehicles
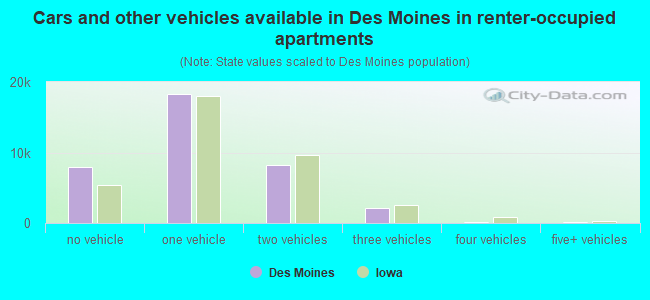
Cars and other vehicles available in Des Moines in renter-occupied apartments
7,887 no vehicle 18,309 1 vehicle 8,234 2 vehicles 2,086 3 vehicles 75 4 vehicles 201 5+ vehicles
Owner-occupied Renter-occupied
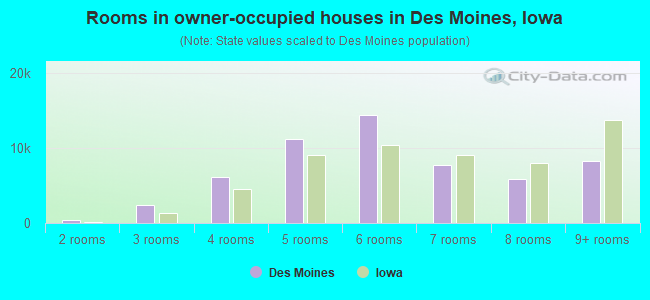
Rooms in owner-occupied houses in Des Moines, Iowa
20 1 room 354 2 rooms 2,374 3 rooms 6,112 4 rooms 11,163 5 rooms 14,380 6 rooms 7,731 7 rooms 5,869 8 rooms 8,296 9+ rooms
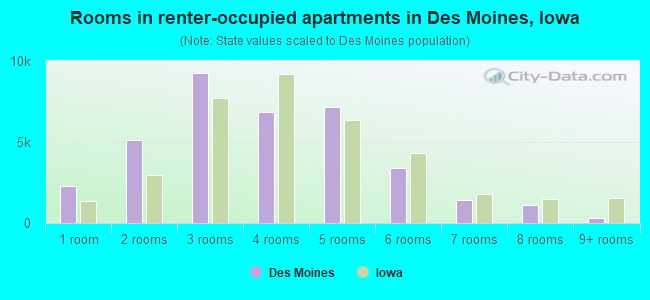
Rooms in renter-occupied apartments in Des Moines, Iowa
2,268 1 room 5,095 2 rooms 9,249 3 rooms 6,841 4 rooms 7,148 5 rooms 3,391 6 rooms 1,399 7 rooms 1,101 8 rooms 300 9+ rooms
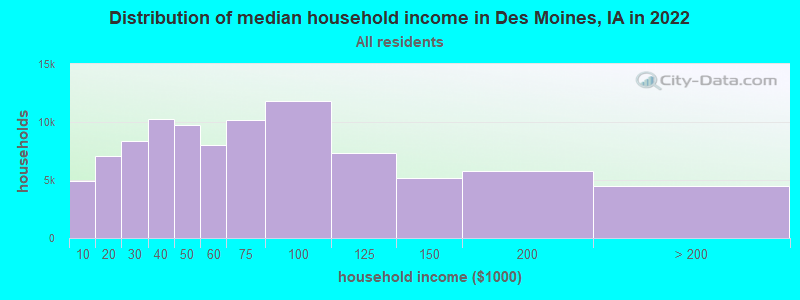
Des Moines, IA household income distribution 4,921 Less than $10,0007,092 $10,000 to $19,9998,360 $20,000 to $29,99910,251 $30,000 to $39,9999,710 $40,000 to $49,9997,992 $50,000 to $59,99910,141 $60,000 to $74,99911,786 $75,000 to $99,9997,318 $100,000 to $124,9995,193 $125,000 to $149,9995,808 $150,000 to $199,9994,519 $200,000 or more
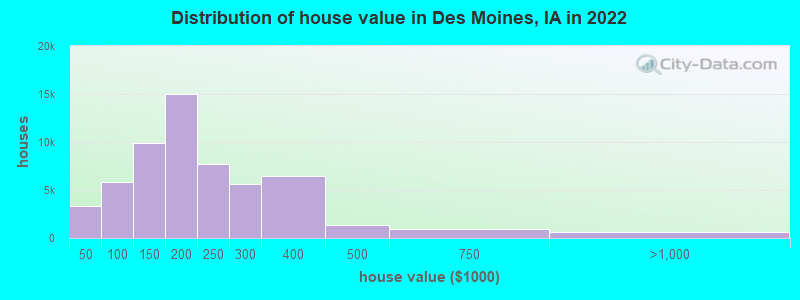
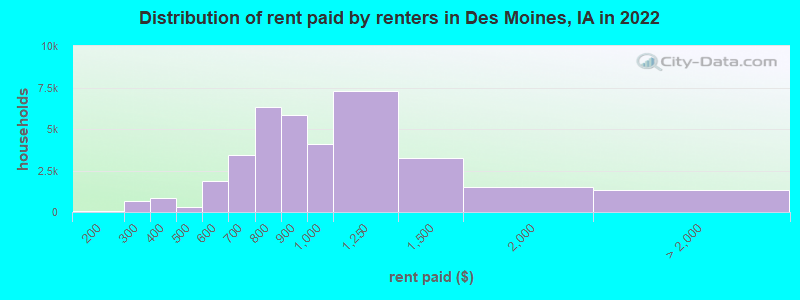
Home value of owner - occupied houses in 2022 in Des Moines, IA 527 Less than $10,000853 $10,000 to $14,999478 $15,000 to $19,999590 $20,000 to $24,999140 $25,000 to $29,999130 $30,000 to $34,999281 $35,000 to $39,999284 $40,000 to $49,999490 $50,000 to $59,999828 $60,000 to $69,999413 $70,000 to $79,9991,984 $80,000 to $89,9991,875 $90,000 to $99,9994,581 $100,000 to $124,9995,267 $125,000 to $149,9998,498 $150,000 to $174,9996,459 $175,000 to $199,9997,754 $200,000 to $249,9995,585 $250,000 to $299,9996,457 $300,000 to $399,9991,304 $400,000 to $499,999940 $500,000 to $749,999444 $750,000 to $999,99934 $1,000,000 to $1,499,999103 $2,000,000 or moreRent paid by renters in 2022 in Des Moines, IA 85 $150 to $199466 $200 to $249207 $250 to $299314 $300 to $349501 $350 to $399195 $400 to $449127 $450 to $499824 $500 to $5491,069 $550 to $5991,163 $600 to $6492,298 $650 to $6993,315 $700 to $7492,983 $750 to $7995,836 $800 to $8994,077 $900 to $9997,273 $1,000 to $1,2493,245 $1,250 to $1,4991,498 $1,500 to $1,99948 $2,000 to $2,499100 $3,500 or more1,168 No cash rent
Percentage of workers working in this county: 91.0%Number of people working at home: 15,006 (13.4% of all workers )
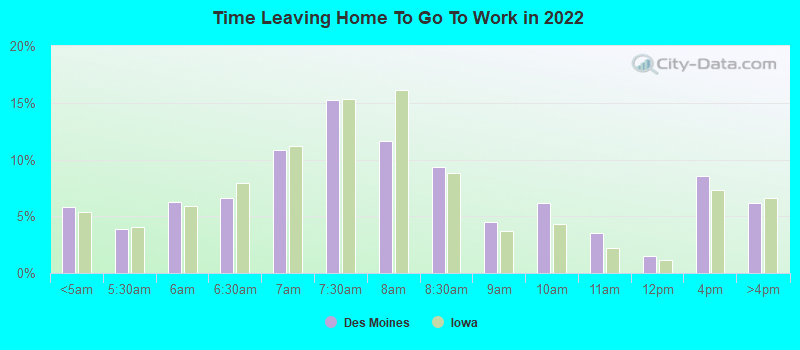
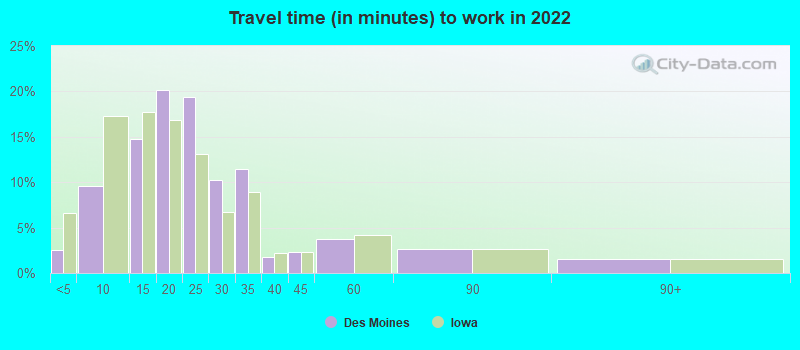
Travel time to work (commute)
Less than 5 minutes: 2,7935 to 9 minutes: 10,09510 to 14 minutes: 18,27415 to 19 minutes: 23,02620 to 24 minutes: 18,95825 to 29 minutes: 6,01030 to 34 minutes: 9,84435 to 39 minutes: 77240 to 44 minutes: 1,24645 to 59 minutes: 1,98060 to 89 minutes: 1,68990 or more minutes: 2,150
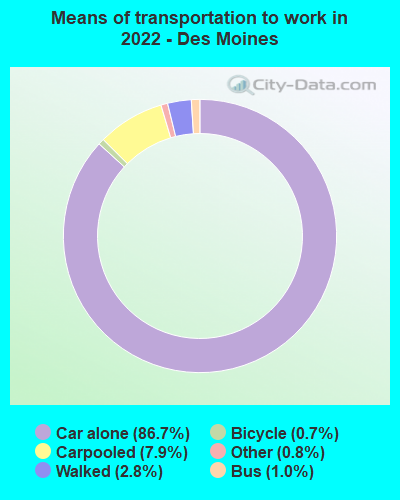
Means of transportation to work:
Drove a car alone: 98,422 (76.5%)Carpooled: 9,013 (7.0%)Bus : 1,184 (0.9%)Taxi: 956 (0.7%)Bicycle: 849 (0.7%)Walked: 3,143 (2.4%)Worked at home: 15,006 (11.7%)
Unemployment by race in 2022
Unemployment rate for White non-Hispanic residents 3.8% Males4.1% FemalesUnemployment rate for Black residents 11.6% Males9.2% FemalesUnemployment rate for American Indian and Alaska Native residents 5.1% Males2.0% FemalesUnemployment rate for Asian residents 2.9% Males7.7% FemalesUnemployment rate for other race residents 3.0% Males3.7% FemalesUnemployment rate for two or more race residents 6.3% Males1.6% FemalesUnemployment rate for Hispanic or Latino residents 2.8% Males3.3% Females
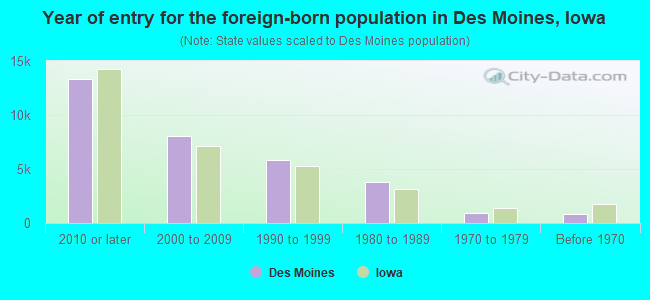
Year of entry for the foreign-born population in Des Moines, Iowa
13,352 2010 or later 8,047 2000 to 2009 5,813 1990 to 1999 3,829 1980 to 1989 953 1970 to 1979 860 Before 1970
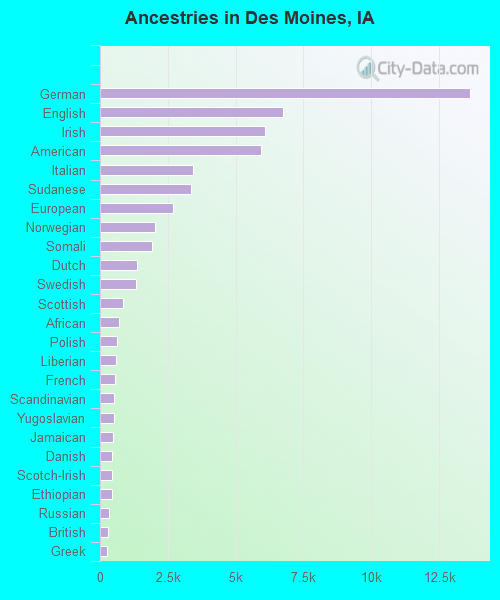
First ancestries reported:
German: 13,659 (12.7%)
English: 6,750 (6.3%)
Irish: 6,101 (5.7%)
American: 5,937 (5.5%)
Italian: 3,437 (3.2%)
Sudanese: 3,362 (3.1%)
European: 2,679 (2.5%)
Norwegian: 2,011 (1.9%)
Somali: 1,913 (1.8%)
Dutch: 1,351 (1.3%)
Swedish: 1,325 (1.2%)
Scottish: 835 (0.8%)
African: 718 (0.7%)
Polish: 633 (0.6%)
Liberian: 594 (0.6%)
French: 559 (0.5%)
Scandinavian: 515 (0.5%)
Yugoslavian: 510 (0.5%)
Jamaican: 486 (0.5%)
Danish: 444 (0.4%)
Scotch-Irish: 437 (0.4%)
Ethiopian: 427 (0.4%)
Russian: 341 (0.3%)
British: 288 (0.3%)
Greek: 264 (0.2%)
Czech: 251 (0.2%)
Haitian: 181 (0.2%)
Afghan: 181 (0.2%)
Croatian: 169 (0.2%)
Northern European: 164 (0.2%)
Nigerian: 164 (0.2%)
Eastern European: 161 (0.1%)
Austrian: 113 (0.1%)
Welsh: 110 (0.1%)
Canadian: 85 (0.08%)
Lebanese: 66 (0.06%)
Czechoslovakian: 58 (0.05%)
French Canadian: 51 (0.05%)
Maltese: 45 (0.04%)
Senegalese: 44 (0.04%)
Iraqi: 40 (0.04%)
Iranian: 40 (0.04%)
Pennsylvania German: 39 (0.04%)
Hungarian: 37 (0.03%)
Romanian: 34 (0.03%)
Slovak: 30 (0.03%)
Ukrainian: 29 (0.03%)
Latvian: 28 (0.03%)
Swiss: 25 (0.02%)
Australian: 25 (0.02%)
Brazilian: 22 (0.02%)
Finnish: 18 (0.02%)
Turkish: 18 (0.02%)
Celtic: 17 (0.02%)
Belgian: 17 (0.02%)
Egyptian: 16 (0.01%)
Moroccan: 16 (0.01%)
Trinidadian and Tobagonian: 15 (0.01%)
German Russian: 14 (0.01%)
Kenyan: 11 (0.01%)
Luxembourger: 9 (0.01%)
Arab: 8 (0.01%)
Slovene: 7 (0.01%)
New Zealander: 7 (0.01%)
Bulgarian: 7 (0.01%)
Most common places of birth for foreign-born residents (%): Mexico Des Moines:
23.6% (7,015)Iowa:
23.3% (41,625)
Vietnam Des Moines:
6.1% (1,821)Iowa:
4.2% (7,428)
El Salvador Des Moines:
5.7% (1,697)Iowa:
2.8% (4,967)
Thailand Des Moines:
5.6% (1,666)Iowa:
2.0% (3,595)
Burma (Myanmar) Des Moines:
5.2% (1,534)Iowa:
2.5% (4,514)
Other Eastern Africa Des Moines:
4.8% (1,433)Iowa:
1.4% (2,422)
Laos Des Moines:
4.4% (1,311)Iowa:
2.1% (3,682)
Sudan Des Moines:
4.0% (1,179)Iowa:
2.3% (4,084)
Bhutan Des Moines:
3.0% (902)Iowa:
0.8% (1,488)
Congo Des Moines:
2.5% (743)Iowa:
0.8% (1,507)
Guatemala Des Moines:
2.4% (704)Iowa:
3.2% (5,672)
India Des Moines:
2.2% (660)Iowa:
6.2% (11,148)
Liberia Des Moines:
2.2% (657)Iowa:
1.7% (2,949)
Bosnia and Herzegovina Des Moines:
2.1% (634)Iowa:
3.2% (5,751)
China, excluding Hong Kong and Taiwan Des Moines:
1.7% (515)Iowa:
4.6% (8,194)
Place of birth for U.S.-born residents:
This state: 135,162Other state: 40,506Northeast: 2,827Midwest: 22,505South: 7,641West: 7,533 84.5% of Des Moines residents lived in the same house 1 years ago.
Out of people who lived in different houses, 38.2% lived in this county.
Out of people who lived in different counties, 74.2% lived in Iowa.
Des Moines:
84.5%State average:
87.2%
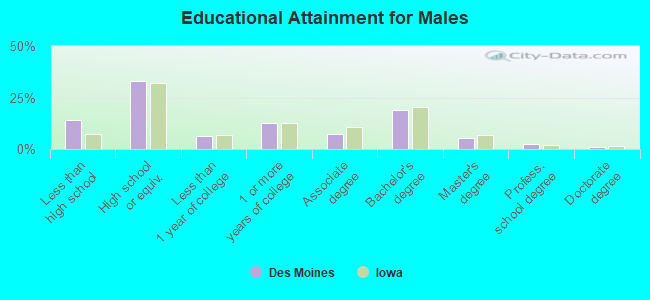
Education attainment for males 25 years and older:
No schooling: 2,863Nursery to 4th grade: 2395th and 6th grade: 4917th and 8th grade: 4549th grade: 88410th grade: 86711th grade: 1,75512th grade, no diploma: 1,893High school graduate (or equivalency): 22,397Less than 1 year of college: 4,351Some college more than 1 year, no degree: 8,500Associate degree: 4,899Bachelor's degree: 12,859Master's degree: 3,628Professional school degree: 1,585Doctorate degree: 584
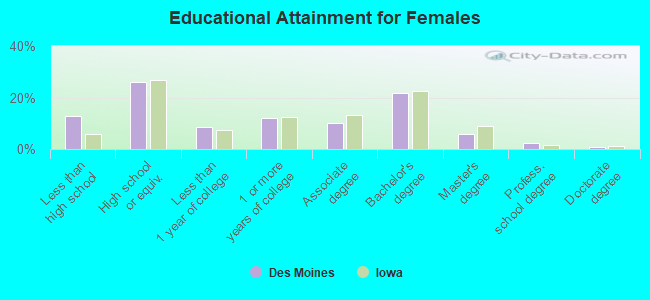
Education attainment for females 25 years and older:
No schooling: 3,255Nursery to 4th grade: 6795th and 6th grade: 4417th and 8th grade: 1939th grade: 1,09910th grade: 92411th grade: 1,39912th grade, no diploma: 1,104High school graduate (or equivalency): 18,319Less than 1 year of college: 6,176Some college more than 1 year, no degree: 8,489Associate degree: 7,078Bachelor's degree: 15,283Master's degree: 4,185Professional school degree: 1,643Doctorate degree: 592
Housing units in structures:
One, detached: 60,738One, attached: 3,720Two: 2,3613 or 4: 3,3945 to 9: 3,91910 to 19: 4,08520 to 49: 14,02650 or more: 5,993Mobile homes: 2,022Median worth of mobile homes: $22,900
Housing units lacking complete plumbing facilities in 2022: 0.9%Housing units lacking complete kitchen facilities in 2022: 1.4%House/condo owner moved in on average 11 years ago
Renter moved in on average 2 years ago
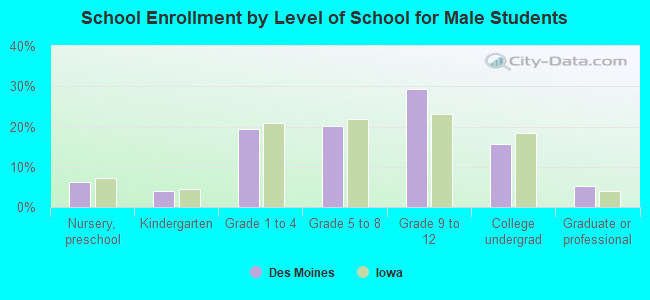
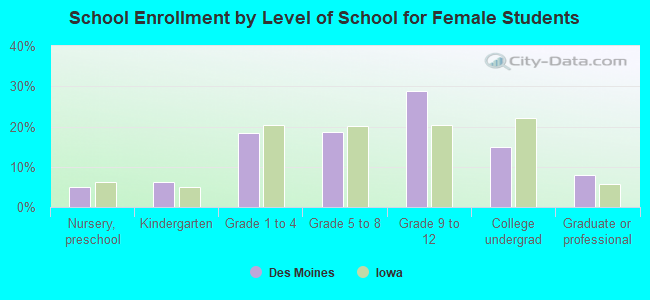
Private vs. public school enrollment:
Students in private schools in grades 1 to 8 (elementary and middle school): 1,338 Students in private schools in grades 9 to 12 (high school): 758 Students in private undergraduate colleges: 3,916