Housing density: 1,276 houses/condos per square mile
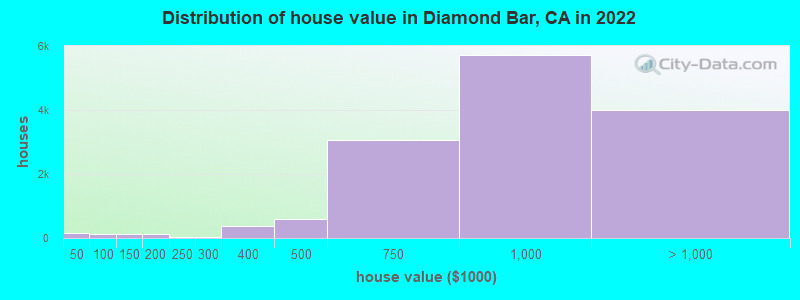
Median price asked for vacant for-sale houses and condos in 2022: $1,144,354.
Median contract rent in 2022: over $2,000 (lower quartile is $1,688, upper quartile is over $2,000)
Median rent asked for vacant for-rent units in 2022: $3,847
Median gross rent in Diamond Bar, CA in 2022: over $2,000
Housing units in Diamond Bar with a mortgage: 8,712 (863 second mortgage, 10 home equity loan, 713 both second mortgage and home equity loan) Houses without a mortgage: 69
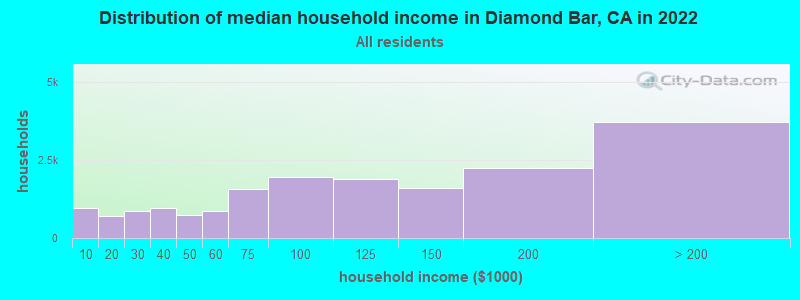
Median household income for houses/condos with a mortgage: $138,155
Median household income for apartments without a mortgage: $80,440
Median monthly housing costs: $2,214
Compare current foreclosures near Diamond Bar, CA:
7,308 married couples with children.
1,670 single-parent households (610 men, 1,060 women).
40.8% of residents of Diamond Bar speak English at home.
9.5% of residents speak Spanish at home (76% speak English very well, 16% speak English well, 7% speak English not well, 1% don't speak English at all).
4.5% of residents speak other Indo-European language at home (72% speak English very well, 20% speak English well, 4% speak English not well, 4% don't speak English at all).
44.5% of residents speak Asian or Pacific Island language at home (43% speak English very well, 33% speak English well, 20% speak English not well, 4% don't speak English at all).
0.9% of residents speak other language at home (73% speak English very well, 19% speak English well, 8% speak English not well).
Foreign born population: 23,961 (44.9%)
(71.8% of them are naturalized citizens)
Percentage of workers working in this county: 73.3% Number of people working at home: 4,892 (18.7% of all workers)
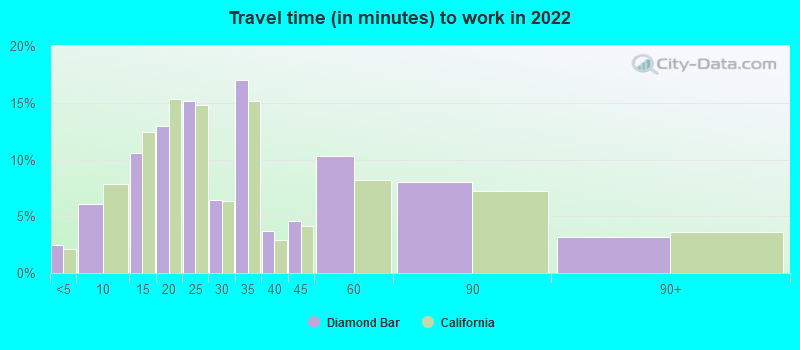
Travel time to work (commute)
Less than 5 minutes: 410
5 to 9 minutes: 852
10 to 14 minutes: 2,098
15 to 19 minutes: 1,990
20 to 24 minutes: 2,929
25 to 29 minutes: 1,168
30 to 34 minutes: 3,444
35 to 39 minutes: 946
40 to 44 minutes: 1,050
45 to 59 minutes: 3,190
60 to 89 minutes: 2,169
90 or more minutes: 1,041
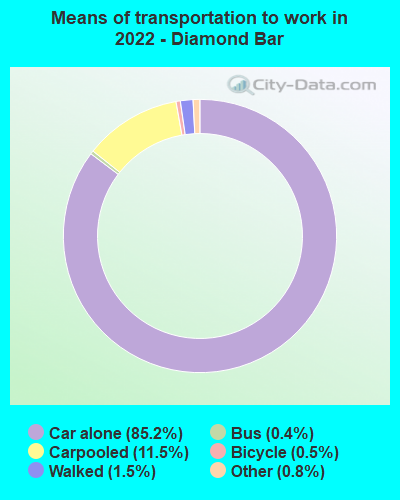
Means of transportation to work:
Drove a car alone: 10,649 (62.8%)
Carpooled: 1,585 (9.3%)
Bus: 44 (0.3%)
Long-distance train or commuter rail: 6 (0.0%)
Taxi: 111 (0.7%)
Bicycle: 70 (0.4%)
Walked: 201 (1.2%)
Worked at home: 4,892 (28.8%)
Unemployment by race in 2022
Unemployment rate for White non-Hispanic residents
1.9%Males
3.9%Females
Unemployment rate for Black residents
9.5%Males
15.0%Females
Unemployment rate for Asian residents
4.7%Males
3.8%Females
Unemployment rate for other race residents
1.1%Males
0.5%Females
Unemployment rate for two or more race residents
5.7%Males
1.0%Females
Unemployment rate for Hispanic or Latino residents
3.8%Males
3.5%Females
Year of entry for the foreign-born population in Diamond Bar, California
5,1532010 or later
4,4332000 to 2009
4,4701990 to 1999
7,3251980 to 1989
5,0591970 to 1979
2,454Before 1970
First ancestries reported:
German: 445 (1.2%)
American: 438 (1.2%)
English: 370 (1.0%)
Irish: 332 (0.9%)
Armenian: 234 (0.7%)
European: 179 (0.5%)
Lebanese: 147 (0.4%)
Italian: 143 (0.4%)
Sierra Leonean: 125 (0.3%)
Iranian: 91 (0.3%)
Norwegian: 86 (0.2%)
African: 81 (0.2%)
Polish: 71 (0.2%)
Scottish: 66 (0.2%)
Syrian: 65 (0.2%)
French: 65 (0.2%)
Russian: 64 (0.2%)
Dutch: 56 (0.2%)
Jamaican: 55 (0.2%)
Greek: 53 (0.1%)
Eastern European: 50 (0.1%)
Jordanian: 39 (0.1%)
Scotch-Irish: 33 (0.09%)
Egyptian: 28 (0.08%)
Arab: 27 (0.08%)
Swedish: 25 (0.07%)
Ukrainian: 24 (0.07%)
Czech: 15 (0.04%)
Romanian: 14 (0.04%)
French Canadian: 13 (0.04%)
Scandinavian: 13 (0.04%)
Hungarian: 13 (0.04%)
Croatian: 12 (0.03%)
Finnish: 12 (0.03%)
Nigerian: 12 (0.03%)
British: 11 (0.03%)
Welsh: 6 (0.02%)
Belizean: 5 (0.01%)
Czechoslovakian: 2 (0.01%)
Most common places of birth for foreign-born residents (%):
China, excluding Hong Kong and Taiwan
Diamond Bar:
26.4% (6,319)
California:
6.6% (684,672)
Taiwan
Diamond Bar:
17.6% (4,216)
California:
1.7% (176,274)
Korea
Diamond Bar:
15.7% (3,759)
California:
3.0% (315,248)
Philippines
Diamond Bar:
7.0% (1,682)
California:
7.8% (818,297)
India
Diamond Bar:
4.9% (1,163)
California:
5.2% (539,184)
Hong Kong
Diamond Bar:
4.5% (1,067)
California:
1.0% (105,215)
Mexico
Diamond Bar:
4.3% (1,037)
California:
37.2% (3,881,193)
Vietnam
Diamond Bar:
4.0% (961)
California:
4.9% (512,335)
Japan
Diamond Bar:
1.8% (425)
California:
1.0% (103,575)
Place of birth for U.S.-born residents:
This state: 24,399
Other state: 4,153
Northeast: 1,119
Midwest: 1,121
South: 1,091
West: 800
91.0% of Diamond Bar residents lived in the same house 1 years ago. Out of people who lived in different houses, 35.8% lived in this county. Out of people who lived in different counties, 62.5% lived in California.
Diamond Bar:
91.0%
State average:
88.9%
Education attainment for males 25 years and older:
No schooling: 741
Nursery to 4th grade: 16
5th and 6th grade: 45
7th and 8th grade: 53
9th grade: 116
10th grade: 49
11th grade: 152
12th grade, no diploma: 261
High school graduate (or equivalency): 2,671
Less than 1 year of college: 1,010
Some college more than 1 year, no degree: 2,272
Associate degree: 1,458
Bachelor's degree: 6,076
Master's degree: 2,646
Professional school degree: 683
Doctorate degree: 633
Education attainment for females 25 years and older:
No schooling: 698
Nursery to 4th grade: 74
5th and 6th grade: 136
7th and 8th grade: 117
9th grade: 66
10th grade: 78
11th grade: 64
12th grade, no diploma: 423
High school graduate (or equivalency): 2,982
Less than 1 year of college: 1,210
Some college more than 1 year, no degree: 2,168
Associate degree: 2,059
Bachelor's degree: 7,321
Master's degree: 2,942
Professional school degree: 559
Doctorate degree: 370
Housing units in structures:
One, detached: 13,227
One, attached: 2,405
Two: 72
3 or 4: 799
5 to 9: 651
10 to 19: 424
20 to 49: 150
50 or more: 787
Mobile homes: 310
Boats, RVs, vans, etc.: 9
Median worth of mobile homes: $205,436
Housing units lacking complete plumbing facilities in 2022: 0.2%
Housing units lacking complete kitchen facilities in 2022: 1.5%
House/condo owner moved in on average 18 years ago