Housing density: 945 houses/condos per square mile
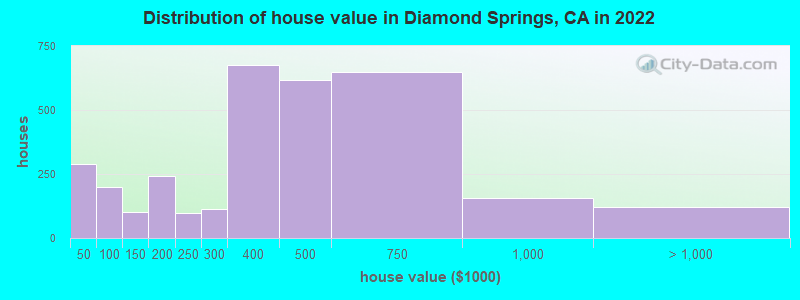
Median price asked for vacant for-sale houses and condos in 2022: $127,280.
Median contract rent in 2022: $1,571 (lower quartile is $1,025, upper quartile is over $2,000)
Median rent asked for vacant for-rent units in 2022: $1,274
Median gross rent in Diamond Springs, CA in 2022: over $2,000
Housing units in Diamond Springs with a mortgage: 2,248 (104 second mortgage, 0 home equity loan, 100 both second mortgage and home equity loan) Houses without a mortgage: 29
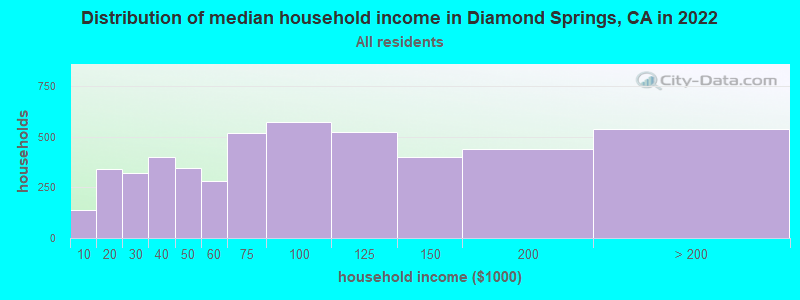
Median household income for houses/condos with a mortgage: $97,093
Median household income for apartments without a mortgage: $47,148
Median monthly housing costs: $1,751
Compare current foreclosures near Diamond Springs, CA:
Size of family households: 1,436 2-persons, 644 3-persons, 584 4-persons, 417 5-persons, 152 6-persons.
Size of nonfamily households: 1,484 1-person, 225 2-persons, 67 3-persons.
1,881 married couples with children.
323 single-parent households (186 men, 137 women).
91.5% of residents of Diamond Springs speak English at home.
5.1% of residents speak Spanish at home (76% speak English very well, 23% speak English well, 1% speak English not well).
1.7% of residents speak other Indo-European language at home (95% speak English very well, 5% speak English well).
1.5% of residents speak Asian or Pacific Island language at home (27% speak English very well, 27% speak English well, 45% speak English not well).
0.1% of residents speak other language at home (100% speak English very well).
Foreign born population: 942 (7.7%)
(29.9% of them are naturalized citizens)
Percentage of workers working in this county: 85.4% Number of people working at home: 1,103 (21.1% of all workers)
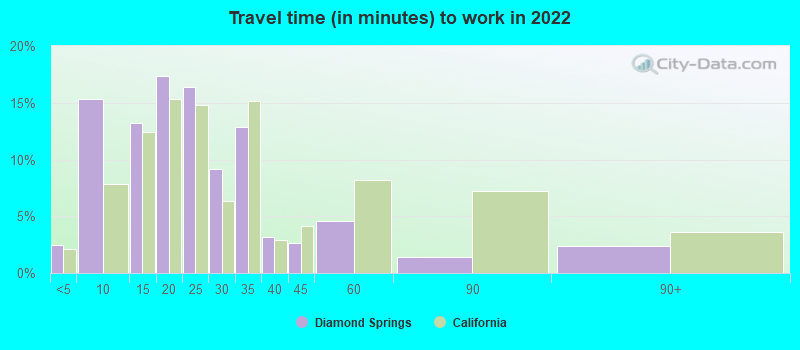
Travel time to work (commute)
Less than 5 minutes: 163
5 to 9 minutes: 672
10 to 14 minutes: 591
15 to 19 minutes: 534
20 to 24 minutes: 389
25 to 29 minutes: 379
30 to 34 minutes: 247
35 to 39 minutes: 136
40 to 44 minutes: 77
45 to 59 minutes: 304
60 to 89 minutes: 301
90 or more minutes: 81
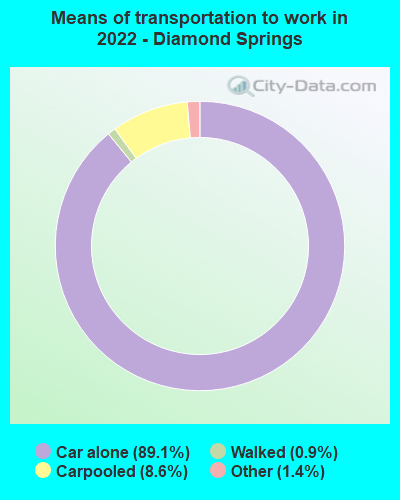
Means of transportation to work:
Drove a car alone: 4,730 (73.7%)
Carpooled: 490 (7.6%)
Taxi: 80 (1.2%)
Walked: 49 (0.8%)
Worked at home: 1,103 (17.2%)
Unemployment by race in 2022
Unemployment rate for White non-Hispanic residents
8.0%Males
0.3%Females
Unemployment rate for Black residents
51.2%Females
Unemployment rate for Hispanic or Latino residents
5.6%Females
Year of entry for the foreign-born population in Diamond Springs, California
2102010 or later
1402000 to 2009
601990 to 1999
41980 to 1989
311970 to 1979
125Before 1970
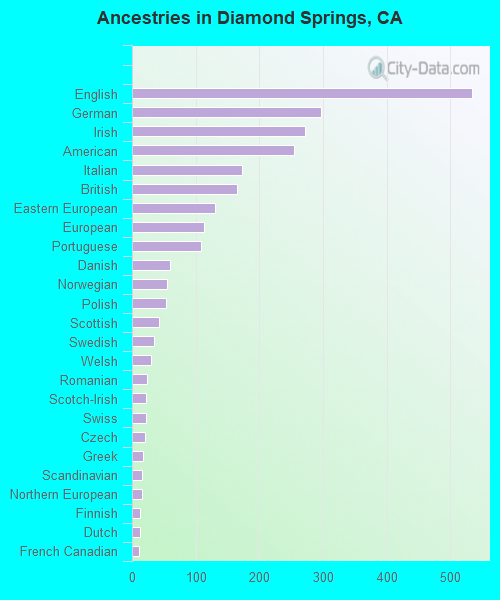
First ancestries reported:
English: 534 (13.7%)
German: 297 (7.6%)
Irish: 271 (6.9%)
American: 254 (6.5%)
Italian: 172 (4.4%)
British: 165 (4.2%)
Eastern European: 130 (3.3%)
European: 113 (2.9%)
Portuguese: 108 (2.8%)
Danish: 59 (1.5%)
Norwegian: 55 (1.4%)
Polish: 53 (1.4%)
Scottish: 43 (1.1%)
Swedish: 34 (0.9%)
Welsh: 30 (0.8%)
Romanian: 24 (0.6%)
Scotch-Irish: 22 (0.6%)
Swiss: 22 (0.6%)
Czech: 20 (0.5%)
Greek: 17 (0.4%)
Scandinavian: 16 (0.4%)
Northern European: 15 (0.4%)
Finnish: 13 (0.3%)
Dutch: 12 (0.3%)
French Canadian: 11 (0.3%)
Russian: 10 (0.3%)
Croatian: 9 (0.2%)
Yugoslavian: 5 (0.1%)
Most common places of birth for foreign-born residents (%):
Mexico
Diamond Springs:
19.6% (156)
California:
37.2% (3,881,193)
Korea
Diamond Springs:
15.5% (123)
California:
3.0% (315,248)
England
Diamond Springs:
14.2% (113)
California:
0.6% (57,953)
Canada
Diamond Springs:
13.2% (105)
California:
1.2% (127,477)
Australia
Diamond Springs:
10.9% (87)
California:
0.2% (23,338)
United Kingdom, excluding England and Scotland
Diamond Springs:
5.5% (44)
California:
0.6% (60,582)
China, excluding Hong Kong and Taiwan
Diamond Springs:
3.0% (24)
California:
6.6% (684,672)
Germany
Diamond Springs:
2.4% (19)
California:
0.7% (73,304)
Kenya
Diamond Springs:
2.0% (16)
California:
0.1% (12,503)
Romania
Diamond Springs:
1.9% (15)
California:
0.2% (23,058)
Cambodia
Diamond Springs:
1.8% (14)
California:
0.5% (51,974)
Italy
Diamond Springs:
1.8% (14)
California:
0.3% (31,439)
Ireland
Diamond Springs:
1.5% (12)
California:
0.2% (16,042)
Philippines
Diamond Springs:
1.5% (12)
California:
7.8% (818,297)
Place of birth for U.S.-born residents:
This state: 8,958
Other state: 2,247
Northeast: 450
Midwest: 742
South: 382
West: 676
90.0% of Diamond Springs residents lived in the same house 1 years ago. Out of people who lived in different houses, 40.3% lived in this county. Out of people who lived in different counties, 88.2% lived in California.
Diamond Springs:
90.0%
State average:
88.9%
Education attainment for males 25 years and older:
No schooling: 15
Nursery to 4th grade: 12
5th and 6th grade: 28
7th and 8th grade: 5
9th grade: 11
10th grade: 31
11th grade: 31
12th grade, no diploma: 44
High school graduate (or equivalency): 1,407
Less than 1 year of college: 256
Some college more than 1 year, no degree: 1,045
Associate degree: 583
Bachelor's degree: 648
Master's degree: 191
Professional school degree: 49
Doctorate degree: 59
Education attainment for females 25 years and older:
No schooling: 67
Nursery to 4th grade: 0
5th and 6th grade: 6
7th and 8th grade: 28
9th grade: 0
10th grade: 7
11th grade: 22
12th grade, no diploma: 33
High school graduate (or equivalency): 1,124
Less than 1 year of college: 428
Some college more than 1 year, no degree: 878
Associate degree: 669
Bachelor's degree: 993
Master's degree: 322
Professional school degree: 17
Doctorate degree: 57
Housing units in structures:
One, detached: 3,561
One, attached: 304
Two: 11
3 or 4: 297
5 to 9: 73
10 to 19: 98
20 to 49: 118
50 or more: 119
Mobile homes: 1,030
Median worth of mobile homes: $272,874
Housing units lacking complete plumbing facilities in 2022: 1.5%
Housing units lacking complete kitchen facilities in 2022: 1.7%