Dickinson, ND (North Dakota) Houses and Residents
| Dickinson: | $262,025 |
| North Dakota: | $243,100 |
Total population: 22,322 (Urban population: 15,453 (all inside urban clusters), Rural population: 391 (all nonfarm))
Houses: 11,893 (10,394 occupied: 6,158 owner occupied, 4,454 renter occupied)
| % of renters here: | 42% |
| State: | 35% |
Housing density: 1,256 houses/condos per square mile
Median price asked for vacant for-sale houses and condos in 2022: $285,519.
Median contract rent in 2022: $829 (lower quartile is $647, upper quartile is $1,014)
Median rent asked for vacant for-rent units in 2022: $1,073
Median gross rent in Dickinson, ND in 2022: $921
Housing units in Dickinson with a mortgage: 3,797 (231 second mortgage, 0 home equity loan, 167 both second mortgage and home equity loan)
Houses without a mortgage: 97
Median household income for houses/condos with a mortgage: $101,744
Median household income for apartments without a mortgage: $81,082
Median monthly housing costs: $1,025
Compare current foreclosures near Dickinson, ND:
| Photo | Address | Area | Beds / Baths | Price | Details |
|---|---|---|---|---|---|

|
#1
State Ave
Dickinson, ND 58601
|
1,395 sq. feet
|
2 baths 5 beds |
show details | |

|
#2
Shinagle Dr
Dickinson, ND 58601
|
950 sq. feet
|
2 baths 4 beds |
show details | |

|
#3
Park St
Dickinson, ND 58601
|
3,060 sq. feet
|
3 baths 3 beds |
show details | |

|
#4
1st Ave W
Dickinson, ND 58601
|
- sq. feet
|
1 baths 5 beds |
show details | |

|
#5
Roughrider Blvd Apt 211
Dickinson, ND 58601
|
- sq. feet
|
- baths - beds |
show details | |

|
#6
Sparrow Dr
Dickinson, ND 58601
|
- sq. feet
|
- baths - beds |
show details | |

|
#7
4th Ave W
Dickinson, ND 58601
|
- sq. feet
|
- baths - beds |
show details | |

|
#8
Carroll St Apt 105
Dickinson, ND 58601
|
- sq. feet
|
- baths - beds |
show details | |

|
#9
47th St SW
Dickinson, ND 58601
|
- sq. feet
|
- baths - beds |
show details | |

|
#10
Dakota Blvd
Dickinson, ND 58601
|
- sq. feet
|
- baths - beds |
show details |
| Photo | Address | Area | Beds / Baths | Price | Details |
|---|---|---|---|---|---|

|
#11
7th St SW Apt 2
Dickinson, ND 58601
|
- sq. feet
|
- baths - beds |
show details | |

|
#12
2nd St SW
Dickinson, ND 58601
|
- sq. feet
|
- baths - beds |
show details | |

|
#13
44th St SW
Dickinson, ND 58601
|
- sq. feet
|
- baths - beds |
show details | |

|
#14
6th Ave SW
Dickinson, ND 58601
|
- sq. feet
|
- baths - beds |
show details | |

|
#15
Kuchenski Dr Apt 6
Dickinson, ND 58601
|
- sq. feet
|
- baths - beds |
show details | |

|
#16
4th St W
Dickinson, ND 58601
|
- sq. feet
|
- baths - beds |
show details | |

|
#17
44th St SW
Dickinson, ND 58601
|
- sq. feet
|
- baths - beds |
show details | |

|
#18
25th St W
Dickinson, ND 58601
|
- sq. feet
|
- baths - beds |
show details | |

|
Check over 1 million property listings on Foreclosure.com!
|
browse all offers | |||

Latest news about housing in Dickinson, ND collected exclusively by city-data.com from local newspapers, TV, and radio stations

 | Residents Being KICKED OUT of DICKINSON MOBILE HOMES! (7 replies) |
| Wanting to buy a cheap house in a small town (35 replies) |
| Looking for rental homes in minot/fargo/williston etc. <SP> (3 replies) |
| Dickinson Apartment Rental (0 replies) |
| Moving to Dickinson, ND (3 replies) |
| Dickinson Rental Rates (4 replies) |

Median year apartment built: 2007
Household type by relationship:
Households: 25,193- Male householders: 5,172 (1,621 living alone), Female householders: 5,105 (1,919 living alone)
4,667 spouses (4,637 opposite-sex spouses), 855 unmarried partners, (855 opposite-sex unmarried partners), 7,211 children (6,932 natural, 118 adopted, 160 stepchildren), 119 grandchildren, 196 brothers or sisters, 115 parents, 34 foster children, 246 other relatives, 720 non-relatives
- In group quarters: 748
Size of family households: 2,617 2-persons, 1,064 3-persons, 1,276 4-persons, 629 5-persons, 333 6-persons, 147 7-or-more-persons.
Size of nonfamily households: 3,668 1-person, 707 2-persons, 67 3-persons, 70 4-persons, 14 5-persons.
5,278 married couples with children.
828 single-parent households (245 men, 583 women).
92.0% of residents of Dickinson speak English at home.
4.5% of residents speak Spanish at home (77% speak English very well, 12% speak English well, 11% speak English not well).
1.1% of residents speak other Indo-European language at home (72% speak English very well, 20% speak English well, 8% speak English not well).
1.7% of residents speak Asian or Pacific Island language at home (52% speak English very well, 48% speak English well).
1.1% of residents speak other language at home (23% speak English very well, 58% speak English well, 19% speak English not well).
Foreign born population: 1,070 (4.2%)
(50.1% of them are naturalized citizens)
| Here: | 6.9 |
| State: | 7.0 |
| Here: | 3.7 |
| State: | 4.0 |

- Bedrooms in owner-occupied houses and condos in Dickinson, North Dakota
- 6no bedroom
- 1021 bedroom
- 1,1222 bedrooms
- 2,1333 bedrooms
- 1,9444 bedrooms
- 8525+ bedrooms

- Bedrooms in renter-occupied apartments in Dickinson, North Dakota
- 163no bedroom
- 1,3141 bedroom
- 1,8522 bedrooms
- 8663 bedrooms
- 1704 bedrooms
- 905+ bedrooms

- Cars and other vehicles available in Dickinson in owner-occupied houses/condos
- 191no vehicle
- 1,4491 vehicle
- 2,5002 vehicles
- 1,3683 vehicles
- 4894 vehicles
- 1625+ vehicles

- Cars and other vehicles available in Dickinson in renter-occupied apartments
- 494no vehicle
- 2,3331 vehicle
- 1,2522 vehicles
- 2393 vehicles
- 924 vehicles
- 455+ vehicles

- Rooms in owner-occupied houses in Dickinson, North Dakota
- 61 room
- 02 rooms
- 1503 rooms
- 4364 rooms
- 9245 rooms
- 1,1456 rooms
- 8757 rooms
- 9978 rooms
- 1,6259+ rooms

- Rooms in renter-occupied apartments in Dickinson, North Dakota
- 1631 room
- 5632 rooms
- 1,1763 rooms
- 1,0404 rooms
- 7735 rooms
- 3706 rooms
- 907 rooms
- 1068 rooms
- 1759+ rooms


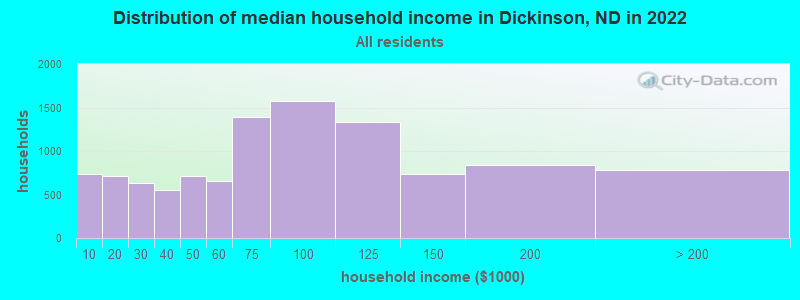
Dickinson, ND household income distribution

- 733Less than $10,000
- 707$10,000 to $19,999
- 631$20,000 to $29,999
- 547$30,000 to $39,999
- 714$40,000 to $49,999
- 658$50,000 to $59,999
- 1,391$60,000 to $74,999
- 1,569$75,000 to $99,999
- 1,336$100,000 to $124,999
- 733$125,000 to $149,999
- 835$150,000 to $199,999
- 784$200,000 or more
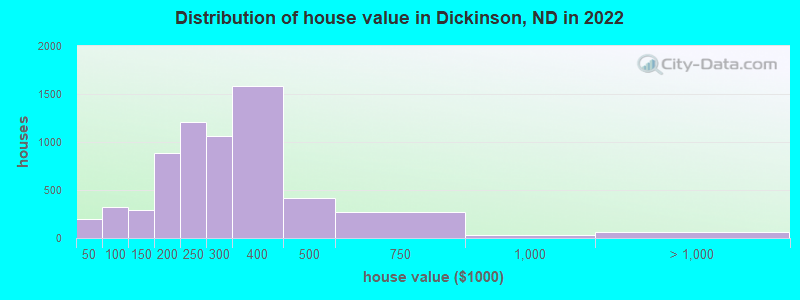
Home value of owner - occupied houses in 2022 in Dickinson, ND
-
- 10Less than $10,000
- 26$10,000 to $14,999
- 121$20,000 to $24,999
- 11$30,000 to $34,999
- 27$35,000 to $39,999
- 96$50,000 to $59,999
- 15$60,000 to $69,999
- 49$70,000 to $79,999
- 136$80,000 to $89,999
- 20$90,000 to $99,999
- 158$100,000 to $124,999
- 136$125,000 to $149,999
- 438$150,000 to $174,999
- 442$175,000 to $199,999
- 1,204$200,000 to $249,999
- 1,064$250,000 to $299,999
- 1,587$300,000 to $399,999
- 421$400,000 to $499,999
- 270$500,000 to $749,999
- 30$750,000 to $999,999
- 65$2,000,000 or more
Rent paid by renters in 2022 in Dickinson, ND
-
- 11$100 to $149
- 44$150 to $199
- 85$200 to $249
- 23$250 to $299
- 16$350 to $399
- 156$400 to $449
- 250$450 to $499
- 25$500 to $549
- 194$550 to $599
- 103$600 to $649
- 414$650 to $699
- 157$700 to $749
- 172$750 to $799
- 848$800 to $899
- 685$900 to $999
- 292$1,000 to $1,249
- 279$1,250 to $1,499
- 211$1,500 to $1,999
- 65$2,000 to $2,499
- 102$2,500 to $2,999
- 6$3,000 to $3,499
- 142No cash rent


Percentage of workers working in this county: 91.0%
Number of people working at home: 634 (4.9% of all workers)
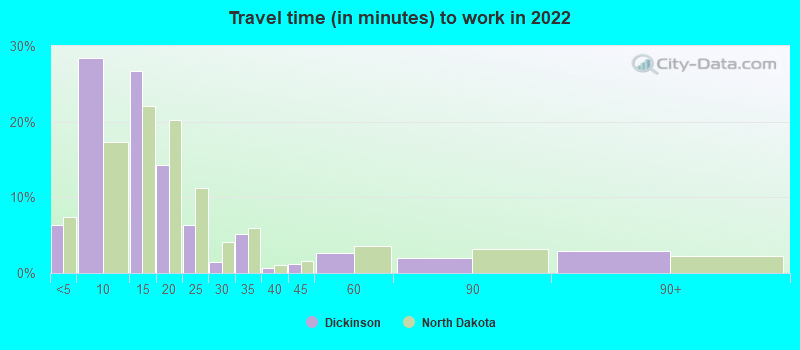
Travel time to work (commute)
- Less than 5 minutes: 676
- 5 to 9 minutes: 3,494
- 10 to 14 minutes: 3,412
- 15 to 19 minutes: 1,698
- 20 to 24 minutes: 754
- 25 to 29 minutes: 148
- 30 to 34 minutes: 659
- 35 to 39 minutes: 30
- 40 to 44 minutes: 79
- 45 to 59 minutes: 273
- 60 to 89 minutes: 266
- 90 or more minutes: 395
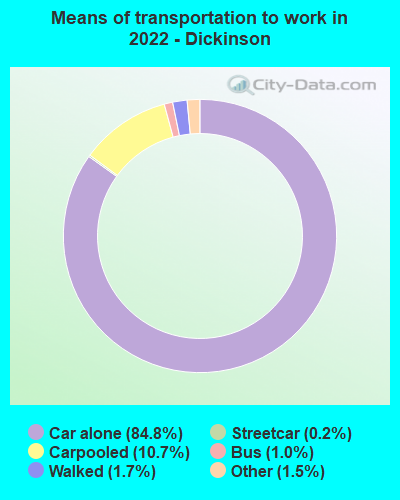
Means of transportation to work:
- Drove a car alone: 9,644 (79.8%)
- Carpooled: 1,280 (10.6%)
- Bus: 80 (0.7%)
- Subway or elevated rail: 17 (0.1%)
- Taxi: 135 (1.1%)
- Bicycle: 5 (0.0%)
- Walked: 213 (1.8%)
- Worked at home: 634 (5.2%)

- Unemployment by race in 2022
- Unemployment rate for White non-Hispanic residents
- 2.0%Males
- 1.0%Females
- Unemployment rate for American Indian and Alaska Native residents
- 23.3%Males
- Unemployment rate for other race residents
- 34.6%Males
- 25.8%Females
- Unemployment rate for two or more race residents
- 4.1%Males
- Unemployment rate for Hispanic or Latino residents
- 13.0%Males
- 17.5%Females

- Year of entry for the foreign-born population in Dickinson, North Dakota
- 4492010 or later
- 3822000 to 2009
- 841990 to 1999
- 61980 to 1989
- 251970 to 1979
- 24Before 1970

First ancestries reported:
- German: 4,542 (38.5%)
- American: 1,562 (13.2%)
- English: 941 (8.0%)
- Norwegian: 876 (7.4%)
- Irish: 397 (3.4%)
- Italian: 240 (2.0%)
- Ukrainian: 225 (1.9%)
- Czech: 163 (1.4%)
- Danish: 158 (1.3%)
- German Russian: 131 (1.1%)
- Finnish: 111 (0.9%)
- Swedish: 94 (0.8%)
- French Canadian: 92 (0.8%)
- Scottish: 79 (0.7%)
- European: 72 (0.6%)
- Zimbabwean: 61 (0.5%)
- Scandinavian: 35 (0.3%)
- Dutch: 29 (0.2%)
- French: 27 (0.2%)
- Croatian: 26 (0.2%)
- Serbian: 25 (0.2%)
- Polish: 18 (0.2%)
- Haitian: 18 (0.2%)
- Cape Verdean: 17 (0.1%)
- Pennsylvania German: 16 (0.1%)
- Jamaican: 16 (0.1%)
- Czechoslovakian: 15 (0.1%)
- Welsh: 11 (0.09%)
- Basque: 10 (0.08%)
- Northern European: 8 (0.07%)
- Portuguese: 7 (0.06%)
- Ghanaian: 1 (0.01%)
Most common places of birth for foreign-born residents (%):
| Dickinson: | 22.2% (228) |
| North Dakota: | 8.0% (2,889) |
| Dickinson: | 18.0% (184) |
| North Dakota: | 1.2% (431) |
| Dickinson: | 10.8% (111) |
| North Dakota: | 6.9% (2,472) |
| Dickinson: | 9.0% (92) |
| North Dakota: | 2.2% (778) |
| Dickinson: | 4.8% (49) |
| North Dakota: | 2.1% (740) |
| Dickinson: | 4.8% (49) |
| North Dakota: | 0.4% (144) |
| Dickinson: | 4.6% (47) |
| North Dakota: | 0.2% (70) |
| Dickinson: | 4.5% (46) |
| North Dakota: | 0.1% (49) |
| Dickinson: | 2.9% (30) |
| North Dakota: | 0.4% (158) |
| Dickinson: | 2.7% (28) |
| North Dakota: | 0.3% (93) |
| Dickinson: | 2.5% (26) |
| North Dakota: | 0.7% (241) |
| Dickinson: | 2.4% (25) |
| North Dakota: | 0.6% (217) |
| Dickinson: | 2.0% (20) |
| North Dakota: | 1.5% (542) |
| Dickinson: | 1.7% (17) |
| North Dakota: | 0.7% (235) |
| Dickinson: | 1.6% (16) |
| North Dakota: | 1.0% (376) |
Place of birth for U.S.-born residents:
- This state: 14,042
- Other state: 9,542
- Northeast: 232
- Midwest: 3,104
- South: 813
- West: 5,333
80.9% of Dickinson residents lived in the same house 1 years ago.
Out of people who lived in different houses, 33.3% lived in this county.
Out of people who lived in different counties, 43.2% lived in North Dakota.
| Dickinson: | 80.9% |
| State average: | 84.2% |
Education attainment for males 25 years and older:
- No schooling: 85
- Nursery to 4th grade: 4
- 5th and 6th grade: 2
- 7th and 8th grade: 134
- 9th grade: 87
- 10th grade: 54
- 11th grade: 134
- 12th grade, no diploma: 146
- High school graduate (or equivalency): 2,548
- Less than 1 year of college: 534
- Some college more than 1 year, no degree: 1,825
- Associate degree: 1,020
- Bachelor's degree: 1,202
- Master's degree: 512
- Professional school degree: 69
- Doctorate degree: 28

Education attainment for females 25 years and older:
- No schooling: 21
- Nursery to 4th grade: 4
- 5th and 6th grade: 0
- 7th and 8th grade: 266
- 9th grade: 52
- 10th grade: 70
- 11th grade: 52
- 12th grade, no diploma: 197
- High school graduate (or equivalency): 2,446
- Less than 1 year of college: 356
- Some college more than 1 year, no degree: 1,037
- Associate degree: 986
- Bachelor's degree: 1,899
- Master's degree: 374
- Professional school degree: 58
- Doctorate degree: 48


Housing units in structures:
- One, detached: 6,170
- One, attached: 724
- Two: 154
- 3 or 4: 589
- 5 to 9: 573
- 10 to 19: 1,069
- 20 to 49: 1,512
- 50 or more: 564
- Mobile homes: 535
Housing units lacking complete kitchen facilities in 2022: 0.6%
House/condo owner moved in on average 8 years ago
Renter moved in on average 3 years ago

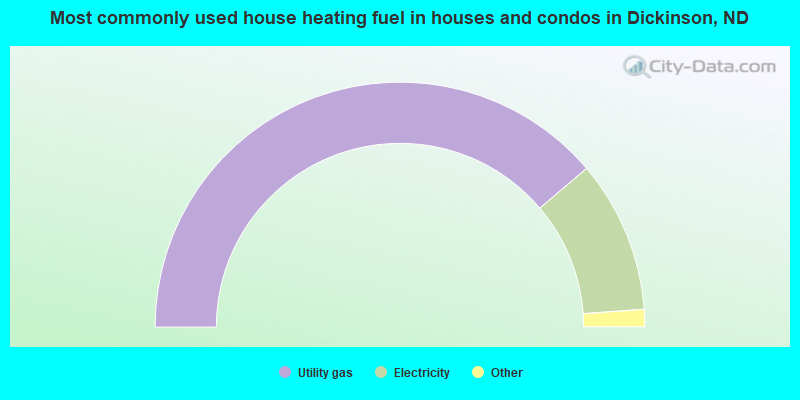
- 77.5%Utility gas
- 20.1%Electricity
- 1.1%Fuel oil, kerosene, etc.
- 0.8%Bottled, tank, or LP gas
- 0.3%Other fuel
- 0.2%No fuel used
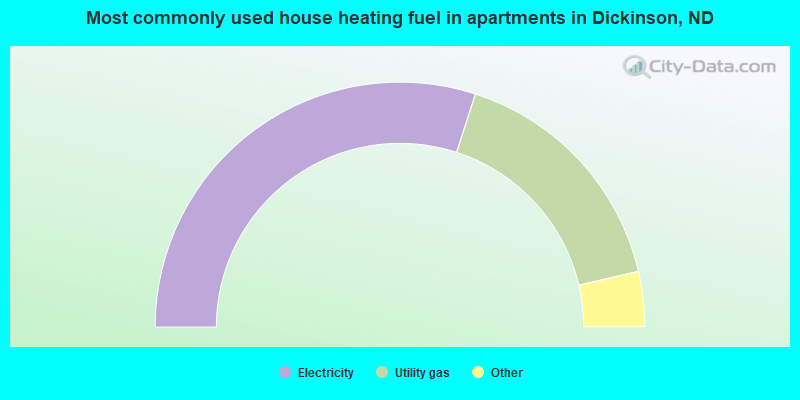
- 60.0%Electricity
- 32.7%Utility gas
- 3.7%Other fuel
- 3.2%No fuel used
- 0.4%Bottled, tank, or LP gas
Private vs. public school enrollment:
| Here: | 23.2% |
| North Dakota: | 8.4% |
| Here: | 21.1% |
| North Dakota: | 8.2% |
| Here: | 10.1% |
| North Dakota: | 14.3% |


