Dillwyn, VA (Virginia) Houses and Residents
| Dillwyn: | $203,729 |
| Virginia: | $365,700 |
Mean price in 2022:
Detached houses: $196,963
Here: $196,963 State: $472,865 Mobile homes: $148,496
Here: $148,496 State: $100,736
Total population: 443 (Urban population: 0, Rural population: 529 (all nonfarm))
Houses: 258 (238 occupied: 170 owner occupied, 70 renter occupied)
| % of renters here: | 29% |
| State: | 33% |
Housing density: 373 houses/condos per square mile
Median price asked for vacant for-sale houses and condos in 2022 in this county: $154,088.
Median contract rent in 2022: $497 (lower quartile is $204, upper quartile is $755)
Median rent asked for vacant for-rent units in 2022: $716
Median gross rent in Dillwyn, VA in 2022: $836
Housing units in Dillwyn with a mortgage: 75 (4 second mortgage, 0 home equity loan, 4 both second mortgage and home equity loan)
Houses without a mortgage: 0
Median household income for houses/condos with a mortgage: $67,606
Median household income for apartments without a mortgage: $55,617
Median monthly housing costs: $721
Compare current foreclosures near Dillwyn, VA:
| Photo | Address | Area | Beds / Baths | Price | Details |
|---|---|---|---|---|---|

|
#1
Bell Rd
Dillwyn, VA 23936
|
- sq. feet
|
- baths - beds |
show details | |

|
#2
Gravel Hill Rd
Dillwyn, VA 23936
|
- sq. feet
|
- baths - beds |
show details | |

|
#3
S Constitution Rte
Dillwyn, VA 23936
|
- sq. feet
|
- baths - beds |
show details | |

|
#4
Main St
Dillwyn, VA 23936
|
- sq. feet
|
- baths - beds |
show details | |

|
#5
Saint Andrews Rd
Dillwyn, VA 23936
|
- sq. feet
|
- baths - beds |
show details | |

|
#6
Bell Rd
Dillwyn, VA 23936
|
- sq. feet
|
- baths - beds |
show details | |

|
#7
Brickyard Dr Apt D5
Dillwyn, VA 23936
|
- sq. feet
|
- baths - beds |
show details | |

|
#8
Brickyard Dr Apt A8
Dillwyn, VA 23936
|
- sq. feet
|
- baths - beds |
show details | |

|
#9
S Constitution Rte
Dillwyn, VA 23936
|
- sq. feet
|
- baths - beds |
show details | |

|
#10
New Store Rd
Dillwyn, VA 23936
|
- sq. feet
|
- baths - beds |
show details |
| Photo | Address | Area | Beds / Baths | Price | Details |
|---|---|---|---|---|---|

|
#11
S Constitution Rte
Dillwyn, VA 23936
|
- sq. feet
|
- baths - beds |
show details | |

|
#12
Scotts Bottom Rd
Dillwyn, VA 23936
|
- sq. feet
|
- baths - beds |
show details | |

|
#13
Bell Rd
Dillwyn, VA 23936
|
- sq. feet
|
- baths - beds |
show details | |

|
#14
Rosney Rd
Dillwyn, VA 23936
|
- sq. feet
|
- baths - beds |
show details | |

|
#15
Mill Rd
Dillwyn, VA 23936
|
- sq. feet
|
- baths - beds |
show details | |

|
#16
Buffalo Rd
Dillwyn, VA 23936
|
- sq. feet
|
- baths - beds |
show details | |

|
#17
Slate River Mill Rd
Dillwyn, VA 23936
|
- sq. feet
|
- baths - beds |
show details | |

|
#18
Plank Rd
Dillwyn, VA 23936
|
- sq. feet
|
- baths - beds |
show details | |

|
#19
Tanks Ln
Buckingham, VA 23921
|
938 sq. feet
|
1 baths 2 beds |
show details | |

|
#20
Shores Rd
Palmyra, VA 22963
|
2,128 sq. feet
|
2 baths 4 beds |
show details |
| Photo | Address | Area | Beds / Baths | Price | Details |
|---|---|---|---|---|---|

|
#21
Roberts St
Farmville, VA 23901
|
- sq. feet
|
- baths - beds |
show details | |

|
#22
Homer Cir
Farmville, VA 23901
|
- sq. feet
|
- baths - beds |
show details | |

|
#23
Marions Aly
Arvonia, VA 23004
|
- sq. feet
|
- baths - beds |
show details | |

|
#24
Fletcher Dr
Farmville, VA 23901
|
- sq. feet
|
- baths - beds |
show details | |

|
#25
Mottley Mill Rd
Cumberland, VA 23040
|
- sq. feet
|
- baths - beds |
show details | |

|
#26
Georgia Creek Rd
Scottsville, VA 24590
|
- sq. feet
|
- baths - beds |
show details | |

|
#27
Mottley Mill Rd
Cumberland, VA 23040
|
- sq. feet
|
- baths - beds |
show details | |

|
#28
Deer Run Rd
Farmville, VA 23901
|
- sq. feet
|
- baths - beds |
show details | |

|
#29
Old Fifteen Rd
New Canton, VA 23123
|
- sq. feet
|
- baths - beds |
show details | |

|
#30
Bridgeport Rd
Arvonia, VA 23004
|
- sq. feet
|
- baths - beds |
show details |
| Photo | Address | Area | Beds / Baths | Price | Details |
|---|---|---|---|---|---|

|
#31
N James Madison Hwy
New Canton, VA 23123
|
- sq. feet
|
- baths - beds |
show details | |

|
#32
High St # 5
Farmville, VA 23901
|
- sq. feet
|
- baths - beds |
show details | |

|
#33
Coats Ln
Scottsville, VA 24590
|
- sq. feet
|
- baths - beds |
show details | |

|
#34
Shelton Store Rd
Wingina, VA 24599
|
- sq. feet
|
- baths - beds |
show details | |

|
#35
Penlan Rd
New Canton, VA 23123
|
- sq. feet
|
- baths - beds |
show details | |

|
#36
Penlan Rd
Arvonia, VA 23004
|
- sq. feet
|
- baths - beds |
show details | |

|
#37
Apple Blossom Rd
Farmville, VA 23901
|
- sq. feet
|
- baths - beds |
show details | |

|
#38
Peaks Rd
Prospect, VA 23960
|
- sq. feet
|
- baths - beds |
show details | |

|
#39
E James Anderson Hwy
Cumberland, VA 23040
|
- sq. feet
|
- baths - beds |
show details | |

|
#40
First Rock Rd
Prospect, VA 23960
|
- sq. feet
|
- baths - beds |
show details |
| Photo | Address | Area | Beds / Baths | Price | Details |
|---|---|---|---|---|---|

|
#41
W Osborn Rd
Farmville, VA 23901
|
- sq. feet
|
- baths - beds |
show details | |

|
#42
Hobson Rd
Cumberland, VA 23040
|
- sq. feet
|
- baths - beds |
show details | |

|
#43
Harris Creek Rd
Prospect, VA 23960
|
- sq. feet
|
- baths - beds |
show details | |

|
#44
Goshen Rd
Cumberland, VA 23040
|
- sq. feet
|
- baths - beds |
show details | |

|
#45
Whorley Town Rd
Buckingham, VA 23921
|
- sq. feet
|
- baths - beds |
show details | |

|
#46
School Rd
Farmville, VA 23901
|
- sq. feet
|
- baths - beds |
show details | |

|
#47
Cooks Rd
Farmville, VA 23901
|
- sq. feet
|
- baths - beds |
show details | |

|
#48
Duncan Store Rd
Columbia, VA 23038
|
- sq. feet
|
- baths - beds |
show details | |

|
#49
Sunnyside Rd
Cumberland, VA 23040
|
- sq. feet
|
- baths - beds |
show details | |

|
Check over 1 million property listings on Foreclosure.com!
|
browse all offers | |||

Latest news about housing in Dillwyn, VA collected exclusively by city-data.com from local newspapers, TV, and radio stations


Median year apartment built: 1968
Household type by relationship:
Households: 583- Male householders: 92 (54 living alone), Female householders: 143 (53 living alone)
95 spouses (92 opposite-sex spouses), 5 unmarried partners, (5 opposite-sex unmarried partners), 149 children (148 natural, 0 adopted, 1 stepchildren), 23 grandchildren, 0 brothers or sisters, 5 parents, 0 foster children, 0 other relatives, 4 non-relatives
- In group quarters: 65
Size of family households: 50 2-persons, 27 3-persons, 24 4-persons, 25 5-persons.
Size of nonfamily households: 110 1-person, 1 2-persons.
24 married couples with children.
15 single-parent households (0 men, 15 women).
97.5% of residents of Dillwyn speak English at home.
2.5% of residents speak other Indo-European language at home (64% speak English very well, 36% speak English well).
Foreign born population: 17 (2.9%)
(105.9% of them are naturalized citizens)
| Here: | 5.6 |
| State: | 7.0 |
| Here: | 4.9 |
| State: | 4.3 |

- Bedrooms in owner-occupied houses and condos in Dillwyn, Virginia
- 0no bedroom
- 121 bedroom
- 242 bedrooms
- 1123 bedrooms
- 234 bedrooms
- 05+ bedrooms

- Bedrooms in renter-occupied apartments in Dillwyn, Virginia
- 0no bedroom
- 31 bedroom
- 332 bedrooms
- 353 bedrooms
- 04 bedrooms
- 05+ bedrooms

- Cars and other vehicles available in Dillwyn in owner-occupied houses/condos
- 10no vehicle
- 311 vehicle
- 782 vehicles
- 293 vehicles
- 104 vehicles
- 125+ vehicles

- Cars and other vehicles available in Dillwyn in renter-occupied apartments
- 28no vehicle
- 201 vehicle
- 132 vehicles
- 103 vehicles
- 04 vehicles
- 05+ vehicles

- Rooms in owner-occupied houses in Dillwyn, Virginia
- 01 room
- 02 rooms
- 13 rooms
- 204 rooms
- 585 rooms
- 486 rooms
- 227 rooms
- 88 rooms
- 149+ rooms

- Rooms in renter-occupied apartments in Dillwyn, Virginia
- 01 room
- 02 rooms
- 13 rooms
- 144 rooms
- 435 rooms
- 126 rooms
- 07 rooms
- 08 rooms
- 09+ rooms


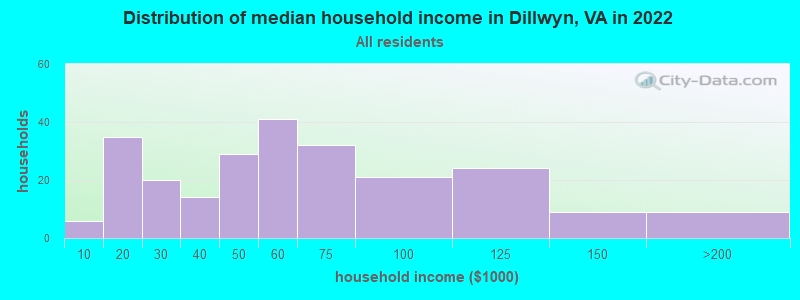
Dillwyn, VA household income distribution

- 6Less than $10,000
- 35$10,000 to $19,999
- 20$20,000 to $29,999
- 14$30,000 to $39,999
- 29$40,000 to $49,999
- 41$50,000 to $59,999
- 32$60,000 to $74,999
- 21$75,000 to $99,999
- 24$100,000 to $124,999
- 9$125,000 to $149,999
- 9$150,000 to $199,999
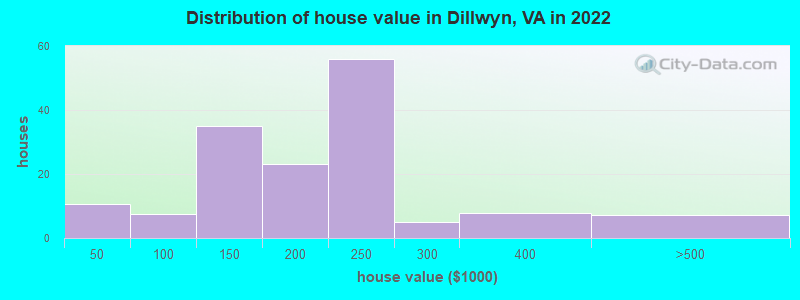
Home value of owner - occupied houses in 2022 in Dillwyn, VA
-
- 1Less than $10,000
- 3$10,000 to $14,999
- 2$15,000 to $19,999
- 2$30,000 to $34,999
- 0$40,000 to $49,999
- 2$80,000 to $89,999
- 3$90,000 to $99,999
- 21$100,000 to $124,999
- 13$125,000 to $149,999
- 17$150,000 to $174,999
- 5$175,000 to $199,999
- 55$200,000 to $249,999
- 4$250,000 to $299,999
- 7$300,000 to $399,999
- 7$400,000 to $499,999
Rent paid by renters in 2022 in Dillwyn, VA
-
- 15$100 to $149
- 13$200 to $249
- 5$300 to $349
- 1$450 to $499
- 3$550 to $599
- 11$650 to $699
- 13$750 to $799
- 4$800 to $899
- 2No cash rent


Percentage of workers working in this county: 53.2%
Number of people working at home: 6 (2.1% of all workers)
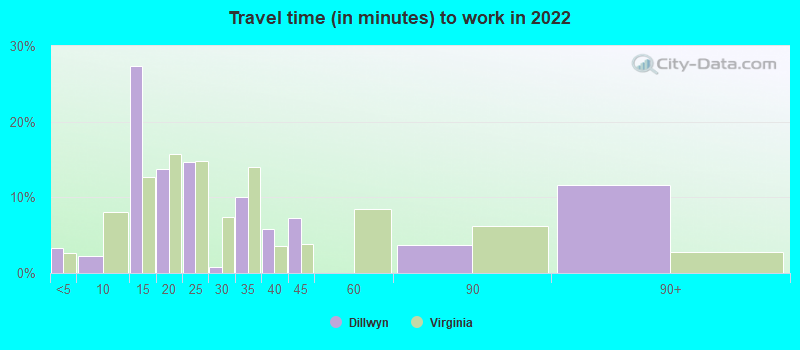
Travel time to work (commute)
- Less than 5 minutes: 28
- 5 to 9 minutes: 35
- 10 to 14 minutes: 13
- 15 to 19 minutes: 51
- 20 to 24 minutes: 0
- 25 to 29 minutes: 6
- 30 to 34 minutes: 5
- 35 to 39 minutes: 0
- 40 to 44 minutes: 0
- 45 to 59 minutes: 84
- 60 to 89 minutes: 27
- 90 or more minutes: 5
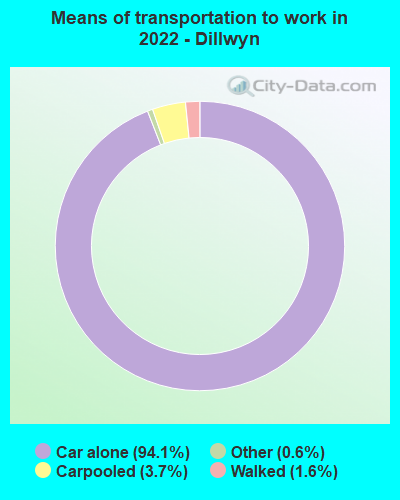
Means of transportation to work:
- Drove a car alone: 615 (89.0%)
- Carpooled: 24 (3.5%)
- Taxi: 4 (0.6%)
- Walked: 11 (1.6%)
- Worked at home: 6 (0.9%)

- Unemployment by race in 2022
- Unemployment rate for Black residents
- 5.5%Males
- 11.6%Females

- Year of entry for the foreign-born population in Dillwyn, Virginia
- 02010 or later
- 02000 to 2009
- 111990 to 1999
- 31980 to 1989
- 01970 to 1979
- 0Before 1970

First ancestries reported:
- English: 50 (17.5%)
- American: 21 (7.3%)
- German: 16 (5.6%)
- Irish: 12 (4.2%)
- African: 11 (3.8%)
- Italian: 10 (3.5%)
- Portuguese: 4 (1.4%)
- Scandinavian: 3 (1.0%)
Most common places of birth for foreign-born residents (%):
| Dillwyn: | 64.7% (11) |
| Virginia: | 1.0% (10,734) |
| Dillwyn: | 23.5% (4) |
| Virginia: | 1.7% (18,227) |
Place of birth for U.S.-born residents:
- This state: 492
- Other state: 70
- Northeast: 30
- Midwest: 6
- South: 27
- West: 5
85.3% of Dillwyn residents lived in the same house 1 years ago.
Out of people who lived in different houses, 24.3% lived in this county.
Out of people who lived in different counties, 87.7% lived in Virginia.
| Dillwyn: | 85.3% |
| State average: | 86.6% |
Education attainment for males 25 years and older:
- No schooling: 1
- Nursery to 4th grade: 15
- 5th and 6th grade: 12
- 7th and 8th grade: 0
- 9th grade: 0
- 10th grade: 8
- 11th grade: 0
- 12th grade, no diploma: 0
- High school graduate (or equivalency): 85
- Less than 1 year of college: 32
- Some college more than 1 year, no degree: 14
- Associate degree: 16
- Bachelor's degree: 49
- Master's degree: 2
- Professional school degree: 0
- Doctorate degree: 0

Education attainment for females 25 years and older:
- No schooling: 0
- Nursery to 4th grade: 0
- 5th and 6th grade: 0
- 7th and 8th grade: 18
- 9th grade: 3
- 10th grade: 8
- 11th grade: 13
- 12th grade, no diploma: 3
- High school graduate (or equivalency): 66
- Less than 1 year of college: 4
- Some college more than 1 year, no degree: 38
- Associate degree: 24
- Bachelor's degree: 15
- Master's degree: 33
- Professional school degree: 3
- Doctorate degree: 0


Housing units in structures:
- One, detached: 210
- Two: 3
- 5 to 9: 20
- 20 to 49: 4
- Mobile homes: 20
Housing units lacking complete kitchen facilities in 2022: 3.9%
House/condo owner moved in on average 19 years ago
Renter moved in on average 7 years ago

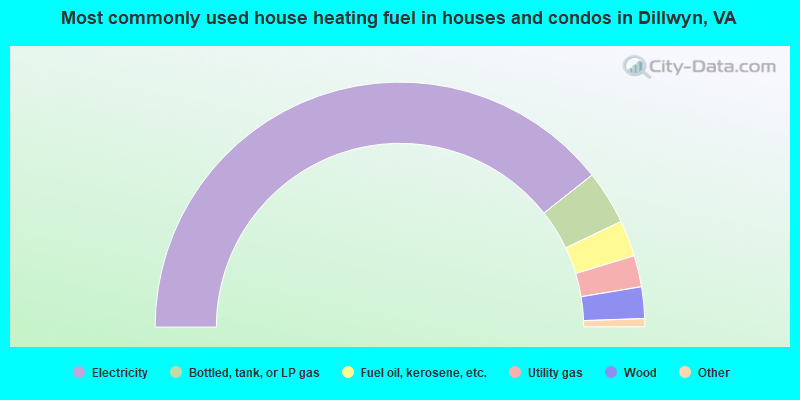
- 79.5%Electricity
- 7.2%Bottled, tank, or LP gas
- 4.8%Fuel oil, kerosene, etc.
- 4.2%Utility gas
- 4.2%Wood
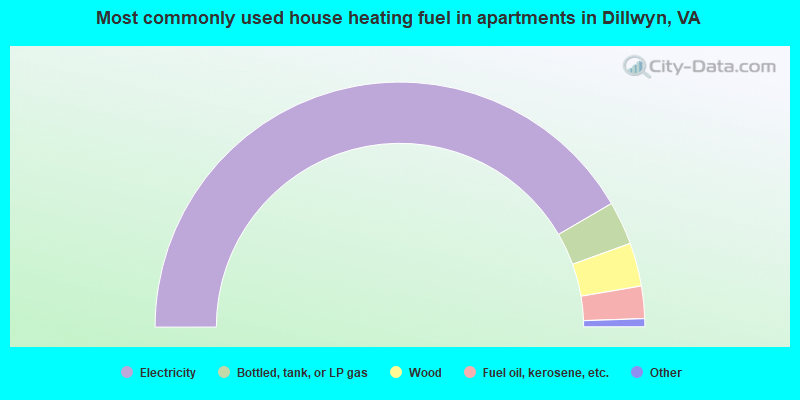
- 84.1%Electricity
- 5.8%Bottled, tank, or LP gas
- 5.8%Wood
- 4.3%Fuel oil, kerosene, etc.
Private vs. public school enrollment:
| Here: | 31.2% |
| Virginia: | 13.2% |
| Here: | 0.0% |
| Virginia: | 10.2% |
| Here: | 14.0% |
| Virginia: | 18.7% |


