Donovan, IL (Illinois) Houses and Residents
| Donovan: | $95,863 |
| Illinois: | $251,600 |
Mean price in 2022:
Detached houses: $144,959
Here: $144,959 State: $310,164
Total population: 300 (Urban population: 0, Rural population: 395 (4 farm, 391 nonfarm))
Houses: 102 (88 occupied: 65 owner occupied, 24 renter occupied)
| % of renters here: | 27% |
| State: | 33% |
Housing density: 328 houses/condos per square mile
Median price asked for vacant for-sale houses and condos in 2022: $147,059.
Median contract rent in 2022: $483
Median gross rent in Donovan, IL in 2022: $684
Housing units in Donovan with a mortgage: 44 (0 second mortgage, 0 home equity loan, 0 both second mortgage and home equity loan)
Houses without a mortgage: 0
Median household income for houses/condos with a mortgage: $45,510
Median household income for apartments without a mortgage: $42,631
Median monthly housing costs: $791
Compare current foreclosures near Donovan, IL:
| Photo | Address | Area | Beds / Baths | Price | Details |
|---|---|---|---|---|---|

|
#1
N Raub Ave
Donovan, IL 60931
|
2,012 sq. feet
|
2 baths 3 beds |
show details | |

|
#2
N 2nd St
Watseka, IL 60970
|
- sq. feet
|
2 baths 3 beds |
show details | |

|
#3
W Main St
Brook, IN 47922
|
1,512 sq. feet
|
1 baths 3 beds |
show details | |

|
#4
N Chicago St
Watseka, IL 60970
|
- sq. feet
|
- baths - beds |
$27,900
|
show details |

|
#5
W 800 S
Morocco, IN 47963
|
1,936 sq. feet
|
1 baths 5 beds |
show details | |

|
#6
S Clay St
Morocco, IN 47963
|
1,518 sq. feet
|
1 baths 3 beds |
show details | |

|
#7
W Beaver St
Morocco, IN 47963
|
938 sq. feet
|
1 baths 2 beds |
show details | |

|
#8
N 6th St
Kentland, IN 47951
|
1,389 sq. feet
|
1 baths 3 beds |
show details | |

|
#9
E Ray St
Kentland, IN 47951
|
1,996 sq. feet
|
1 baths 2 beds |
show details | |

|
#10
E Washington St
Morocco, IN 47963
|
1,148 sq. feet
|
1 baths - beds |
show details |
| Photo | Address | Area | Beds / Baths | Price | Details |
|---|---|---|---|---|---|

|
#11
S Main St
Morocco, IN 47963
|
1,960 sq. feet
|
3 baths - beds |
show details | |

|
#12
S 11000e Rd
Pembroke Township, IL 60958
|
- sq. feet
|
- baths - beds |
show details | |

|
#13
N La Rocque River Dr
Clifton, IL 60927
|
- sq. feet
|
- baths - beds |
show details | |

|
#14
S Western Ave
Watseka, IL 60970
|
- sq. feet
|
- baths - beds |
show details | |

|
#15
Yount Ave
Watseka, IL 60970
|
- sq. feet
|
- baths - beds |
show details | |

|
#16
Donovan St
Beaverville, IL 60912
|
- sq. feet
|
- baths - beds |
show details | |

|
#17
E Mulberry St
Watseka, IL 60970
|
- sq. feet
|
- baths - beds |
show details | |

|
#18
Orchard St
Morocco, IN 47963
|
- sq. feet
|
- baths - beds |
show details | |

|
#19
N Main St
Morocco, IN 47963
|
- sq. feet
|
- baths - beds |
show details | |

|
#20
S Lincoln St
Morocco, IN 47963
|
- sq. feet
|
- baths - beds |
show details |
| Photo | Address | Area | Beds / Baths | Price | Details |
|---|---|---|---|---|---|

|
#21
E 7000s Rd
Pembroke Township, IL 60958
|
- sq. feet
|
- baths - beds |
show details | |

|
#22
W Station St
Saint Anne, IL 60964
|
- sq. feet
|
- baths - beds |
show details | |

|
#23
N Wabash St
Watseka, IL 60970
|
- sq. feet
|
- baths - beds |
show details | |

|
#24
E 5000s Rd
Pembroke Township, IL 60958
|
- sq. feet
|
- baths - beds |
show details | |

|
#25
S 13000e Rd
Pembroke Township, IL 60958
|
- sq. feet
|
- baths - beds |
show details | |

|
#26
W Main St
Brook, IN 47922
|
- sq. feet
|
- baths - beds |
show details | |

|
#27
W Sell St
Brook, IN 47922
|
- sq. feet
|
- baths - beds |
show details | |

|
#28
N Boughton St
Watseka, IL 60970
|
- sq. feet
|
- baths - beds |
show details | |

|
#29
S Wayne Ave
Saint Anne, IL 60964
|
- sq. feet
|
- baths - beds |
show details | |

|
#30
E 3300 North Rd
Chebanse, IL 60922
|
- sq. feet
|
- baths - beds |
show details |
| Photo | Address | Area | Beds / Baths | Price | Details |
|---|---|---|---|---|---|

|
#31
S Route 45 52
Chebanse, IL 60922
|
- sq. feet
|
- baths - beds |
show details | |

|
Check over 1 million property listings on Foreclosure.com!
|
browse all offers | |||

Latest news about housing in Donovan, IL collected exclusively by city-data.com from local newspapers, TV, and radio stations

 | A lot of Bridgeport Single Family Homes being built this summer (96 replies) |
| East Garfield Park: Is it Worth the Risk? (298 replies) |
| Good area for my family. I have to live in city limits due to job. (40 replies) |
| Bridgeport? (44 replies) |
| "Sundown Towns" - Racial Exclusivity in the mid-20th century (45 replies) |
| What is your favorite neighborhood Chicago park? (19 replies) |

Median year apartment built: 1965
Household type by relationship:
Households: 299- Male householders: 50 (13 living alone), Female householders: 36 (6 living alone)
45 spouses (45 opposite-sex spouses), 32 unmarried partners, (32 opposite-sex unmarried partners), 100 children (72 natural, 0 adopted, 27 stepchildren), 0 grandchildren, 0 brothers or sisters, 10 parents, 0 foster children, 3 other relatives, 19 non-relatives
Size of family households: 21 2-persons, 9 3-persons, 15 4-persons, 6 5-persons, 2 7-or-more-persons.
Size of nonfamily households: 21 1-person, 4 2-persons, 5 3-persons, 4 4-persons.
51 married couples with children.
22 single-parent households (8 men, 14 women).
93.9% of residents of Donovan speak English at home.
5.0% of residents speak Spanish at home (100% speak English very well).
Foreign born population: 2 (0.7%)
(100.0% of them are naturalized citizens)
| Here: | 7.3 |
| State: | 6.4 |
| Here: | 5.1 |
| State: | 4.1 |

- Bedrooms in owner-occupied houses and condos in Donovan, Illinois
- 0no bedroom
- 21 bedroom
- 62 bedrooms
- 383 bedrooms
- 194 bedrooms
- 05+ bedrooms

- Bedrooms in renter-occupied apartments in Donovan, Illinois
- 0no bedroom
- 51 bedroom
- 42 bedrooms
- 143 bedrooms
- 14 bedrooms
- 05+ bedrooms

- Cars and other vehicles available in Donovan in owner-occupied houses/condos
- 5no vehicle
- 171 vehicle
- 242 vehicles
- 153 vehicles
- 04 vehicles
- 35+ vehicles

- Cars and other vehicles available in Donovan in renter-occupied apartments
- 0no vehicle
- 81 vehicle
- 162 vehicles
- 03 vehicles
- 04 vehicles
- 05+ vehicles

- Rooms in owner-occupied houses in Donovan, Illinois
- 01 room
- 22 rooms
- 13 rooms
- 04 rooms
- 35 rooms
- 126 rooms
- 187 rooms
- 118 rooms
- 179+ rooms

- Rooms in renter-occupied apartments in Donovan, Illinois
- 01 room
- 02 rooms
- 43 rooms
- 04 rooms
- 125 rooms
- 26 rooms
- 07 rooms
- 68 rooms
- 09+ rooms


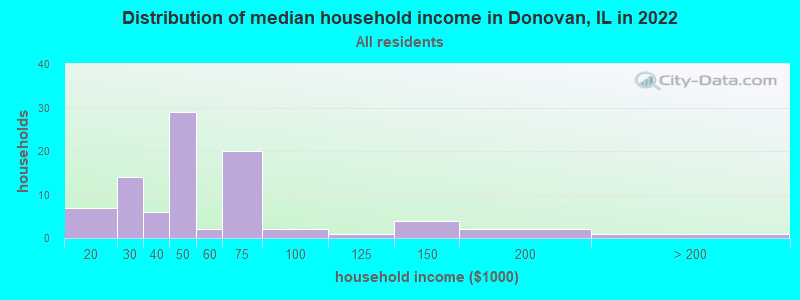
Donovan, IL household income distribution

- 7$10,000 to $19,999
- 14$20,000 to $29,999
- 6$30,000 to $39,999
- 29$40,000 to $49,999
- 2$50,000 to $59,999
- 20$60,000 to $74,999
- 2$75,000 to $99,999
- 1$100,000 to $124,999
- 4$125,000 to $149,999
- 2$150,000 to $199,999
- 1$200,000 or more
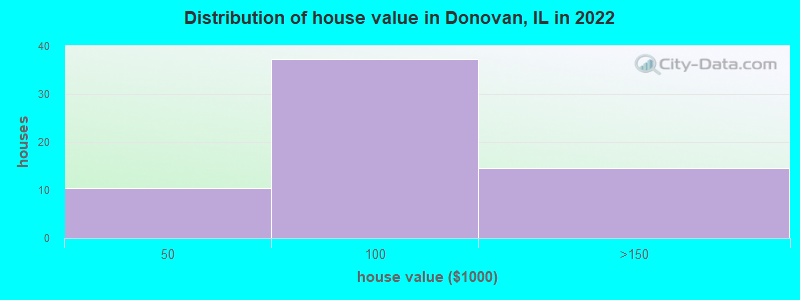
Home value of owner - occupied houses in 2022 in Donovan, IL
-
- 2Less than $10,000
- 2$20,000 to $24,999
- 2$30,000 to $34,999
- 2$40,000 to $49,999
- 4$50,000 to $59,999
- 2$60,000 to $69,999
- 3$70,000 to $79,999
- 10$80,000 to $89,999
- 14$90,000 to $99,999
- 14$100,000 to $124,999
Rent paid by renters in 2022 in Donovan, IL
-
- 6$250 to $299
- 1$400 to $449
- 3$450 to $499
- 1$550 to $599
- 4$650 to $699
- 3$700 to $749
- 2No cash rent


Percentage of workers working in this county: 48.8%
Number of people working at home: 2 (1.7% of all workers)
Travel time to work (commute)
- Less than 5 minutes: 6
- 5 to 9 minutes: 8
- 10 to 14 minutes: 0
- 15 to 19 minutes: 9
- 20 to 24 minutes: 18
- 25 to 29 minutes: 8
- 30 to 34 minutes: 7
- 35 to 39 minutes: 0
- 40 to 44 minutes: 3
- 45 to 59 minutes: 12
- 60 to 89 minutes: 18
- 90 or more minutes: 15
Means of transportation to work:
- Drove a car alone: 113 (72.9%)
- Carpooled: 23 (14.8%)
- Walked: 5 (3.2%)
- Other means: 6 (3.9%)
- Worked at home: 8 (5.2%)

- Unemployment by race in 2022
- Unemployment rate for White non-Hispanic residents
- 21.5%Males
- Unemployment rate for two or more race residents
- 21.3%Females
- Unemployment rate for Hispanic or Latino residents
- 100.0%Males

First ancestries reported:
- American: 36 (30.8%)
- French: 10 (8.6%)
- German: 10 (8.6%)
- Irish: 8 (6.8%)
- English: 3 (2.6%)
- Scandinavian: 3 (2.6%)
- European: 2 (1.7%)
- French Canadian: 2 (1.7%)
- Scottish: 1 (0.9%)
Most common places of birth for foreign-born residents (%):
| Donovan: | 50.0% (1) |
| Illinois: | 0.1% (2,458) |
Place of birth for U.S.-born residents:
- This state: 252
- Other state: 43
- Northeast: 0
- Midwest: 11
- South: 15
- West: 17
95.3% of Donovan residents lived in the same house 1 years ago.
Out of people who lived in different houses, 50.0% lived in this county.
| Donovan: | 95.3% |
| State average: | 88.3% |
Education attainment for males 25 years and older:
- No schooling: 2
- Nursery to 4th grade: 0
- 5th and 6th grade: 0
- 7th and 8th grade: 0
- 9th grade: 0
- 10th grade: 0
- 11th grade: 0
- 12th grade, no diploma: 4
- High school graduate (or equivalency): 48
- Less than 1 year of college: 26
- Some college more than 1 year, no degree: 6
- Associate degree: 9
- Bachelor's degree: 6
- Master's degree: 1
- Professional school degree: 0
- Doctorate degree: 0

Education attainment for females 25 years and older:
- No schooling: 0
- Nursery to 4th grade: 0
- 5th and 6th grade: 0
- 7th and 8th grade: 0
- 9th grade: 0
- 10th grade: 9
- 11th grade: 1
- 12th grade, no diploma: 0
- High school graduate (or equivalency): 30
- Less than 1 year of college: 0
- Some college more than 1 year, no degree: 8
- Associate degree: 14
- Bachelor's degree: 7
- Master's degree: 2
- Professional school degree: 0
- Doctorate degree: 0


Housing units in structures:
- One, detached: 94
- Two: 1
- Mobile homes: 7
Housing units lacking complete kitchen facilities in 2022: 5.9%
House/condo owner moved in on average 11 years ago
Renter moved in on average 6 years ago

Private vs. public school enrollment:
| Here: | 9.8% |
| Illinois: | 13.3% |
| Here: | 46.2% |
| Illinois: | 9.9% |
| Here: | 0.0% |
| Illinois: | 27.4% |


