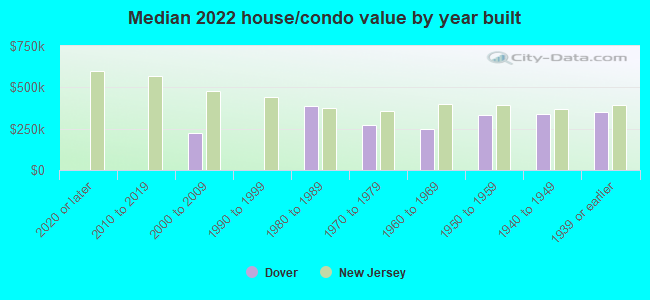
Dover, NJ (New Jersey) Houses and Residents
| Dover: | $325,719 |
| New Jersey: | $428,900 |
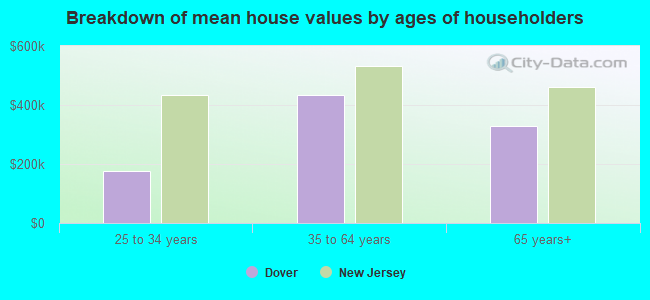
Mean price in 2022:
Detached houses: $418,330
Here: $418,330 State: $537,591 Townhouses or other attached units: $415,054
Here: $415,054 State: $381,113 In 2-unit structures: $334,232
Here: $334,232 State: $444,476 In 3-to-4-unit structures: $143,859
Here: $143,859 State: $457,463 In 5-or-more-unit structures: $269,268
Here: $269,268 State: $368,745
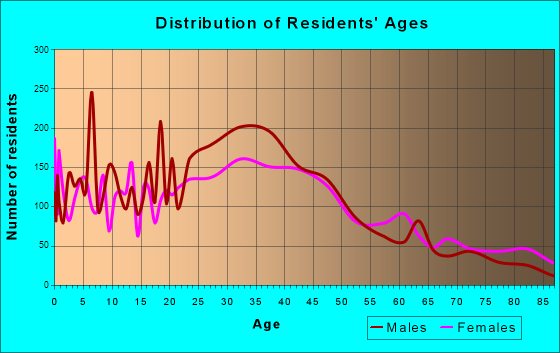
Total population: 18,313 (Urban population: 18,188, Rural population: 0)
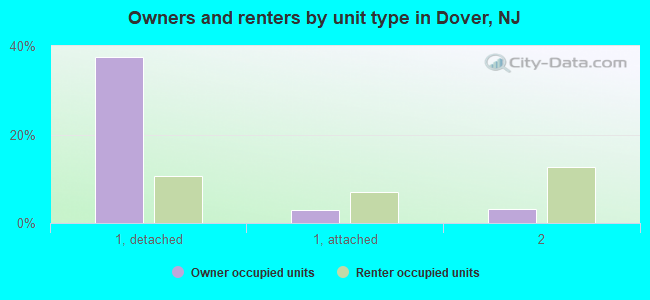
Houses: 6,425 (6,172 occupied: 2,784 owner occupied, 3,490 renter occupied)
| % of renters here: | 56% |
| State: | 35% |
Housing density: 2,398 houses/condos per square mile
Median price asked for vacant for-sale houses and condos in 2022: $220,013.
Median contract rent in 2022: $1,366 (lower quartile is $1,090, upper quartile is $1,685)
Median rent asked for vacant for-rent units in 2022: $1,246
Median gross rent in Dover, NJ in 2022: $1,652
Housing units in Dover with a mortgage: 1,887 (155 second mortgage, 0 home equity loan, 109 both second mortgage and home equity loan)
Houses without a mortgage: 64
Median household income for houses/condos with a mortgage: $100,098
Median household income for apartments without a mortgage: $85,955
Median monthly housing costs: $1,750
Compare current foreclosures in Dover, NJ:
| Photo | Address | Area | Beds / Baths | Price | Details |
|---|---|---|---|---|---|

|
#1
Victory Ct
Dover, NJ 07801
|
1,090 sq. feet
|
- baths - beds |
show details | |
|
|
#2
Christopher St
Dover, NJ 07801
|
954 sq. feet
|
- baths - beds |
show details | |

|
#3
Baker St
Dover, NJ 07801
|
2,110 sq. feet
|
- baths - beds |
show details | |

|
#4
Oak St
Dover, NJ 07801
|
- sq. feet
|
- baths - beds |
show details | |

|
#5
Audrey Pl
Dover, NJ 07801
|
1,428 sq. feet
|
- baths - beds |
show details | |

|
#6
Mount Hope Ave
Dover, NJ 07801
|
1,248 sq. feet
|
- baths - beds |
show details | |

|
#7
Summer Ave
Dover, NJ 07801
|
912 sq. feet
|
- baths - beds |
show details | |

|
#8
Washington Ave Apt G4
Dover, NJ 07801
|
- sq. feet
|
- baths - beds |
show details | |

|
#9
Debbie Pl
Dover, NJ 07801
|
2,008 sq. feet
|
- baths - beds |
show details | |

|
#10
Mount Pleasant Ave
Dover, NJ 07801
|
3,220 sq. feet
|
- baths - beds |
show details |
| Photo | Address | Area | Beds / Baths | Price | Details |
|---|---|---|---|---|---|

|
#11
Goodale Ave
Dover, NJ 07801
|
1,338 sq. feet
|
- baths - beds |
show details | |

|
#12
Brook Dr
Dover, NJ 07801
|
1,456 sq. feet
|
- baths - beds |
show details | |

|
#13
W Dickerson St # 443
Dover, NJ 07801
|
- sq. feet
|
- baths - beds |
show details | |

|
#14
Victory Ct
Dover, NJ 07801
|
1,090 sq. feet
|
- baths - beds |
show details | |

|
#15
E Cooper St
Dover, NJ 07801
|
1,906 sq. feet
|
- baths - beds |
show details | |

|
#16
Curtis St
Dover, NJ 07801
|
912 sq. feet
|
- baths - beds |
show details | |

|
#17
David St
Dover, NJ 07801
|
850 sq. feet
|
- baths - beds |
show details | |

|
#18
Van Nostrand Ave
Dover, NJ 07801
|
- sq. feet
|
- baths - beds |
show details | |

|
#19
W Munson Ave
Dover, NJ 07801
|
1,232 sq. feet
|
- baths - beds |
show details | |

|
#20
W Chrystal St
Dover, NJ 07801
|
1,447 sq. feet
|
- baths - beds |
show details |
| Photo | Address | Area | Beds / Baths | Price | Details |
|---|---|---|---|---|---|

|
#21
Randolph Ave
Dover, NJ 07801
|
2,013 sq. feet
|
- baths - beds |
show details | |

|
#22
S Salem St
Dover, NJ 07801
|
1,722 sq. feet
|
- baths - beds |
show details | |

|
#23
Summer Ave
Dover, NJ 07801
|
912 sq. feet
|
- baths - beds |
show details | |

|
#24
E Mcfarlan St
Dover, NJ 07801
|
1,339 sq. feet
|
- baths - beds |
show details | |

|
#25
Us Highway 46
Dover, NJ 07801
|
- sq. feet
|
- baths - beds |
show details | |

|
#26
Us Highway 46
Dover, NJ 07801
|
- sq. feet
|
- baths - beds |
show details | |

|
#27
Summer Ave
Dover, NJ 07801
|
912 sq. feet
|
- baths - beds |
show details | |

|
#28
Kearney St
Dover, NJ 07801
|
1,555 sq. feet
|
- baths - beds |
show details | |

|
#29
N Sussex St
Dover, NJ 07801
|
1,782 sq. feet
|
- baths - beds |
show details | |

|
#30
Schley St
Dover, NJ 07801
|
2,525 sq. feet
|
- baths - beds |
show details |
| Photo | Address | Area | Beds / Baths | Price | Details |
|---|---|---|---|---|---|

|
#31
Audrey Pl
Dover, NJ 07801
|
1,428 sq. feet
|
- baths - beds |
show details | |

|
#32
Berry St
Dover, NJ 07801
|
1,634 sq. feet
|
- baths - beds |
show details | |

|
#33
W Clinton St
Dover, NJ 07801
|
2,038 sq. feet
|
- baths - beds |
show details | |

|
#34
Brook Dr
Dover, NJ 07801
|
1,456 sq. feet
|
- baths - beds |
show details | |

|
#35
Trenton St
Dover, NJ 07801
|
1,632 sq. feet
|
- baths - beds |
show details | |

|
#36
Perry St
Dover, NJ 07801
|
1,520 sq. feet
|
- baths - beds |
show details | |

|
#37
E Fairview Ave
Dover, NJ 07801
|
2,347 sq. feet
|
- baths - beds |
show details | |

|
#38
Herrick Dr
Dover, NJ 07801
|
1,247 sq. feet
|
- baths - beds |
show details | |

|
#39
N Sussex St
Dover, NJ 07801
|
1,704 sq. feet
|
- baths - beds |
show details | |

|
#40
Perry St
Dover, NJ 07801
|
1,648 sq. feet
|
- baths - beds |
show details |
| Photo | Address | Area | Beds / Baths | Price | Details |
|---|---|---|---|---|---|

|
#41
Washington Ave
Dover, NJ 07801
|
- sq. feet
|
- baths - beds |
show details | |

|
#42
Liberty St
Dover, NJ 07801
|
1,227 sq. feet
|
- baths - beds |
show details | |

|
Check over 1 million property listings on Foreclosure.com!
|
browse all offers | |||

Latest news about housing in Dover, NJ collected exclusively by city-data.com from local newspapers, TV, and radio stations


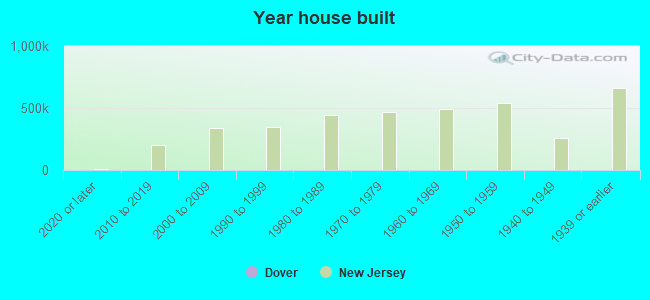
Median year apartment built: 1954
Household type by relationship:
Households: 18,510- Male householders: 2,912 (447 living alone), Female householders: 3,243 (1,002 living alone)
3,024 spouses (3,003 opposite-sex spouses), 550 unmarried partners, (550 opposite-sex unmarried partners), 6,222 children (5,833 natural, 102 adopted, 286 stepchildren), 139 grandchildren, 494 brothers or sisters, 283 parents, 56 foster children, 707 other relatives, 642 non-relatives
- In group quarters: 233
Size of family households: 1,190 2-persons, 1,055 3-persons, 801 4-persons, 1,204 5-persons, 115 6-persons, 190 7-or-more-persons.
Size of nonfamily households: 1,401 1-person, 235 2-persons, 4 4-persons.
2,662 married couples with children.
758 single-parent households (160 men, 598 women).
22.5% of residents of Dover speak English at home.
71.9% of residents speak Spanish at home (46% speak English very well, 20% speak English well, 20% speak English not well, 14% don't speak English at all).
2.6% of residents speak other Indo-European language at home (64% speak English very well, 18% speak English well, 17% speak English not well, 1% don't speak English at all).
1.3% of residents speak Asian or Pacific Island language at home (36% speak English very well, 33% speak English well, 31% speak English not well).
0.6% of residents speak other language at home (34% speak English very well, 66% speak English well).
Foreign born population: 9,048 (48.9%)
(39.4% of them are naturalized citizens)
| Here: | 6.0 |
| State: | 6.8 |
| Here: | 4.0 |
| State: | 3.9 |
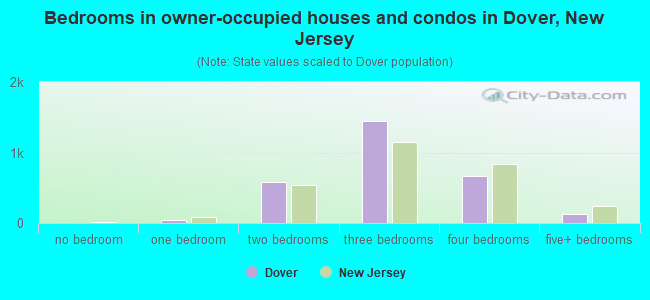
- Bedrooms in owner-occupied houses and condos in Dover, New Jersey
- 0no bedroom
- 301 bedroom
- 6232 bedrooms
- 1,3603 bedrooms
- 6604 bedrooms
- 1125+ bedrooms
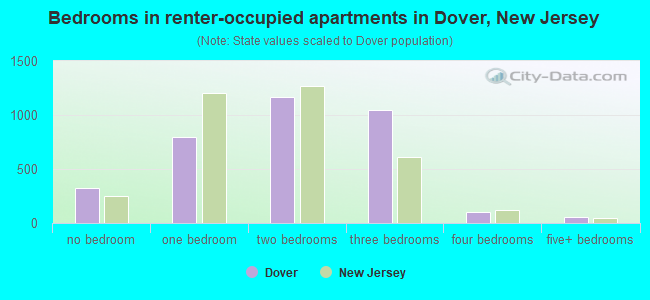
- Bedrooms in renter-occupied apartments in Dover, New Jersey
- 327no bedroom
- 7951 bedroom
- 1,1672 bedrooms
- 1,0433 bedrooms
- 1044 bedrooms
- 545+ bedrooms
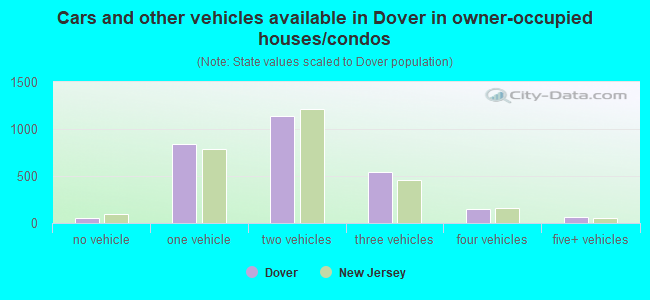
- Cars and other vehicles available in Dover in owner-occupied houses/condos
- 50no vehicle
- 8431 vehicle
- 1,1332 vehicles
- 5453 vehicles
- 1494 vehicles
- 635+ vehicles
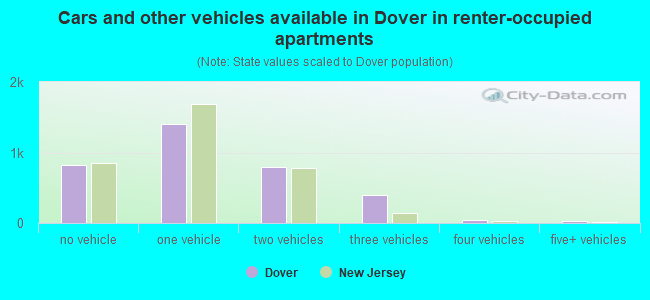
- Cars and other vehicles available in Dover in renter-occupied apartments
- 817no vehicle
- 1,4071 vehicle
- 7962 vehicles
- 3943 vehicles
- 474 vehicles
- 305+ vehicles
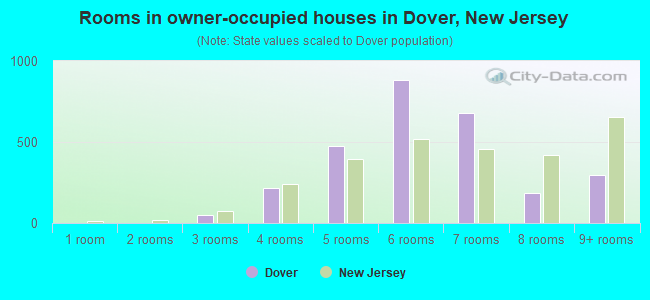
- Rooms in owner-occupied houses in Dover, New Jersey
- 01 room
- 02 rooms
- 473 rooms
- 2154 rooms
- 4785 rooms
- 8836 rooms
- 6807 rooms
- 1838 rooms
- 2989+ rooms
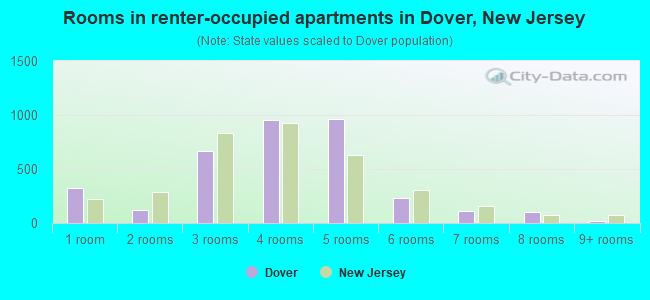
- Rooms in renter-occupied apartments in Dover, New Jersey
- 3271 room
- 1172 rooms
- 6673 rooms
- 9534 rooms
- 9655 rooms
- 2326 rooms
- 1117 rooms
- 1028 rooms
- 179+ rooms
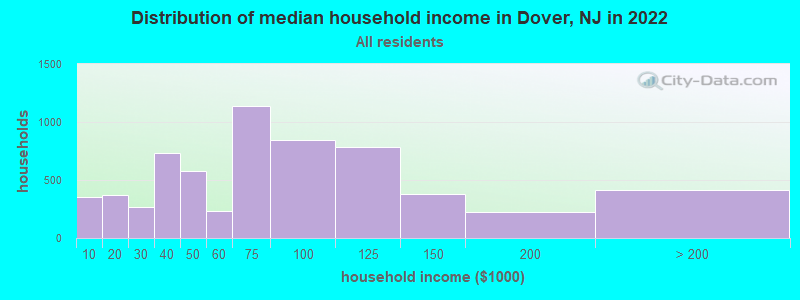
Dover, NJ household income distribution

- 354Less than $10,000
- 370$10,000 to $19,999
- 269$20,000 to $29,999
- 734$30,000 to $39,999
- 575$40,000 to $49,999
- 232$50,000 to $59,999
- 1,139$60,000 to $74,999
- 842$75,000 to $99,999
- 788$100,000 to $124,999
- 380$125,000 to $149,999
- 220$150,000 to $199,999
- 418$200,000 or more
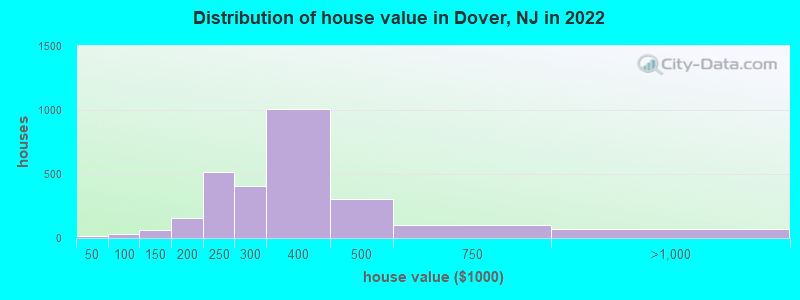
Home value of owner - occupied houses in 2022 in Dover, NJ
-
- 17$40,000 to $49,999
- 10$50,000 to $59,999
- 32$100,000 to $124,999
- 29$125,000 to $149,999
- 56$150,000 to $174,999
- 102$175,000 to $199,999
- 517$200,000 to $249,999
- 403$250,000 to $299,999
- 1,007$300,000 to $399,999
- 306$400,000 to $499,999
- 102$500,000 to $749,999
- 70$750,000 to $999,999
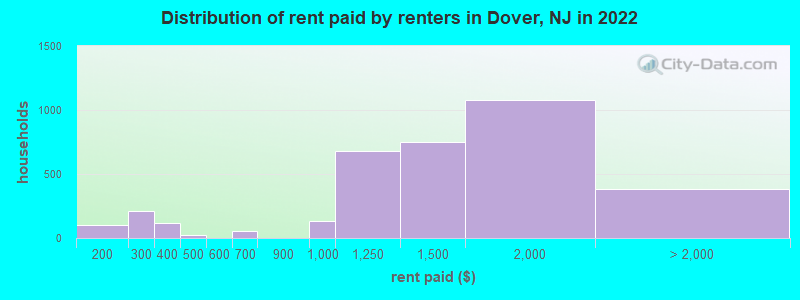
Rent paid by renters in 2022 in Dover, NJ
-
- 39$100 to $149
- 58$150 to $199
- 124$200 to $249
- 84$250 to $299
- 20$300 to $349
- 99$350 to $399
- 15$400 to $449
- 5$450 to $499
- 34$600 to $649
- 18$650 to $699
- 131$900 to $999
- 680$1,000 to $1,249
- 750$1,250 to $1,499
- 1,080$1,500 to $1,999
- 254$2,000 to $2,499
- 60$2,500 to $2,999
- 42$3,000 to $3,499
- 3$3,500 or more
- 18No cash rent
Percentage of workers working in this county: 86.1%
Number of people working at home: 537 (5.4% of all workers)
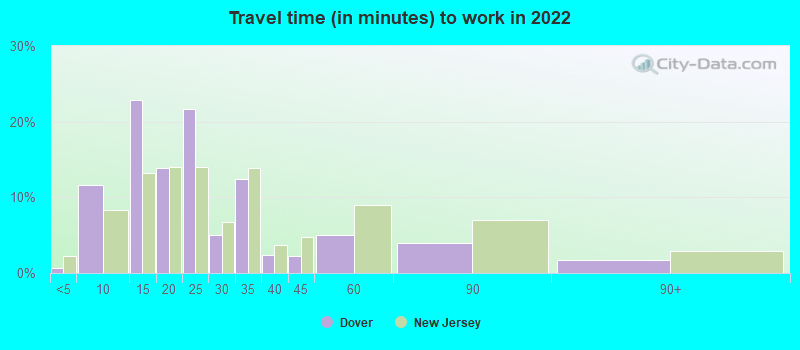
Travel time to work (commute)
- Less than 5 minutes: 107
- 5 to 9 minutes: 951
- 10 to 14 minutes: 1,788
- 15 to 19 minutes: 964
- 20 to 24 minutes: 1,449
- 25 to 29 minutes: 680
- 30 to 34 minutes: 1,192
- 35 to 39 minutes: 354
- 40 to 44 minutes: 211
- 45 to 59 minutes: 467
- 60 to 89 minutes: 426
- 90 or more minutes: 380
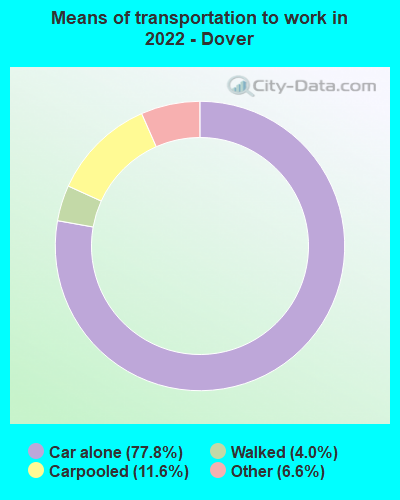
Means of transportation to work:
- Drove a car alone: 5,318 (68.1%)
- Carpooled: 805 (10.3%)
- Taxi: 572 (7.3%)
- Walked: 372 (4.8%)
- Worked at home: 537 (6.9%)
- Unemployment by race in 2022
- Unemployment rate for White non-Hispanic residents
- 1.4%Males
- Unemployment rate for Black residents
- 3.5%Males
- Unemployment rate for other race residents
- 13.7%Males
- 10.7%Females
- Unemployment rate for two or more race residents
- 1.4%Males
- Unemployment rate for Hispanic or Latino residents
- 7.1%Males
- 4.6%Females
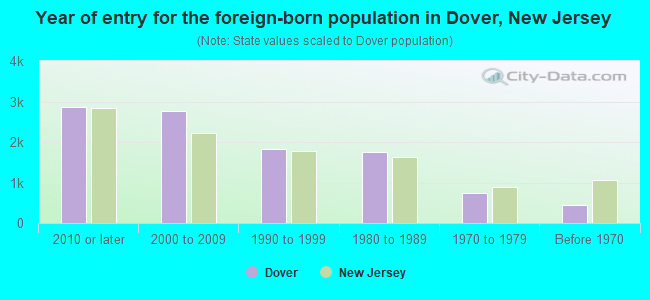
- Year of entry for the foreign-born population in Dover, New Jersey
- 2,8612010 or later
- 2,7712000 to 2009
- 1,8311990 to 1999
- 1,7431980 to 1989
- 7481970 to 1979
- 455Before 1970
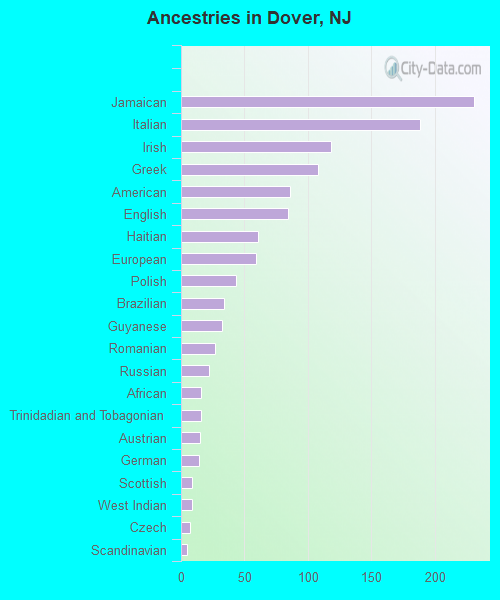
First ancestries reported:
- Jamaican: 231 (1.7%)
- Italian: 188 (1.4%)
- Irish: 118 (0.9%)
- Greek: 108 (0.8%)
- American: 86 (0.6%)
- English: 84 (0.6%)
- Haitian: 61 (0.5%)
- European: 59 (0.4%)
- Polish: 43 (0.3%)
- Brazilian: 34 (0.3%)
- Guyanese: 32 (0.2%)
- Romanian: 27 (0.2%)
- Russian: 22 (0.2%)
- African: 16 (0.1%)
- Trinidadian and Tobagonian: 16 (0.1%)
- Austrian: 15 (0.1%)
- German: 14 (0.1%)
- Scottish: 9 (0.07%)
- West Indian: 9 (0.07%)
- Czech: 7 (0.05%)
- Scandinavian: 5 (0.04%)
Most common places of birth for foreign-born residents (%):
| Dover: | 23.3% (2,187) |
| New Jersey: | 4.2% (90,817) |
| Dover: | 23.0% (2,157) |
| New Jersey: | 4.8% (102,527) |
| Dover: | 13.5% (1,269) |
| New Jersey: | 1.7% (37,335) |
| Dover: | 9.2% (860) |
| New Jersey: | 4.4% (95,275) |
| Dover: | 6.5% (610) |
| New Jersey: | 2.7% (58,563) |
| Dover: | 5.3% (501) |
| New Jersey: | 9.7% (209,055) |
| Dover: | 3.5% (325) |
| New Jersey: | 0.3% (5,500) |
| Dover: | 2.5% (236) |
| New Jersey: | 2.2% (47,365) |
| Dover: | 2.3% (217) |
| New Jersey: | 0.3% (6,972) |
| Dover: | 1.9% (181) |
| New Jersey: | 2.3% (48,885) |
| Dover: | 1.5% (144) |
| New Jersey: | 0.7% (14,848) |
Place of birth for U.S.-born residents:
- This state: 6,370
- Other state: 1,567
- Northeast: 1,079
- Midwest: 97
- South: 219
- West: 169
86.7% of Dover residents lived in the same house 1 years ago.
Out of people who lived in different houses, 44.1% lived in this county.
Out of people who lived in different counties, 62.1% lived in New Jersey.
| Dover: | 86.7% |
| State average: | 90.4% |
Education attainment for males 25 years and older:
- No schooling: 214
- Nursery to 4th grade: 100
- 5th and 6th grade: 133
- 7th and 8th grade: 364
- 9th grade: 411
- 10th grade: 232
- 11th grade: 8
- 12th grade, no diploma: 185
- High school graduate (or equivalency): 2,136
- Less than 1 year of college: 513
- Some college more than 1 year, no degree: 800
- Associate degree: 474
- Bachelor's degree: 694
- Master's degree: 73
- Professional school degree: 44
- Doctorate degree: 18

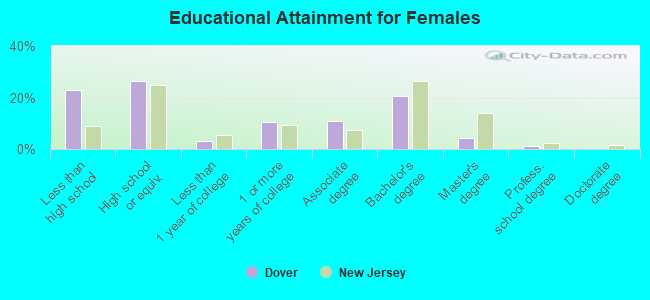
Education attainment for females 25 years and older:
- No schooling: 435
- Nursery to 4th grade: 26
- 5th and 6th grade: 201
- 7th and 8th grade: 191
- 9th grade: 74
- 10th grade: 227
- 11th grade: 66
- 12th grade, no diploma: 156
- High school graduate (or equivalency): 1,572
- Less than 1 year of college: 186
- Some college more than 1 year, no degree: 633
- Associate degree: 638
- Bachelor's degree: 1,220
- Master's degree: 265
- Professional school degree: 79
- Doctorate degree: 2
Housing units in structures:
- One, detached: 2,942
- One, attached: 737
- Two: 1,125
- 3 or 4: 503
- 5 to 9: 408
- 10 to 19: 116
- 20 to 49: 128
- 50 or more: 462
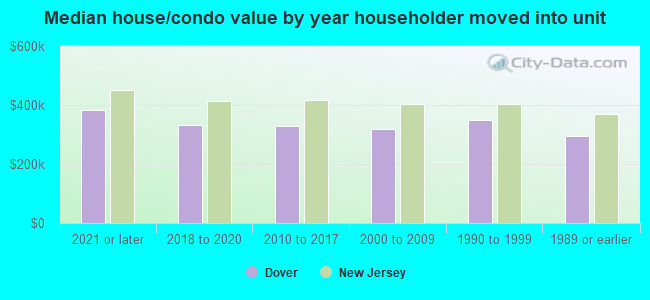
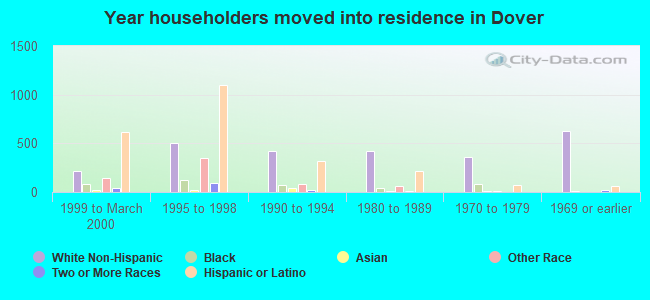
House/condo owner moved in on average 17 years ago
Renter moved in on average 5 years ago
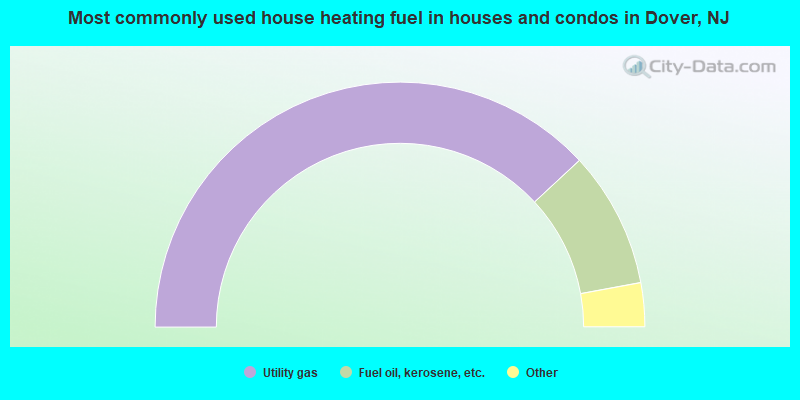
- 76.2%Utility gas
- 18.0%Fuel oil, kerosene, etc.
- 3.7%Electricity
- 1.3%Bottled, tank, or LP gas
- 0.8%Solar energy
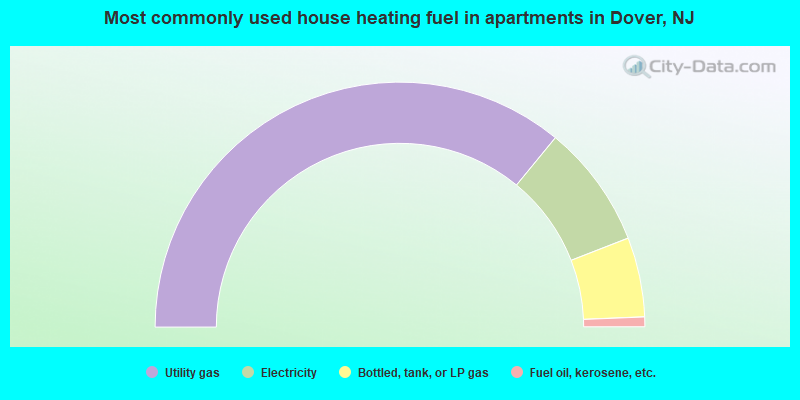
- 71.9%Utility gas
- 16.3%Electricity
- 10.5%Bottled, tank, or LP gas
- 1.3%Fuel oil, kerosene, etc.
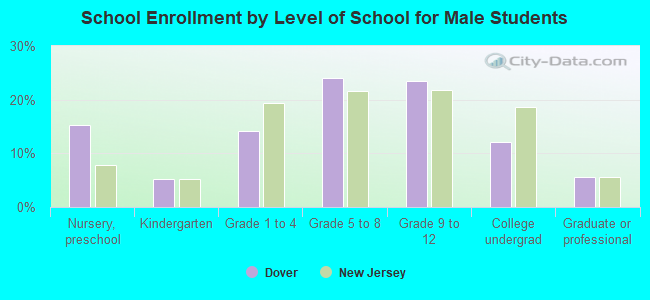
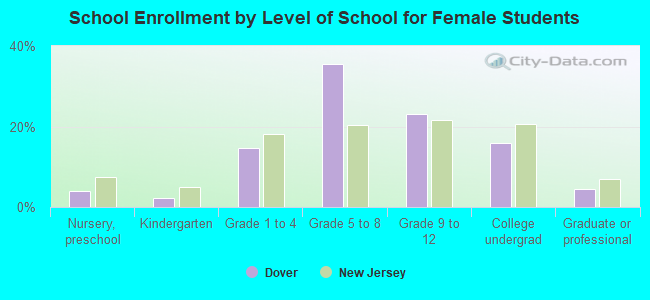
Private vs. public school enrollment:
| Here: | 0.8% |
| New Jersey: | 12.3% |
| Here: | 0.0% |
| New Jersey: | 13.1% |
| Here: | 16.3% |
| New Jersey: | 33.2% |