Draper, UT (Utah) Houses and Residents
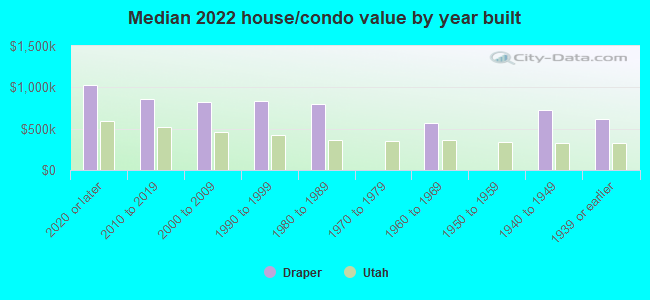
Estimated median house or condo value in 2022: $807,107 (it was $241,600 in 2000 )
Draper:
$807,107Utah:
$499,500
Lower value quartile - upper value quartile: $595,705 - $1,048,378Total population: 46,202 (Urban population: 23,646, Rural population: 1,790 (all nonfarm) )
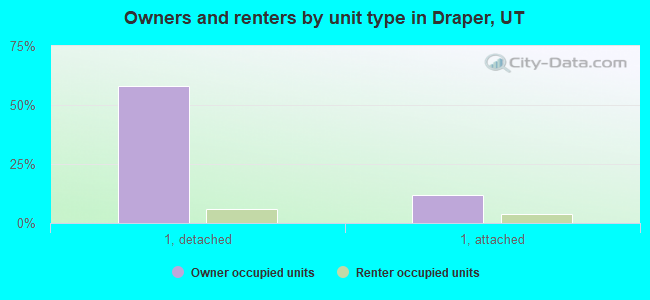
Houses: 17,017 (16,609 occupied: 12,058 owner occupied, 4,449 renter occupied )
% of renters here:
27%State:
29%
Housing density: 561 houses/condos per square mile
Median price asked for vacant for-sale houses and condos in 2022: $1,007,930.
Median contract rent in 2022: $1,611 (lower quartile is $1,360, upper quartile is over $2,000)
Median rent asked for vacant for-rent units in 2022: $1,816
Median gross rent in Draper, UT in 2022: $1,792
Housing units in Draper with a mortgage: 9,030 (1,628 second mortgage, 54 home equity loan, 1,453 both second mortgage and home equity loan )Houses without a mortgage: 587
Median household income for houses/condos with a mortgage: $173,528
Median household income for apartments without a mortgage: $112,215
Median monthly housing costs: $1,928
Data:
Median house or condo value ($)
Median house or condo value ($ change since 2000)
Median house or condo value ($) - White
Median house or condo value ($) - Black or African American
Median house or condo value ($) - Asian
Median house or condo value ($) - Hispanic or Latino
Median house or condo value ($) - American Indian and Alaska Native
Median house or condo value ($) - Multirace
Median house or condo value ($) - Other Race
Median price asked for mobile homes ($)
Household density (households per square mile)
Mean house or condo value by units in structure - 1, detached ($)
Mean house or condo value by units in structure - 1, attached ($)
Mean house or condo value by units in structure - 2 ($)
Mean house or condo value by units in structure by units in structure - 3 or 4 ($)
Mean house or condo value by units in structure - 5 or more ($)
Mean house or condo value by units in structure - Boat, RV, van, etc. ($)
Mean house or condo value by units in structure - Mobile home ($)
Median contract rent ($)
Median contract rent - Lower quartile ($)
Median contract rent - Upper quartile ($)
Median gross rent ($)
Urban houses (%)
Rural houses (%)
Houses occupied (%)
Houses occupied (% change since 2000)
Houses owner occupied (%)
Houses owner occupied (% change since 2000)
Houses renter occupied (%)
Houses renter occupied (% change since 2000)
Vacant housing units - For rent (%)
Vacant housing units - For rent (% change since 2000)
Vacant housing units - For sale only (%)
Vacant housing units - For sale only (% change since 2000)
Vacant housing units - Rented or sold, not occupied (%)
Vacant housing units - Rented or sold, not occupied (% change since 2000)
Vacant housing units - For seasonal, recreational, or occasional use (%)
Vacant housing units - For seasonal, recreational, or occasional use (% change since 2000)
Vacant housing units - For migrant workers (%)
Vacant housing units - For migrant workers (% change since 2000)
Vacant housing units - Other vacant (%)
Vacant housing units - Other vacant (% change since 2000)
Median monthly housing costs ($)
Median household income for houses/condos with a mortgage ($)
Median household income for houses/condos without a mortgage ($)
Median household income ($)
Median household income ($) - White
Median household income ($) - Black or African American
Median household income ($) - Asian
Median household income ($) - Hispanic or Latino
Median household income ($) - American Indian and Alaska Native
Median household income ($) - Multirace
Median household income ($) - Other Race
Mortgage status - with mortgage (%)
Mortgage status - with second mortgage (%)
Mortgage status - with home equity loan (%)
Mortgage status - with both second mortgage and home equity loan (%)
Mortgage status - without a mortgage (%)
Median year house/condo built
Median year apartment built
Household type by relationship - Male householder living alone (%)
Household type by relationship - Male householder not living alone (%)
Household type by relationship - Female householder living alone (%)
Household type by relationship - Female householder not living alone (%)
Household type by relationship - Opposite-Sex spouse (%)
Household type by relationship - Same-Sex spouse (%)
Household type by relationship - Opposite-Sex unmarried partner (%)
Household type by relationship - Same-Sex unmarried partner (%)
Household type by relationship - In group quarters (%)
Size of family households - 2-person household (%)
Size of family households - 3-person household (%)
Size of family households - 4-person household (%)
Size of family households - 5-person household (%)
Size of family households - 6-person household (%)
Size of family households - 7-or-more-person household (%)
Size of nonfamily households - 1-person household (%)
Size of nonfamily households - 2-person household (%)
Size of nonfamily households - 3-person household (%)
Size of nonfamily households - 4-person household (%)
Size of nonfamily households - 5-person household (%)
Size of nonfamily households - 6-person household (%)
Size of nonfamily households - 7-or-moreperson household (%)
Year house built - Built 2010 or later (%)
Year house built - Built 2000 to 2009 (%)
Year house built - Built 1990 to 1999 (%)
Year house built - Built 1980 to 1989 (%)
Year house built - Built 1970 to 1979 (%)
Year house built - Built 1960 to 1969 (%)
Year house built - Built 1950 to 1959 (%)
Year house built - Built 1940 to 1949 (%)
Year house built - Built 1939 or earlier (%)
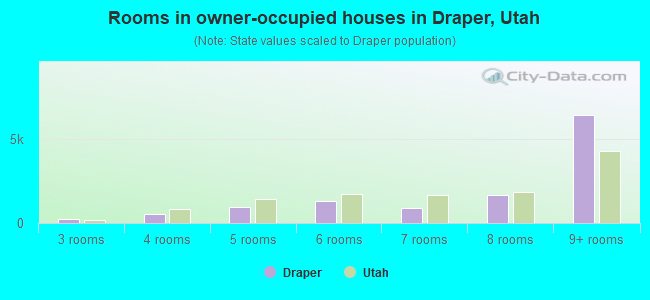
Median number of rooms in houses and condos
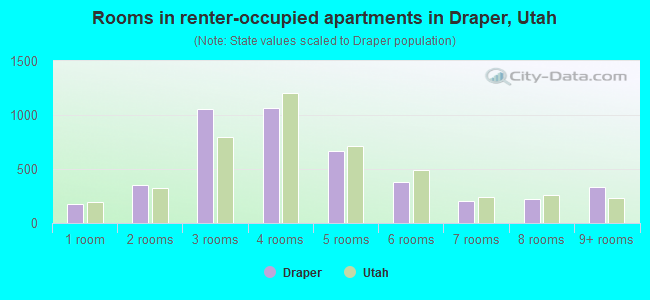
Median number of rooms in apartments
Median number of bedrooms in owner occupied houses
Mean number of bedrooms in owner occupied houses
Median number of bedrooms in renter occupied houses
Mean number of bedrooms in renter occupied houses
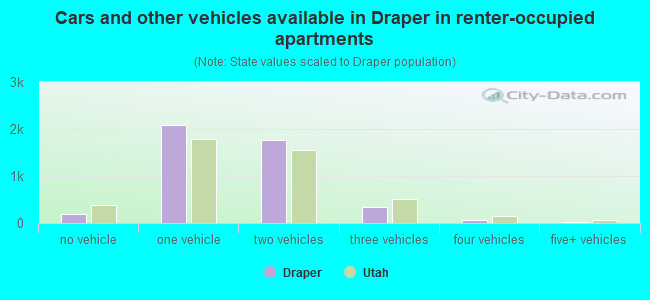
Median number of vehichles in owner occupied houses
Mean number of vehichles in owner occupied houses
Median number of vehichles in renter occupied houses
Mean number of vehichles in renter occupied houses
Rooms in owner-occupied houses - 1 room (%)
Rooms in owner-occupied houses - 2 rooms (%)
Rooms in owner-occupied houses - 3 rooms (%)
Rooms in owner-occupied houses - 4 rooms (%)
Rooms in owner-occupied houses - 5 rooms (%)
Rooms in owner-occupied houses - 6 rooms (%)
Rooms in owner-occupied houses - 7 rooms (%)
Rooms in owner-occupied houses - 8 rooms (%)
Rooms in owner-occupied houses - 9+ rooms (%)
Rooms in renter-occupied houses - 1 room (%)
Rooms in renter-occupied houses - 2 rooms (%)
Rooms in renter-occupied houses - 3 rooms (%)
Rooms in renter-occupied houses - 4 rooms (%)
Rooms in renter-occupied houses - 5 rooms (%)
Rooms in renter-occupied houses - 6 rooms (%)
Rooms in renter-occupied houses - 7 rooms (%)
Rooms in renter-occupied houses - 8 rooms (%)
Rooms in renter-occupied houses - 9+ rooms (%)
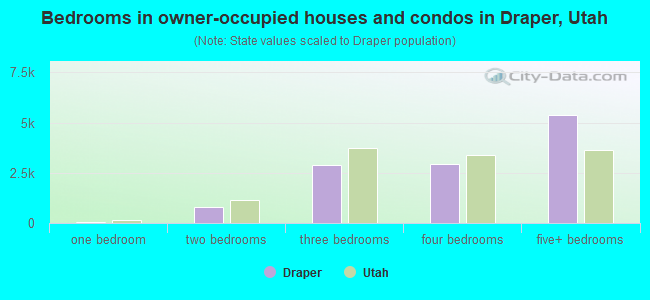
Bedrooms in owner-occupied houses - no bedrooms (%)
Bedrooms in owner-occupied houses - 1 bedroom (%)
Bedrooms in owner-occupied houses - 2 bedrooms (%)
Bedrooms in owner-occupied houses - 3 bedrooms (%)
Bedrooms in owner-occupied houses - 4 bedrooms (%)
Bedrooms in owner-occupied houses - 5+ bedrooms (%)
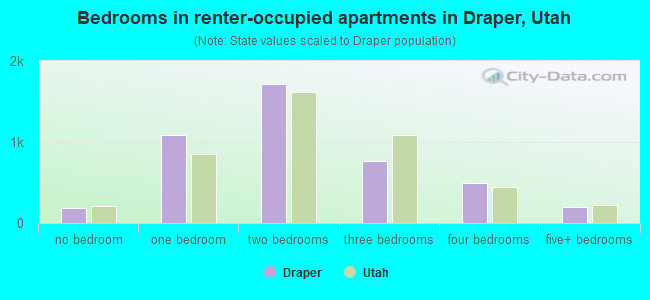
Bedrooms in renter-occupied houses - no bedrooms (%)
Bedrooms in renter-occupied houses - 1 bedroom (%)
Bedrooms in renter-occupied houses - 2 bedrooms (%)
Bedrooms in renter-occupied houses - 3 bedrooms (%)
Bedrooms in renter-occupied houses - 4 bedrooms (%)
Bedrooms in renter-occupied houses - 5+ bedrooms (%)
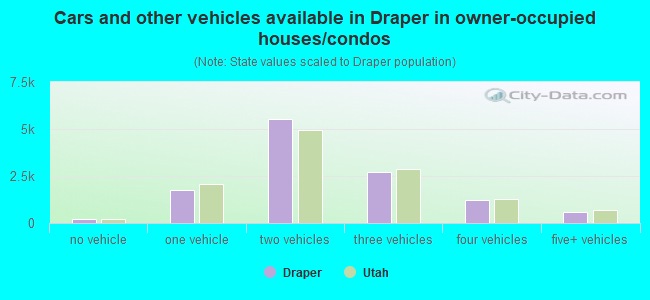
Vehicles available in owner-occupied houses - no vehicle available (%)
Vehicles available in owner-occupied houses - 1 vehicle available(%)
Vehicles available in owner-occupied houses - 2 Vehicles available (%)
Vehicles available in owner-occupied houses - 3 Vehicles available (%)
Vehicles available in owner-occupied houses - 4 Vehicles available (%)
Vehicles available in owner-occupied houses - 5+ Vehicles available (%)
Vehicles available in renter-occupied houses - no vehicle available (%)
Vehicles available in renter-occupied houses - 1 vehicle available (%)
Vehicles available in renter-occupied houses - 2 Vehicles available (%)
Vehicles available in renter-occupied houses - 3 Vehicles available (%)
Vehicles available in renter-occupied houses - 4 Vehicles available (%)
Vehicles available in renter-occupied houses - 5+ Vehicles available (%)
Housing units in structures - 1, detached (%)
Housing units in structures - 1, attached (%)
Housing units in structures - 2 (%)
Housing units in structures - 3 or 4 (%)
Housing units in structures - 5 to 9 (%)
Housing units in structures - 10 to 19 (%)
Housing units in structures - 20 to 49 (%)
Housing units in structures - 50 or more (%)
Housing units in structures - Mobile home (%)
Housing units in structures - Boat, RV, van, etc. (%)
Housing units in structures - Owners - 1, detached (%)
Housing units in structures - Owners - 1, attached (%)
Housing units in structures - Owners - 2 (%)
Housing units in structures - Owners - 3 or 4 (%)
Housing units in structures - Owners - 5 to 9 (%)
Housing units in structures - Owners - 10 to 19 (%)
Housing units in structures - Owners - 20 to 49 (%)
Housing units in structures - Owners - 50 or more (%)
Housing units in structures - Owners - Mobile home (%)
Housing units in structures - Owners - Boat, RV, van, etc. (%)
Housing units in structures - Renters - 1, detached (%)
Housing units in structures - Renters - 1, attached (%)
Housing units in structures - Renters - 2 (%)
Housing units in structures - Renters - 3 or 4 (%)
Housing units in structures - Renters - 5 to 9 (%)
Housing units in structures - Renters - 10 to 19 (%)
Housing units in structures - Renters - 20 to 49 (%)
Housing units in structures - Renters - 50 or more (%)
Housing units in structures - Renters - Mobile home (%)
Housing units in structures - Renters - Boat, RV, van, etc. (%)
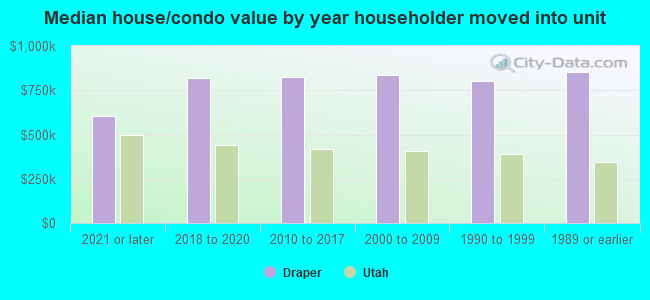
House/condo owner moved in on average (years ago)
Renter moved in on average (years ago)
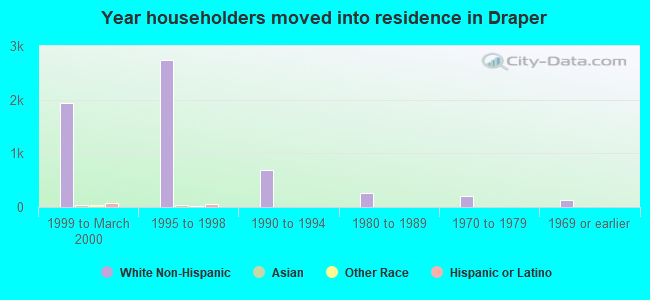
Year householder moved into unit - Moved in 1999 to March 2000 (%)
Year householder moved into unit - Moved in 1999 to March 2000 (%) - White
Year householder moved into unit - Moved in 1999 to March 2000 (%) - Black or African American
Year householder moved into unit - Moved in 1999 to March 2000 (%) - Asian
Year householder moved into unit - Moved in 1999 to March 2000 (%) - Hispanic or Latino
Year householder moved into unit - Moved in 1999 to March 2000 (%) - American Indian and Alaska Native
Year householder moved into unit - Moved in 1999 to March 2000 (%) - Multirace
Year householder moved into unit - Moved in 1999 to March 2000 (%) - Other Race
Year householder moved into unit - Moved in 1995 to 1998 (%)
Year householder moved into unit - Moved in 1995 to 1998 (%) - White
Year householder moved into unit - Moved in 1995 to 1998 (%) - Black or African American
Year householder moved into unit - Moved in 1995 to 1998 (%) - Asian
Year householder moved into unit - Moved in 1995 to 1998 (%) - Hispanic or Latino
Year householder moved into unit - Moved in 1995 to 1998 (%) - American Indian and Alaska Native
Year householder moved into unit - Moved in 1995 to 1998 (%) - Multirace
Year householder moved into unit - Moved in 1995 to 1998 (%) - Other Race
Year householder moved into unit - Moved in 1990 to 1994 (%)
Year householder moved into unit - Moved in 1990 to 1994 (%) - White
Year householder moved into unit - Moved in 1990 to 1994 (%) - Black or African American
Year householder moved into unit - Moved in 1990 to 1994 (%) - Asian
Year householder moved into unit - Moved in 1990 to 1994 (%) - Hispanic or Latino
Year householder moved into unit - Moved in 1990 to 1994 (%) - American Indian and Alaska Native
Year householder moved into unit - Moved in 1990 to 1994 (%) - Multirace
Year householder moved into unit - Moved in 1990 to 1994 (%) - Other Race
Year householder moved into unit - Moved in 1980 to 1989 (%)
Year householder moved into unit - Moved in 1980 to 1989 (%) - White
Year householder moved into unit - Moved in 1980 to 1989 (%) - Black or African American
Year householder moved into unit - Moved in 1980 to 1989 (%) - Asian
Year householder moved into unit - Moved in 1980 to 1989 (%) - Hispanic or Latino
Year householder moved into unit - Moved in 1980 to 1989 (%) - American Indian and Alaska Native
Year householder moved into unit - Moved in 1980 to 1989 (%) - Multirace
Year householder moved into unit - Moved in 1980 to 1989 (%) - Other Race
Year householder moved into unit - Moved in 1970 to 1979 (%)
Year householder moved into unit - Moved in 1970 to 1979 (%) - White
Year householder moved into unit - Moved in 1970 to 1979 (%) - Black or African American
Year householder moved into unit - Moved in 1970 to 1979 (%) - Asian
Year householder moved into unit - Moved in 1970 to 1979 (%) - Hispanic or Latino
Year householder moved into unit - Moved in 1970 to 1979 (%) - American Indian and Alaska Native
Year householder moved into unit - Moved in 1970 to 1979 (%) - Multirace
Year householder moved into unit - Moved in 1970 to 1979 (%) - Other Race
Year householder moved into unit - Moved in 1969 or earlier (%)
Year householder moved into unit - Moved in 1969 or earlier (%) - White
Year householder moved into unit - Moved in 1969 or earlier (%) - Black or African American
Year householder moved into unit - Moved in 1969 or earlier (%) - Asian
Year householder moved into unit - Moved in 1969 or earlier (%) - Hispanic or Latino
Year householder moved into unit - Moved in 1969 or earlier (%) - American Indian and Alaska Native
Year householder moved into unit - Moved in 1969 or earlier (%) - Multirace
Year householder moved into unit - Moved in 1969 or earlier (%) - Other Race
Housing units lacking complete plumbing facilities (%)
Housing units lacking complete kitchen facilities (%)
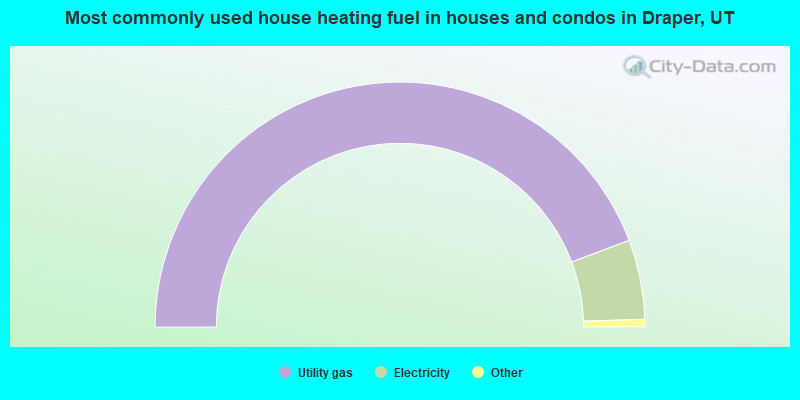
House heating fuel used in houses and condos - Utility gas (%)
House heating fuel used in houses and condos - Bottled, tank, or LP gas (%)
House heating fuel used in houses and condos - Electricity (%)
House heating fuel used in houses and condos - Fuel oil, kerosene, etc. (%)
House heating fuel used in houses and condos - Coal or coke (%)
House heating fuel used in houses and condos - Wood (%)
House heating fuel used in houses and condos - Solar energy (%)
House heating fuel used in houses and condos - Other fuel (%)
House heating fuel used in houses and condos - No fuel used (%)
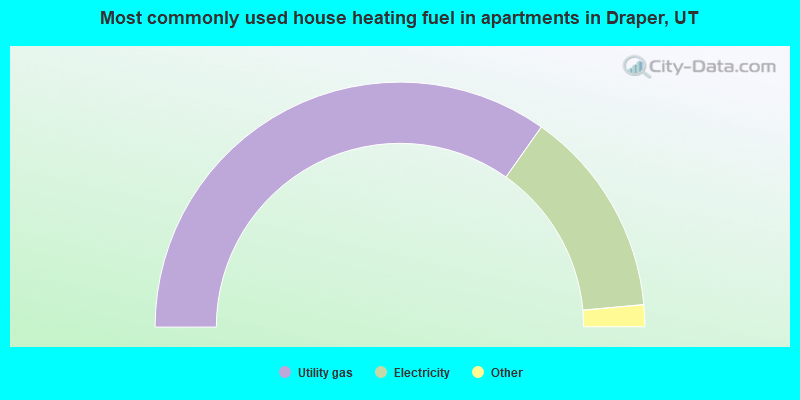
House heating fuel used in apartments - Utility gas (%)
House heating fuel used in apartments - Bottled, tank, or LP gas (%)
House heating fuel used in apartments - Electricity (%)
House heating fuel used in apartments - Fuel oil, kerosene, etc. (%)
House heating fuel used in apartments - Coal or coke (%)
House heating fuel used in apartments - Wood (%)
House heating fuel used in apartments - Solar energy (%)
House heating fuel used in apartments - Other fuel (%)
House heating fuel used in apartments - No fuel used (%)
Latest news about housing in Draper, UT collected exclusively by city-data.com from local newspapers, TV, and radio stations
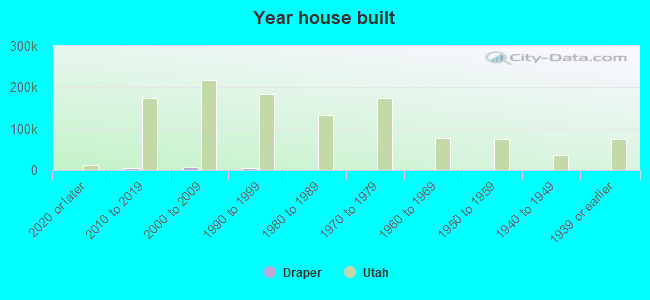
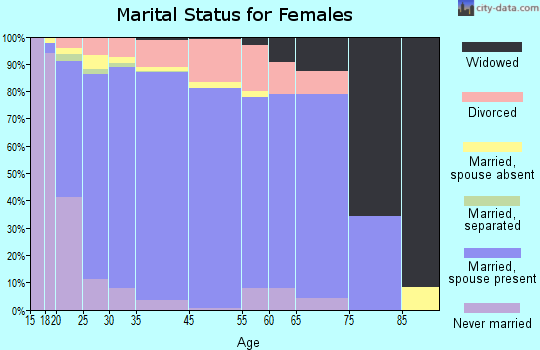
Median year house/condo built: 2000Median year apartment built: 2008Household type by relationship:
Households: 50,875
Male householders: 9,034 (1,335 living alone ), Female householders: 6,901 (1,492 living alone )10,801 spouses (10,669 opposite-sex spouses ), 761 unmarried partners , (660 opposite-sex unmarried partners ), 18,553 children (17,078 natural , 384 adopted , 1,090 stepchildren ), 535 grandchildren , 291 brothers or sisters , 400 parents , 0 foster children , 655 other relatives , 739 non-relatives In group quarters: 2,200
Size of family households: 4,683 2-persons , 2,712 3-persons , 2,285 4-persons , 1,551 5-persons , 879 6-persons , 463 7-or-more-persons .
Size of nonfamily households: 2,860 1-person , 784 2-persons , 146 3-persons , 7 4-persons , 8 6-persons .
12,290 married couples with children. single-parent households (391 men , 1,068 women ).
84.5% of residents of Draper speak English at home. of residents speak Spanish at home (82% speak English very well , 14% speak English well , 4% speak English not well , 1% don't speak English at all ).of residents speak other Indo-European language at home (88% speak English very well , 5% speak English well , 5% speak English not well , 2% don't speak English at all ).of residents speak Asian or Pacific Island language at home (77% speak English very well , 19% speak English well , 3% speak English not well , 1% don't speak English at all ).of residents speak other language at home (87% speak English very well , 13% speak English well ).
Foreign born population: 5,326 (10.5%)of them are naturalized citizens )
Median number of rooms in houses and condos:
Median number of rooms in apartments
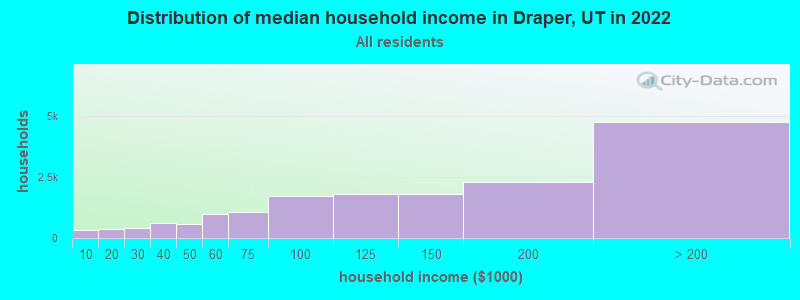
Draper, UT household income distribution 320 Less than $10,000383 $10,000 to $19,999408 $20,000 to $29,999616 $30,000 to $39,999566 $40,000 to $49,999985 $50,000 to $59,9991,065 $60,000 to $74,9991,729 $75,000 to $99,9991,810 $100,000 to $124,9991,814 $125,000 to $149,9992,279 $150,000 to $199,9994,755 $200,000 or more
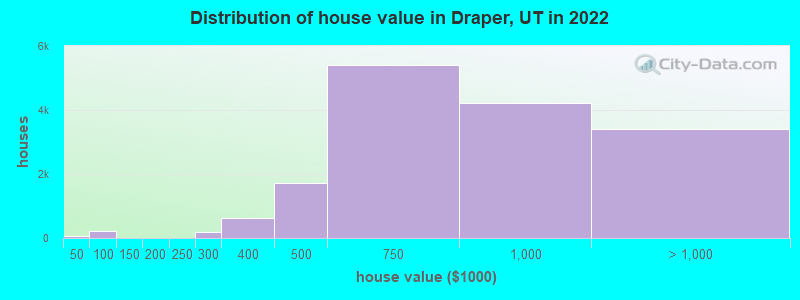
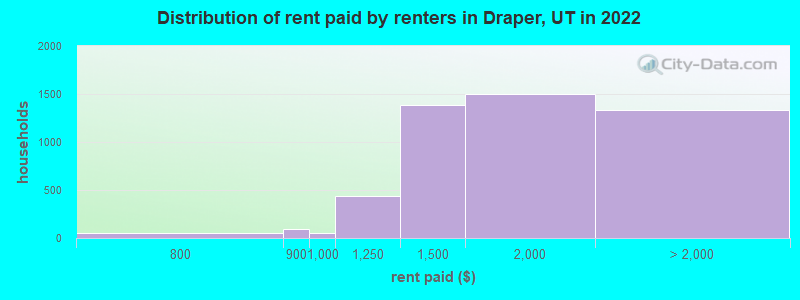
Home value of owner - occupied houses in 2022 in Draper, UT 25 Less than $10,0006 $10,000 to $14,99919 $25,000 to $29,99916 $40,000 to $49,99925 $50,000 to $59,999178 $60,000 to $69,99911 $100,000 to $124,9993 $150,000 to $174,99915 $200,000 to $249,999198 $250,000 to $299,999633 $300,000 to $399,9991,713 $400,000 to $499,9995,418 $500,000 to $749,9994,228 $750,000 to $999,9992,328 $1,000,000 to $1,499,999605 $1,500,000 to $1,999,999473 $2,000,000 or moreRent paid by renters in 2022 in Draper, UT 10 Less than $1008 $650 to $69922 $700 to $74928 $750 to $79988 $800 to $89949 $900 to $999439 $1,000 to $1,2491,381 $1,250 to $1,4991,498 $1,500 to $1,999996 $2,000 to $2,49955 $2,500 to $2,99958 $3,000 to $3,499138 $3,500 or more80 No cash rent
Percentage of workers working in this county: 83.4%Number of people working at home: 6,350 (25.5% of all workers )
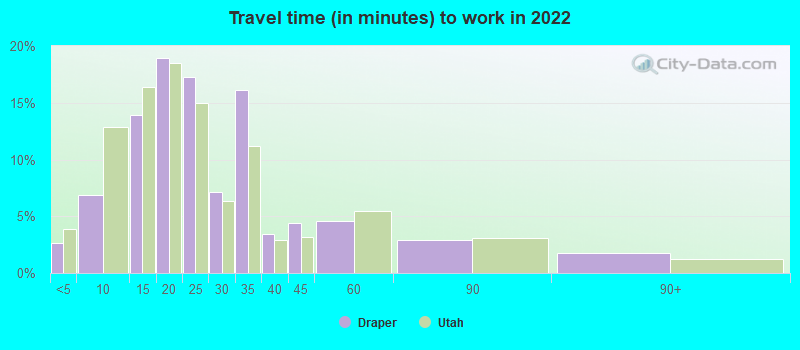
Travel time to work (commute)
Less than 5 minutes: 8125 to 9 minutes: 1,98910 to 14 minutes: 2,62015 to 19 minutes: 2,62020 to 24 minutes: 2,79625 to 29 minutes: 2,07330 to 34 minutes: 2,99135 to 39 minutes: 84140 to 44 minutes: 58545 to 59 minutes: 1,07460 to 89 minutes: 44690 or more minutes: 148
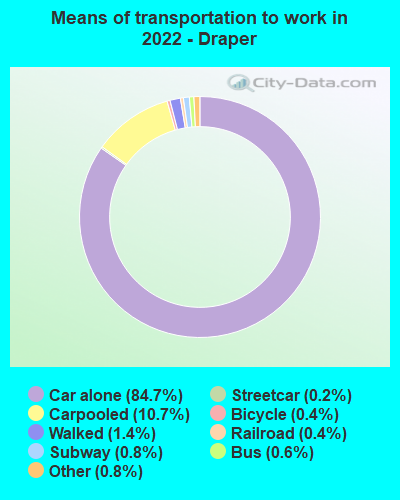
Means of transportation to work:
Drove a car alone: 28,130 (70.9%)Carpooled: 3,823 (9.6%)Bus : 140 (0.4%)Subway or elevated rail : 41 (0.1%)Long-distance train or commuter rail : 177 (0.4%)Light rail, streetcar or trolley : 101 (0.3%)Taxi: 259 (0.7%)Bicycle: 124 (0.3%)Walked: 469 (1.2%)Worked at home: 6,350 (16.0%)
Unemployment by race in 2022
Unemployment rate for White non-Hispanic residents 1.3% Males1.1% FemalesUnemployment rate for two or more race residents 7.3% Males7.6% FemalesUnemployment rate for Hispanic or Latino residents 3.8% Males4.5% Females
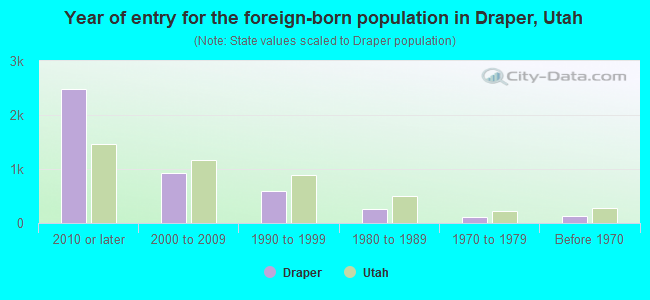
Year of entry for the foreign-born population in Draper, Utah
2,483 2010 or later 926 2000 to 2009 601 1990 to 1999 257 1980 to 1989 115 1970 to 1979 131 Before 1970
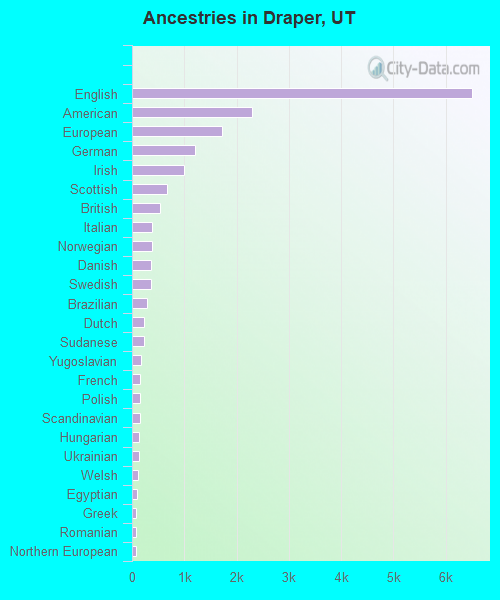
First ancestries reported:
English: 6,505 (25.9%)
American: 2,289 (9.1%)
European: 1,724 (6.9%)
German: 1,204 (4.8%)
Irish: 1,002 (4.0%)
Scottish: 666 (2.7%)
British: 544 (2.2%)
Italian: 378 (1.5%)
Norwegian: 377 (1.5%)
Danish: 369 (1.5%)
Swedish: 362 (1.4%)
Brazilian: 288 (1.1%)
Dutch: 235 (0.9%)
Sudanese: 228 (0.9%)
Yugoslavian: 164 (0.7%)
French: 162 (0.6%)
Polish: 151 (0.6%)
Scandinavian: 146 (0.6%)
Hungarian: 143 (0.6%)
Ukrainian: 130 (0.5%)
Welsh: 115 (0.5%)
Egyptian: 101 (0.4%)
Greek: 86 (0.3%)
Romanian: 85 (0.3%)
Northern European: 80 (0.3%)
Palestinian: 71 (0.3%)
Croatian: 57 (0.2%)
Somali: 52 (0.2%)
Canadian: 43 (0.2%)
Scotch-Irish: 42 (0.2%)
Haitian: 42 (0.2%)
West Indian: 41 (0.2%)
Iranian: 36 (0.1%)
Finnish: 35 (0.1%)
Basque: 34 (0.1%)
Portuguese: 33 (0.1%)
Russian: 32 (0.1%)
Guyanese: 27 (0.1%)
Armenian: 26 (0.1%)
Swiss: 25 (0.10%)
Austrian: 23 (0.09%)
Slovak: 21 (0.08%)
Lebanese: 21 (0.08%)
Bulgarian: 19 (0.08%)
South African: 8 (0.03%)
Eastern European: 4 (0.02%)
Iraqi: 4 (0.02%)
African: 2 (0.01%)
Most common places of birth for foreign-born residents (%): Brazil Draper:
12.2% (658)Utah:
2.8% (7,644)
India Draper:
11.7% (628)Utah:
3.0% (8,294)
Mexico Draper:
10.8% (583)Utah:
36.1% (99,740)
Canada Draper:
6.1% (330)Utah:
3.0% (8,341)
China, excluding Hong Kong and Taiwan Draper:
5.8% (312)Utah:
2.9% (8,017)
Other Eastern Africa Draper:
5.1% (272)Utah:
0.5% (1,475)
England Draper:
4.1% (218)Utah:
1.1% (2,900)
Venezuela Draper:
4.0% (217)Utah:
3.2% (8,804)
Oceania, n.e.c. Draper:
3.7% (199)Utah:
2.7% (7,472)
Hungary Draper:
2.5% (135)Utah:
0.2% (444)
Vietnam Draper:
2.1% (113)Utah:
2.6% (7,211)
South Africa Draper:
1.7% (90)Utah:
0.3% (896)
Bosnia and Herzegovina Draper:
1.6% (84)Utah:
0.6% (1,743)
Place of birth for U.S.-born residents:
This state: 28,116Other state: 16,711Northeast: 1,408Midwest: 3,754South: 3,176West: 8,327 84.8% of Draper residents lived in the same house 1 years ago.
Out of people who lived in different houses, 36.6% lived in this county.
Out of people who lived in different counties, 59.7% lived in Utah.
Draper:
84.8%State average:
85.7%
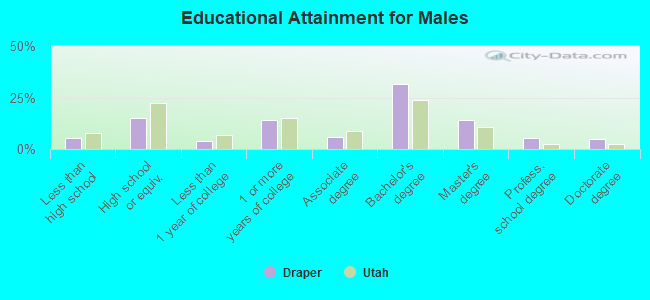
Education attainment for males 25 years and older:
No schooling: 379Nursery to 4th grade: 155th and 6th grade: 167th and 8th grade: 319th grade: 12010th grade: 3811th grade: 12912th grade, no diploma: 128High school graduate (or equivalency): 2,492Less than 1 year of college: 636Some college more than 1 year, no degree: 2,305Associate degree: 1,000Bachelor's degree: 5,221Master's degree: 2,310Professional school degree: 882Doctorate degree: 838
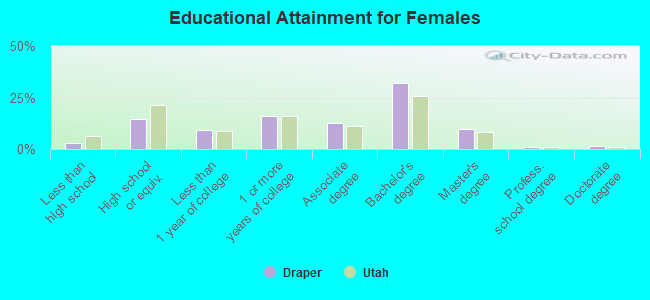
Education attainment for females 25 years and older:
No schooling: 175Nursery to 4th grade: 05th and 6th grade: 147th and 8th grade: 89th grade: 1210th grade: 1411th grade: 10212th grade, no diploma: 109High school graduate (or equivalency): 2,246Less than 1 year of college: 1,437Some college more than 1 year, no degree: 2,440Associate degree: 1,913Bachelor's degree: 4,885Master's degree: 1,508Professional school degree: 173Doctorate degree: 236
Housing units in structures:
One, detached: 11,012One, attached: 2,587Two: 293 or 4: 5865 to 9: 40310 to 19: 62520 to 49: 30850 or more: 1,356Mobile homes: 107Median worth of mobile homes: $93,455
Housing units lacking complete plumbing facilities in 2022: 0.2%Housing units lacking complete kitchen facilities in 2022: 0.6%House/condo owner moved in on average 8 years ago
Renter moved in on average 1 years ago
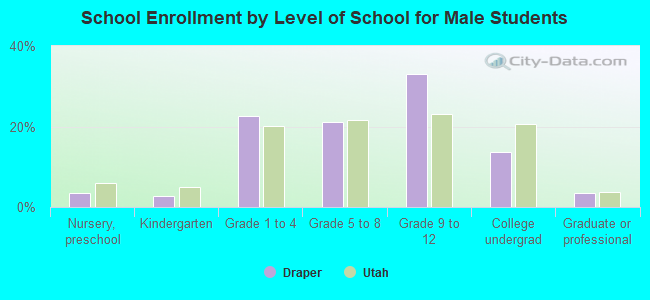
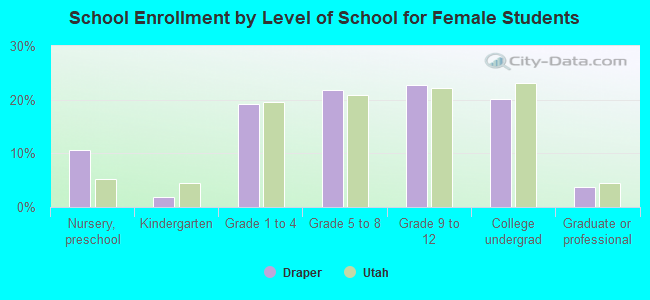
Private vs. public school enrollment:
Students in private schools in grades 1 to 8 (elementary and middle school): 766 Students in private schools in grades 9 to 12 (high school): 373 Students in private undergraduate colleges: 718