Housing density: 2,037 houses/condos per square mile
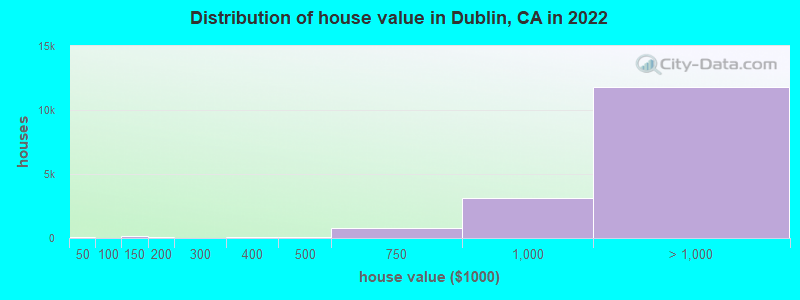
Median price asked for vacant for-sale houses and condos in 2022: $931,521.
Median contract rent in 2022: over $2,000 (lower quartile is over $2,000, upper quartile is over $2,000)
Median rent asked for vacant for-rent units in 2022: $3,073
Median gross rent in Dublin, CA in 2022: over $2,000
Housing units in Dublin with a mortgage: 12,210 (1,330 second mortgage, 104 home equity loan, 1,079 both second mortgage and home equity loan) Houses without a mortgage: 338
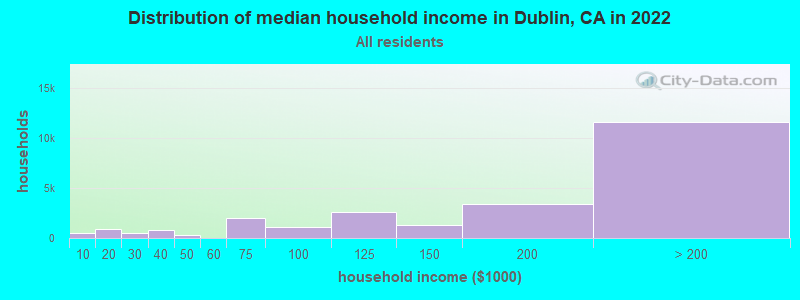
Median household income for houses/condos with a mortgage: $250,001
Median household income for apartments without a mortgage: $156,800
Size of family households: 5,591 2-persons, 5,609 3-persons, 5,494 4-persons, 989 5-persons, 548 6-persons, 315 7-or-more-persons.
Size of nonfamily households: 4,955 1-person, 1,376 2-persons.
15,170 married couples with children.
1,858 single-parent households (666 men, 1,192 women).
50.5% of residents of Dublin speak English at home.
4.7% of residents speak Spanish at home (68% speak English very well, 18% speak English well, 12% speak English not well, 1% don't speak English at all).
17.3% of residents speak other Indo-European language at home (81% speak English very well, 14% speak English well, 5% speak English not well).
26.3% of residents speak Asian or Pacific Island language at home (69% speak English very well, 19% speak English well, 9% speak English not well, 3% don't speak English at all).
1.2% of residents speak other language at home (89% speak English very well, 4% speak English well, 3% speak English not well, 3% don't speak English at all).
Foreign born population: 29,566 (41.0%)
(51.9% of them are naturalized citizens)
Percentage of workers working in this county: 73.3% Number of people working at home: 13,313 (37.0% of all workers)
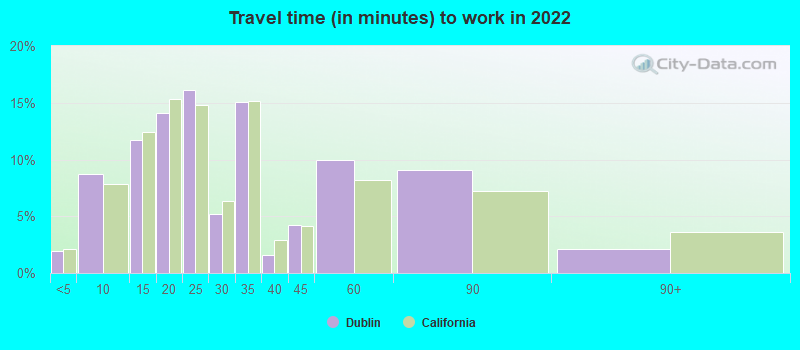
Travel time to work (commute)
Less than 5 minutes: 77
5 to 9 minutes: 2,107
10 to 14 minutes: 3,177
15 to 19 minutes: 2,724
20 to 24 minutes: 1,256
25 to 29 minutes: 996
30 to 34 minutes: 3,135
35 to 39 minutes: 760
40 to 44 minutes: 1,452
45 to 59 minutes: 3,825
60 to 89 minutes: 3,349
90 or more minutes: 898
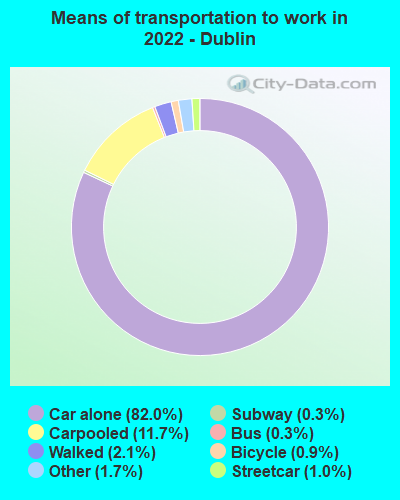
Means of transportation to work:
Drove a car alone: 15,225 (50.3%)
Carpooled: 2,284 (7.5%)
Bus: 50 (0.2%)
Subway or elevated rail: 140 (0.5%)
Long-distance train or commuter rail: 40 (0.1%)
Taxi: 328 (1.1%)
Bicycle: 176 (0.6%)
Walked: 400 (1.3%)
Worked at home: 13,313 (44.0%)
Unemployment by race in 2022
Unemployment rate for White non-Hispanic residents
2.1%Males
1.5%Females
Unemployment rate for Black residents
3.3%Males
5.7%Females
Unemployment rate for American Indian and Alaska Native residents
6.6%Females
Unemployment rate for Asian residents
2.2%Males
5.9%Females
Unemployment rate for other race residents
15.4%Males
Unemployment rate for two or more race residents
3.8%Males
1.0%Females
Unemployment rate for Hispanic or Latino residents
7.8%Males
Year of entry for the foreign-born population in Dublin, California
11,5372010 or later
8,2102000 to 2009
4,9101990 to 1999
1,1701980 to 1989
6251970 to 1979
792Before 1970
First ancestries reported:
Afghan: 1,346 (3.1%)
Irish: 898 (2.1%)
Iranian: 629 (1.5%)
English: 597 (1.4%)
German: 595 (1.4%)
American: 512 (1.2%)
Italian: 485 (1.1%)
European: 460 (1.1%)
Russian: 368 (0.9%)
Scotch-Irish: 338 (0.8%)
Portuguese: 233 (0.5%)
Swedish: 224 (0.5%)
Norwegian: 198 (0.5%)
Ethiopian: 175 (0.4%)
Romanian: 172 (0.4%)
Northern European: 168 (0.4%)
Sudanese: 156 (0.4%)
Polish: 135 (0.3%)
Turkish: 130 (0.3%)
African: 118 (0.3%)
Lithuanian: 109 (0.3%)
Maltese: 108 (0.3%)
French: 103 (0.2%)
Bulgarian: 90 (0.2%)
Finnish: 84 (0.2%)
British: 83 (0.2%)
Ukrainian: 76 (0.2%)
Greek: 75 (0.2%)
Scottish: 64 (0.1%)
Jamaican: 63 (0.1%)
Scandinavian: 52 (0.1%)
Egyptian: 48 (0.1%)
Swiss: 47 (0.1%)
Welsh: 34 (0.08%)
New Zealander: 29 (0.07%)
Canadian: 27 (0.06%)
Croatian: 23 (0.05%)
Dutch: 20 (0.05%)
French Canadian: 20 (0.05%)
Iraqi: 18 (0.04%)
Cajun: 17 (0.04%)
Basque: 16 (0.04%)
Belgian: 14 (0.03%)
Lebanese: 14 (0.03%)
Serbian: 10 (0.02%)
Israeli: 9 (0.02%)
Brazilian: 8 (0.02%)
Eastern European: 8 (0.02%)
Danish: 7 (0.02%)
Hungarian: 4 (0.01%)
Most common places of birth for foreign-born residents (%):
India
Dublin:
43.9% (12,632)
California:
5.2% (539,184)
China, excluding Hong Kong and Taiwan
Dublin:
14.7% (4,215)
California:
6.6% (684,672)
Philippines
Dublin:
6.2% (1,786)
California:
7.8% (818,297)
Korea
Dublin:
4.6% (1,324)
California:
3.0% (315,248)
Afghanistan
Dublin:
3.7% (1,072)
California:
0.5% (53,260)
Mexico
Dublin:
3.4% (989)
California:
37.2% (3,881,193)
Hong Kong
Dublin:
2.2% (622)
California:
1.0% (105,215)
Vietnam
Dublin:
2.0% (574)
California:
4.9% (512,335)
Taiwan
Dublin:
1.8% (523)
California:
1.7% (176,274)
Place of birth for U.S.-born residents:
This state: 32,175
Other state: 9,472
Northeast: 1,798
Midwest: 2,962
South: 2,942
West: 1,770
82.5% of Dublin residents lived in the same house 1 years ago. Out of people who lived in different houses, 36.3% lived in this county. Out of people who lived in different counties, 57.9% lived in California.
Dublin:
82.5%
State average:
88.9%
Education attainment for males 25 years and older:
No schooling: 84
Nursery to 4th grade: 0
5th and 6th grade: 545
7th and 8th grade: 460
9th grade: 75
10th grade: 75
11th grade: 376
12th grade, no diploma: 108
High school graduate (or equivalency): 2,548
Less than 1 year of college: 763
Some college more than 1 year, no degree: 2,476
Associate degree: 923
Bachelor's degree: 7,440
Master's degree: 7,429
Professional school degree: 254
Doctorate degree: 1,471
Education attainment for females 25 years and older:
No schooling: 197
Nursery to 4th grade: 0
5th and 6th grade: 602
7th and 8th grade: 373
9th grade: 381
10th grade: 0
11th grade: 138
12th grade, no diploma: 104
High school graduate (or equivalency): 2,022
Less than 1 year of college: 778
Some college more than 1 year, no degree: 2,088
Associate degree: 825
Bachelor's degree: 9,482
Master's degree: 5,950
Professional school degree: 655
Doctorate degree: 1,156
Housing units in structures:
One, detached: 14,482
One, attached: 2,755
Two: 526
3 or 4: 191
5 to 9: 2,238
10 to 19: 415
20 to 49: 504
50 or more: 4,525
Housing units lacking complete kitchen facilities in 2022: 0.4%