Duncan, SC (South Carolina) Houses and Residents
| Duncan: | $194,089 |
| South Carolina: | $254,600 |
Mean price in 2022:
Detached houses: $231,856
Here: $231,856 State: $368,255 Mobile homes: $22,856
Here: $22,856 State: $102,531
Total population: 3,269 (Urban population: 2,893, Rural population: 75 (all nonfarm))
Houses: 1,743 (1,650 occupied: 894 owner occupied, 775 renter occupied)
| % of renters here: | 46% |
| State: | 28% |
Housing density: 497 houses/condos per square mile
Median price asked for vacant for-sale houses and condos in 2022 in this county: $161,822.
Median contract rent in 2022: $879 (lower quartile is $651, upper quartile is $1,104)
Median rent asked for vacant for-rent units in 2022: $1,093
Median gross rent in Duncan, SC in 2022: $1,068
Housing units in Duncan with a mortgage: 425 (1 second mortgage, 0 home equity loan, 1 both second mortgage and home equity loan)
Houses without a mortgage: 12
Median household income for houses/condos with a mortgage: $53,555
Median household income for apartments without a mortgage: $47,610
Median monthly housing costs: $898
Compare current foreclosures near Duncan, SC:
| Photo | Address | Area | Beds / Baths | Price | Details |
|---|---|---|---|---|---|

|
#1
Eastberrys Creek Rd
Duncan, SC 29334
|
2,851 sq. feet
|
3 baths 3 beds |
show details | |

|
#2
North Ave
Duncan, SC 29334
|
1,434 sq. feet
|
1 baths 2 beds |
show details | |

|
#3
W Tara Ln
Duncan, SC 29334
|
2,396 sq. feet
|
3 baths 3 beds |
show details | |

|
#4
Torrington Dr
Duncan, SC 29334
|
- sq. feet
|
- baths - beds |
show details | |

|
#5
E Main St
Duncan, SC 29334
|
- sq. feet
|
- baths - beds |
show details | |

|
#6
Lyman Ave Apt A8
Duncan, SC 29334
|
- sq. feet
|
- baths - beds |
show details | |

|
#7
Harken Ct, Apt 308
Duncan, SC 29334
|
- sq. feet
|
- baths - beds |
show details | |

|
#8
Torrington Dr
Duncan, SC 29334
|
- sq. feet
|
- baths - beds |
show details | |

|
#9
Stilmore Dr
Duncan, SC 29334
|
- sq. feet
|
- baths - beds |
show details | |

|
#10
Overhill Dr
Duncan, SC 29334
|
- sq. feet
|
- baths - beds |
show details |
| Photo | Address | Area | Beds / Baths | Price | Details |
|---|---|---|---|---|---|

|
#11
Marietta Ln
Duncan, SC 29334
|
- sq. feet
|
- baths - beds |
show details | |

|
#12
W Stableford Dr
Duncan, SC 29334
|
- sq. feet
|
- baths - beds |
show details | |

|
#13
Mortar Dr
Duncan, SC 29334
|
- sq. feet
|
- baths - beds |
show details | |

|
#14
Valley Creek Dr
Boiling Springs, SC 29316
|
1,630 sq. feet
|
2 baths 3 beds |
show details | |

|
#15
Ridings Rd
Campobello, SC 29322
|
2,518 sq. feet
|
2 baths 3 beds |
show details | |

|
#16
Arbor Creek Dr
Inman, SC 29349
|
2,280 sq. feet
|
2 baths 3 beds |
show details | |

|
#17
Coventry Ln
Greenville, SC 29609
|
1,737 sq. feet
|
1 baths 3 beds |
show details | |

|
#18
N Charles Dr
Greenville, SC 29605
|
- sq. feet
|
2 baths 3 beds |
show details | |

|
#19
Jewell Rd
Spartanburg, SC 29302
|
1,560 sq. feet
|
1 baths 3 beds |
show details | |

|
#20
Shoally Creek Rd
Boiling Springs, SC 29316
|
1,784 sq. feet
|
3 baths 5 beds |
show details |
| Photo | Address | Area | Beds / Baths | Price | Details |
|---|---|---|---|---|---|

|
#21
Garrison Rd
Simpsonville, SC 29681
|
- sq. feet
|
3 baths 4 beds |
show details | |

|
#22
Campton Cir
Inman, SC 29349
|
1,372 sq. feet
|
1 baths 3 beds |
show details | |

|
#23
Joggins Dr
Simpsonville, SC 29681
|
2,176 sq. feet
|
3 baths 4 beds |
show details | |

|
#24
Sapphire Ct
Inman, SC 29349
|
2,052 sq. feet
|
2 baths 5 beds |
show details | |

|
#25
E Fremont Ave
Spartanburg, SC 29303
|
1,537 sq. feet
|
2 baths 3 beds |
show details | |

|
#26
Burtonwood Dr
Spartanburg, SC 29301
|
- sq. feet
|
2 baths 4 beds |
show details | |

|
#27
Farmstead Trl
Inman, SC 29349
|
1,983 sq. feet
|
2 baths 4 beds |
show details | |

|
#28
Hillcrest Blvd
Spartanburg, SC 29307
|
1,156 sq. feet
|
1 baths 3 beds |
show details | |

|
#29
W Rustling Leaves Ln
Roebuck, SC 29376
|
1,760 sq. feet
|
2 baths 4 beds |
show details | |

|
#30
Dogwood Ave
Spartanburg, SC 29302
|
2,069 sq. feet
|
2 baths 4 beds |
show details |
| Photo | Address | Area | Beds / Baths | Price | Details |
|---|---|---|---|---|---|

|
#31
Cavendish Cir
Taylors, SC 29687
|
1,350 sq. feet
|
2 baths 3 beds |
show details | |

|
#32
Woodgrove Way
Greer, SC 29651
|
1,868 sq. feet
|
2 baths 4 beds |
show details | |

|
#33
Suzanna Dr
Inman, SC 29349
|
1,634 sq. feet
|
2 baths 3 beds |
show details | |

|
#34
Hibiscus Ct
Lyman, SC 29365
|
1,542 sq. feet
|
2 baths 3 beds |
show details | |

|
#35
Holly Cir
Lyman, SC 29365
|
1,497 sq. feet
|
2 baths 3 beds |
show details | |

|
#36
Marconi Dr
Spartanburg, SC 29303
|
2,413 sq. feet
|
2 baths 5 beds |
show details | |

|
#37
Tucapau Rd
Wellford, SC 29385
|
1,232 sq. feet
|
1 baths 2 beds |
show details | |

|
#38
Scuffletown Rd
Fountain Inn, SC 29644
|
2,123 sq. feet
|
2 baths 3 beds |
show details | |

|
#39
Brookhaven Way
Simpsonville, SC 29681
|
1,594 sq. feet
|
2 baths 3 beds |
show details | |

|
#40
Red Jonathan Ct
Simpsonville, SC 29681
|
2,168 sq. feet
|
2 baths 3 beds |
show details |
| Photo | Address | Area | Beds / Baths | Price | Details |
|---|---|---|---|---|---|

|
#41
Marble Ln
Boiling Springs, SC 29316
|
2,121 sq. feet
|
2 baths 3 beds |
show details | |

|
#42
Garden Corners Ct
Simpsonville, SC 29681
|
2,717 sq. feet
|
3 baths 4 beds |
show details | |

|
#43
Lynn Dr
Taylors, SC 29687
|
2,001 sq. feet
|
2 baths 3 beds |
show details | |

|
#44
W Darby Rd
Greenville, SC 29609
|
1,040 sq. feet
|
2 baths 3 beds |
show details | |

|
#45
Huck Ct
Mauldin, SC 29662
|
1,516 sq. feet
|
2 baths 3 beds |
show details | |

|
#46
Briarstone Ct
Mauldin, SC 29662
|
1,600 sq. feet
|
2 baths 3 beds |
show details | |

|
#47
W Croft Cir
Spartanburg, SC 29302
|
1,832 sq. feet
|
1 baths 5 beds |
show details | |

|
#48
Elmwood Dr
Spartanburg, SC 29303
|
1,862 sq. feet
|
2 baths 3 beds |
show details | |

|
#49
Washington Rd
Spartanburg, SC 29302
|
1,632 sq. feet
|
1 baths 3 beds |
show details | |

|
Check over 1 million property listings on Foreclosure.com!
|
browse all offers | |||

Latest news about housing in Duncan, SC collected exclusively by city-data.com from local newspapers, TV, and radio stations


Median year apartment built: 1989
Household type by relationship:
Households: 4,245- Male householders: 654 (210 living alone), Female householders: 994 (334 living alone)
589 spouses (518 opposite-sex spouses), 322 unmarried partners, (322 opposite-sex unmarried partners), 1,297 children (1,143 natural, 7 adopted, 146 stepchildren), 76 grandchildren, 43 brothers or sisters, 167 parents, 0 foster children, 0 other relatives, 68 non-relatives
- In group quarters: 30
Size of family households: 289 2-persons, 393 3-persons, 261 4-persons, 118 5-persons.
Size of nonfamily households: 583 1-person, 17 2-persons.
548 married couples with children.
421 single-parent households (211 men, 210 women).
90.6% of residents of Duncan speak English at home.
1.3% of residents speak Spanish at home (98% speak English very well, 2% don't speak English at all).
5.6% of residents speak other language at home (53% speak English very well, 47% speak English well).
Foreign born population: 389 (9.2%)
(26.0% of them are naturalized citizens)
| Here: | 5.8 |
| State: | 6.4 |
| Here: | 4.6 |
| State: | 4.5 |

- Bedrooms in owner-occupied houses and condos in Duncan, South Carolina
- 0no bedroom
- 01 bedroom
- 772 bedrooms
- 7063 bedrooms
- 1014 bedrooms
- 105+ bedrooms

- Bedrooms in renter-occupied apartments in Duncan, South Carolina
- 0no bedroom
- 1111 bedroom
- 3012 bedrooms
- 3153 bedrooms
- 484 bedrooms
- 05+ bedrooms

- Cars and other vehicles available in Duncan in owner-occupied houses/condos
- 37no vehicle
- 2941 vehicle
- 4872 vehicles
- 603 vehicles
- 164 vehicles
- 05+ vehicles

- Cars and other vehicles available in Duncan in renter-occupied apartments
- 55no vehicle
- 2981 vehicle
- 3172 vehicles
- 573 vehicles
- 484 vehicles
- 05+ vehicles

- Rooms in owner-occupied houses in Duncan, South Carolina
- 01 room
- 02 rooms
- 03 rooms
- 1854 rooms
- 1805 rooms
- 3206 rooms
- 907 rooms
- 858 rooms
- 349+ rooms

- Rooms in renter-occupied apartments in Duncan, South Carolina
- 01 room
- 582 rooms
- 1243 rooms
- 1754 rooms
- 1685 rooms
- 1676 rooms
- 847 rooms
- 08 rooms
- 09+ rooms


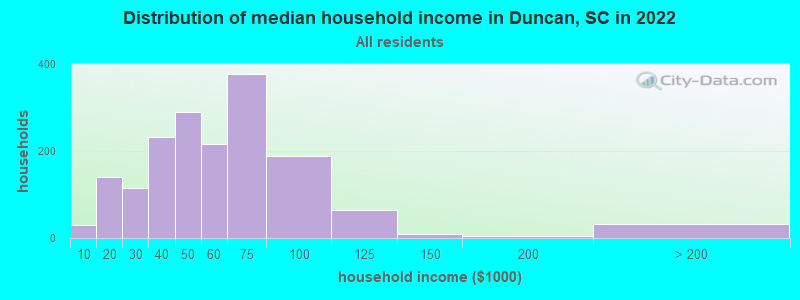
Duncan, SC household income distribution

- 31Less than $10,000
- 141$10,000 to $19,999
- 116$20,000 to $29,999
- 233$30,000 to $39,999
- 289$40,000 to $49,999
- 217$50,000 to $59,999
- 377$60,000 to $74,999
- 189$75,000 to $99,999
- 64$100,000 to $124,999
- 9$125,000 to $149,999
- 5$150,000 to $199,999
- 32$200,000 or more
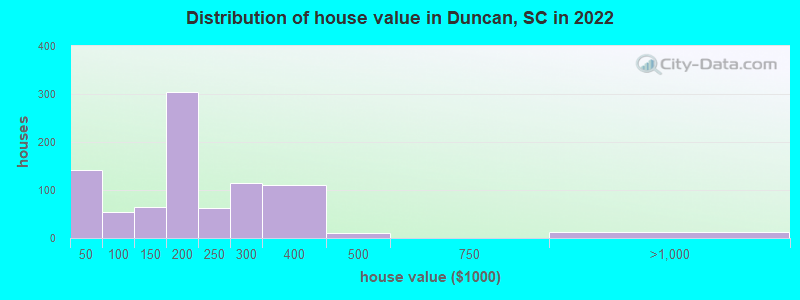
Home value of owner - occupied houses in 2022 in Duncan, SC
-
- 14Less than $10,000
- 81$10,000 to $14,999
- 46$30,000 to $34,999
- 9$50,000 to $59,999
- 44$80,000 to $89,999
- 38$100,000 to $124,999
- 24$125,000 to $149,999
- 265$150,000 to $174,999
- 38$175,000 to $199,999
- 62$200,000 to $249,999
- 114$250,000 to $299,999
- 109$300,000 to $399,999
- 11$400,000 to $499,999
- 12$750,000 to $999,999
Rent paid by renters in 2022 in Duncan, SC
-
- 69$250 to $299
- 28$300 to $349
- 8$350 to $399
- 30$400 to $449
- 10$500 to $549
- 5$550 to $599
- 71$600 to $649
- 66$650 to $699
- 44$750 to $799
- 90$800 to $899
- 131$900 to $999
- 260$1,000 to $1,249
- 9No cash rent


Percentage of workers working in this county: 77.8%
Number of people working at home: 12 (0.6% of all workers)
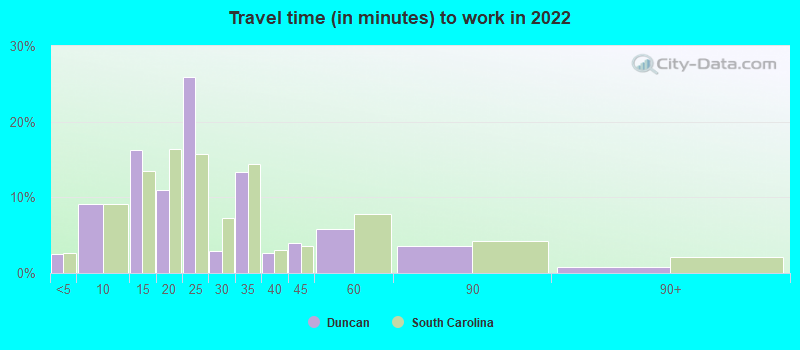
Travel time to work (commute)
- Less than 5 minutes: 79
- 5 to 9 minutes: 307
- 10 to 14 minutes: 376
- 15 to 19 minutes: 331
- 20 to 24 minutes: 170
- 25 to 29 minutes: 76
- 30 to 34 minutes: 137
- 35 to 39 minutes: 37
- 40 to 44 minutes: 103
- 45 to 59 minutes: 156
- 60 to 89 minutes: 33
- 90 or more minutes: 120
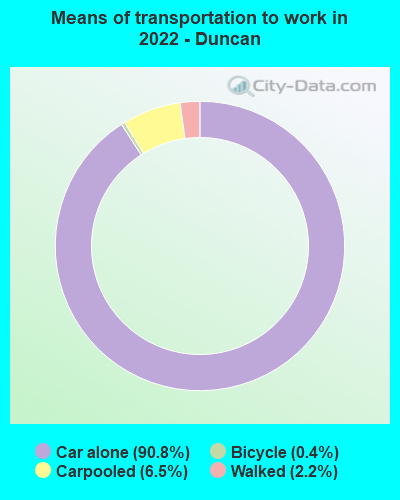
Means of transportation to work:
- Drove a car alone: 3,007 (89.1%)
- Carpooled: 215 (6.4%)
- Bicycle: 16 (0.5%)
- Walked: 32 (0.9%)
- Worked at home: 12 (0.4%)

- Unemployment by race in 2022
- Unemployment rate for White non-Hispanic residents
- 2.8%Females
- Unemployment rate for Black residents
- 3.7%Females

- Year of entry for the foreign-born population in Duncan, South Carolina
- 2102010 or later
- 742000 to 2009
- 281990 to 1999
- 81980 to 1989
- 01970 to 1979
- 0Before 1970

First ancestries reported:
- African: 205 (8.7%)
- German: 132 (5.6%)
- English: 105 (4.5%)
- Swedish: 58 (2.5%)
- Irish: 24 (1.0%)
- Icelander: 23 (1.0%)
- Finnish: 18 (0.8%)
- Italian: 17 (0.7%)
- American: 16 (0.7%)
- Russian: 1 (0.04%)
Most common places of birth for foreign-born residents (%):
| Duncan: | 80.6% (266) |
| South Carolina: | 0.6% (1,652) |
| Duncan: | 25.5% (84) |
| South Carolina: | 22.5% (60,774) |
| Duncan: | 14.5% (48) |
| South Carolina: | 0.1% (185) |
| Duncan: | 10.3% (34) |
| South Carolina: | 4.3% (11,533) |
Place of birth for U.S.-born residents:
- This state: 2,753
- Other state: 1,110
- Northeast: 179
- Midwest: 114
- South: 760
- West: 46
82.3% of Duncan residents lived in the same house 1 years ago.
Out of people who lived in different houses, 32.4% lived in this county.
Out of people who lived in different counties, 99.3% lived in South Carolina.
| Duncan: | 82.3% |
| State average: | 86.5% |
Education attainment for males 25 years and older:
- No schooling: 15
- Nursery to 4th grade: 27
- 5th and 6th grade: 0
- 7th and 8th grade: 8
- 9th grade: 0
- 10th grade: 23
- 11th grade: 0
- 12th grade, no diploma: 57
- High school graduate (or equivalency): 430
- Less than 1 year of college: 21
- Some college more than 1 year, no degree: 164
- Associate degree: 7
- Bachelor's degree: 231
- Master's degree: 107
- Professional school degree: 0
- Doctorate degree: 0

Education attainment for females 25 years and older:
- No schooling: 24
- Nursery to 4th grade: 0
- 5th and 6th grade: 0
- 7th and 8th grade: 33
- 9th grade: 0
- 10th grade: 0
- 11th grade: 47
- 12th grade, no diploma: 219
- High school graduate (or equivalency): 274
- Less than 1 year of college: 87
- Some college more than 1 year, no degree: 329
- Associate degree: 143
- Bachelor's degree: 478
- Master's degree: 65
- Professional school degree: 0
- Doctorate degree: 0


Housing units in structures:
- One, detached: 1,078
- Two: 18
- 3 or 4: 28
- 5 to 9: 51
- 10 to 19: 75
- 20 to 49: 187
- Mobile homes: 302
House/condo owner moved in on average 9 years ago
Renter moved in on average 2 years ago

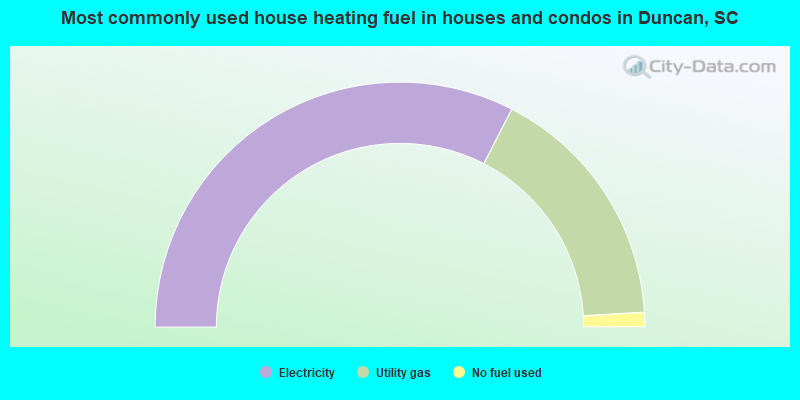
- 65.1%Electricity
- 33.0%Utility gas
- 1.9%No fuel used
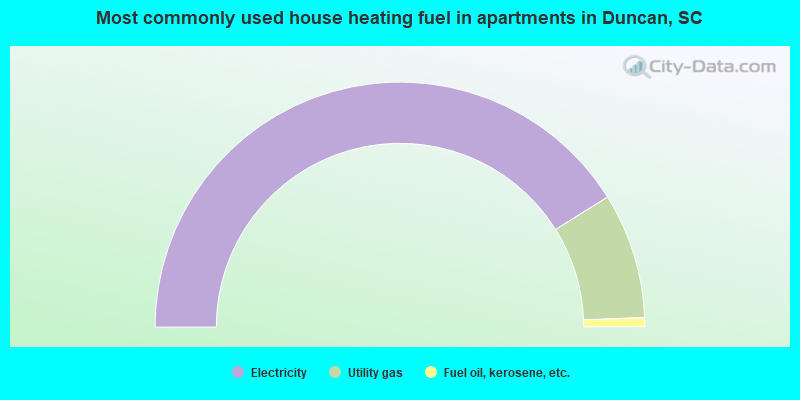
- 82.2%Electricity
- 16.6%Utility gas
- 1.2%Fuel oil, kerosene, etc.
Private vs. public school enrollment:
| Here: | 0.4% |
| South Carolina: | 14.4% |
| Here: | 17.1% |
| South Carolina: | 11.1% |
| Here: | 0.0% |
| South Carolina: | 21.9% |


