Dunlap, IL (Illinois) Houses and Residents
| Dunlap: | $276,068 |
| Illinois: | $251,600 |
Mean price in 2022:
Detached houses: $266,629
Here: $266,629 State: $310,164
Total population: 1,389 (Urban population: 0, Rural population: 902 (all nonfarm))
Houses: 564 (519 occupied: 431 owner occupied, 103 renter occupied)
| % of renters here: | 19% |
| State: | 33% |
Housing density: 1,512 houses/condos per square mile
Median price asked for vacant for-sale houses and condos in 2022: $1,891,549.
Median contract rent in 2022: $624 (lower quartile is $584, upper quartile is $775)
Median rent asked for vacant for-rent units in 2022: $245
Median gross rent in Dunlap, IL in 2022: $847
Housing units in Dunlap with a mortgage: 260 (27 second mortgage, 2 home equity loan, 23 both second mortgage and home equity loan)
Houses without a mortgage: 24
Median household income for houses/condos with a mortgage: $172,594
Median household income for apartments without a mortgage: $173,319
Median monthly housing costs: $1,255
Compare current foreclosures near Dunlap, IL:
| Photo | Address | Area | Beds / Baths | Price | Details |
|---|---|---|---|---|---|

|
#1
N Brooklyn Pl
Dunlap, IL 61525
|
1,756 sq. feet
|
2 baths 2 beds |
show details | |

|
#2
N Waterton
Dunlap, IL 61525
|
2,174 sq. feet
|
2 baths 4 beds |
show details | |

|
#3
W Wonderview Dr
Dunlap, IL 61525
|
1,288 sq. feet
|
1 baths 3 beds |
show details | |

|
#4
N Molleck Dr # 5
Peoria, IL 61604
|
952 sq. feet
|
2 baths 2 beds |
$129,000
|
show details |

|
#5
W Brookside Dr
Peoria, IL 61615
|
2,391 sq. feet
|
2 baths 3 beds |
$241,000
|
show details |

|
#6
Hickory Point Rd
Metamora, IL 61548
|
- sq. feet
|
1 baths 2 beds |
$114,900
|
show details |

|
#7
N Highland St
Creve Coeur, IL 61610
|
750 sq. feet
|
1 baths 1 beds |
$24,900
|
show details |

|
#8
W Mcclure Ave
Peoria, IL 61607
|
832 sq. feet
|
1 baths 2 beds |
show details | |

|
#9
Meadow Ave
East Peoria, IL 61611
|
- sq. feet
|
1 baths 2 beds |
show details | |

|
#10
S Hanna City Glasford Rd
Hanna City, IL 61536
|
1,162 sq. feet
|
1 baths 2 beds |
show details |
| Photo | Address | Area | Beds / Baths | Price | Details |
|---|---|---|---|---|---|

|
#11
E High St
Creve Coeur, IL 61610
|
1,095 sq. feet
|
1 baths 3 beds |
show details | |

|
#12
S Granville Ave
Peoria, IL 61607
|
2,412 sq. feet
|
2 baths 4 beds |
show details | |

|
#13
N Hamilton Rd
Peoria, IL 61614
|
- sq. feet
|
2 baths 4 beds |
show details | |

|
#14
Ave
Peoria, IL 61603
|
756 sq. feet
|
1 baths 3 beds |
show details | |

|
#15
W Thrush Ave
Peoria, IL 61604
|
1,142 sq. feet
|
2 baths 3 beds |
show details | |

|
#16
E Corrington Ave
Peoria, IL 61603
|
2,218 sq. feet
|
1 baths 4 beds |
show details | |

|
#17
N Galena Rd
Peoria Heights, IL 61616
|
2,494 sq. feet
|
3 baths 3 beds |
show details | |

|
#18
W Shenandoah Dr
Peoria, IL 61614
|
1,332 sq. feet
|
2 baths 2 beds |
show details | |

|
#19
Sun Valley Ct
East Peoria, IL 61611
|
1,060 sq. feet
|
1 baths 3 beds |
show details | |

|
#20
N Underhill St
Peoria, IL 61604
|
940 sq. feet
|
1 baths 3 beds |
show details |
| Photo | Address | Area | Beds / Baths | Price | Details |
|---|---|---|---|---|---|

|
#21
N 3rd St
Chillicothe, IL 61523
|
- sq. feet
|
- baths - beds |
$34,500
|
show details |

|
#22
W Corrington Ave
Peoria, IL 61604
|
1,504 sq. feet
|
2 baths 3 beds |
show details | |

|
#23
Illini Dr
Sparland, IL 61565
|
1,840 sq. feet
|
2 baths 3 beds |
show details | |

|
#24
N Saint Michael Ave
Peoria, IL 61615
|
1,653 sq. feet
|
2 baths 4 beds |
show details | |

|
#25
N Harper Ter
Peoria, IL 61604
|
1,388 sq. feet
|
2 baths 3 beds |
show details | |

|
#26
W Southport Rd
Peoria, IL 61615
|
1,006 sq. feet
|
1 baths 2 beds |
show details | |

|
#27
W Garden St
Peoria, IL 61605
|
950 sq. feet
|
1 baths 5 beds |
show details | |

|
#28
W Albany Ave
Peoria, IL 61604
|
1,014 sq. feet
|
1 baths 3 beds |
show details | |

|
#29
N Mccabe Dr
Chillicothe, IL 61523
|
1,104 sq. feet
|
1 baths 3 beds |
show details | |

|
#30
N Safford Dr
Peoria, IL 61615
|
912 sq. feet
|
1 baths 2 beds |
show details |
| Photo | Address | Area | Beds / Baths | Price | Details |
|---|---|---|---|---|---|

|
#31
W Detweiller Dr
Peoria, IL 61615
|
2,379 sq. feet
|
3 baths 3 beds |
show details | |

|
#32
N Oxford Pl
Peoria, IL 61614
|
1,844 sq. feet
|
2 baths 3 beds |
show details | |

|
#33
Ricketts Ave
Peoria, IL 61607
|
1,952 sq. feet
|
3 baths 3 beds |
show details | |

|
#34
E Willcox Ave
Peoria, IL 61603
|
844 sq. feet
|
1 baths 2 beds |
show details | |

|
#35
W Heading Ave
Peoria, IL 61604
|
1,040 sq. feet
|
2 baths 3 beds |
show details | |

|
#36
N Bourland Ave
Peoria, IL 61604
|
792 sq. feet
|
1 baths 2 beds |
show details | |

|
#37
W Meadows Pl
Peoria, IL 61604
|
818 sq. feet
|
1 baths 2 beds |
show details | |

|
#38
Fischer Rd
Creve Coeur, IL 61610
|
1,444 sq. feet
|
1 baths 3 beds |
show details | |

|
#39
S Stewart St
Creve Coeur, IL 61610
|
1,364 sq. feet
|
1 baths 4 beds |
show details | |

|
#40
S Stewart St
Creve Coeur, IL 61610
|
1,152 sq. feet
|
1 baths 3 beds |
show details |
| Photo | Address | Area | Beds / Baths | Price | Details |
|---|---|---|---|---|---|

|
#41
W Antoinette St
Peoria, IL 61605
|
496 sq. feet
|
1 baths 1 beds |
show details | |

|
#42
W Ann St
Peoria, IL 61605
|
1,474 sq. feet
|
1 baths 3 beds |
show details | |

|
#43
N Underhill St
Peoria, IL 61606
|
1,532 sq. feet
|
1 baths 3 beds |
show details | |

|
#44
W Howett St
Peoria, IL 61605
|
1,088 sq. feet
|
1 baths 3 beds |
show details | |

|
#45
W Howett St
Peoria, IL 61605
|
800 sq. feet
|
1 baths 2 beds |
show details | |

|
#46
W Jo Dan Ct
Hanna City, IL 61536
|
1,408 sq. feet
|
1 baths 3 beds |
show details | |

|
#47
W Butler St
Peoria, IL 61605
|
1,905 sq. feet
|
1 baths 2 beds |
show details | |

|
#48
W Howett St
Peoria, IL 61605
|
1,275 sq. feet
|
1 baths 2 beds |
show details | |

|
#49
W Kettelle St
Peoria, IL 61605
|
1,006 sq. feet
|
1 baths 2 beds |
show details | |

|
Check over 1 million property listings on Foreclosure.com!
|
browse all offers | |||

Latest news about housing in Dunlap, IL collected exclusively by city-data.com from local newspapers, TV, and radio stations

 | Washington/Germantown Hills/Chillicothe/Dunlap (5 replies) |
| Trouble finding rental homes in Peoria Area (4 replies) |
| Peoria, IL - Housing options (9 replies) |
| What can you tell me about the El Vista neighborhood in Peoria? (4 replies) |
| Interesting/quirky/off-the-beaten-path stuff to see in non-Chicagoland IL? (13 replies) |
| PEORIA: advice needed (15 replies) |

Median year apartment built: 1968
Household type by relationship:
Households: 1,395- Male householders: 254 (33 living alone), Female householders: 257 (26 living alone)
346 spouses (336 opposite-sex spouses), 13 unmarried partners, (13 opposite-sex unmarried partners), 442 children (395 natural, 35 adopted, 10 stepchildren), 24 grandchildren, 0 brothers or sisters, 19 parents, 0 foster children, 25 other relatives, 10 non-relatives
Size of family households: 205 2-persons, 140 3-persons, 70 4-persons, 15 5-persons, 16 6-persons, 9 7-or-more-persons.
Size of nonfamily households: 61 1-person, 18 2-persons, 1 4-persons.
280 married couples with children.
57 single-parent households (31 men, 26 women).
93.6% of residents of Dunlap speak English at home.
1.8% of residents speak Spanish at home (46% speak English very well, 8% speak English well, 46% speak English not well).
2.1% of residents speak other Indo-European language at home (100% speak English very well).
1.7% of residents speak Asian or Pacific Island language at home (100% speak English very well).
0.1% of residents speak other language at home (100% speak English very well).
Foreign born population: 49 (3.5%)
(26.5% of them are naturalized citizens)
| Here: | 8.1 |
| State: | 6.4 |
| Here: | 5.2 |
| State: | 4.1 |

- Bedrooms in owner-occupied houses and condos in Dunlap, Illinois
- 3no bedroom
- 01 bedroom
- 302 bedrooms
- 1473 bedrooms
- 1764 bedrooms
- 755+ bedrooms

- Bedrooms in renter-occupied apartments in Dunlap, Illinois
- 3no bedroom
- 101 bedroom
- 482 bedrooms
- 393 bedrooms
- 34 bedrooms
- 05+ bedrooms

- Cars and other vehicles available in Dunlap in owner-occupied houses/condos
- 5no vehicle
- 561 vehicle
- 2012 vehicles
- 1013 vehicles
- 464 vehicles
- 235+ vehicles

- Cars and other vehicles available in Dunlap in renter-occupied apartments
- 0no vehicle
- 481 vehicle
- 202 vehicles
- 363 vehicles
- 04 vehicles
- 05+ vehicles

- Rooms in owner-occupied houses in Dunlap, Illinois
- 31 room
- 02 rooms
- 03 rooms
- 254 rooms
- 415 rooms
- 516 rooms
- 717 rooms
- 598 rooms
- 1819+ rooms

- Rooms in renter-occupied apartments in Dunlap, Illinois
- 31 room
- 02 rooms
- 163 rooms
- 94 rooms
- 325 rooms
- 406 rooms
- 07 rooms
- 38 rooms
- 09+ rooms


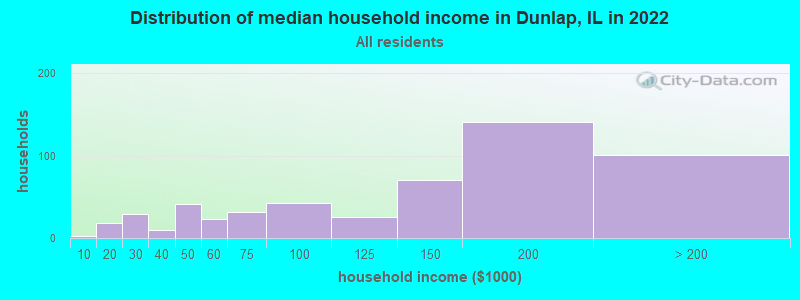
Dunlap, IL household income distribution

- 2Less than $10,000
- 18$10,000 to $19,999
- 29$20,000 to $29,999
- 10$30,000 to $39,999
- 41$40,000 to $49,999
- 23$50,000 to $59,999
- 31$60,000 to $74,999
- 42$75,000 to $99,999
- 26$100,000 to $124,999
- 71$125,000 to $149,999
- 141$150,000 to $199,999
- 101$200,000 or more
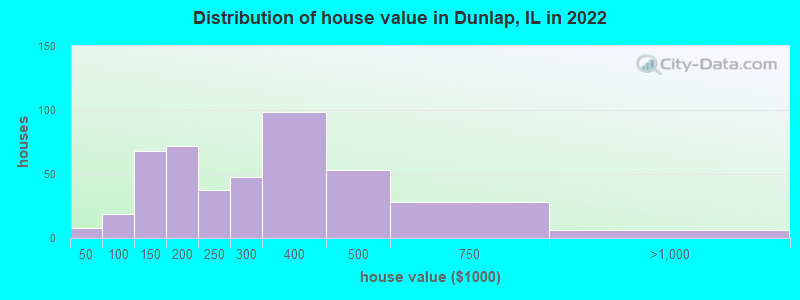
Home value of owner - occupied houses in 2022 in Dunlap, IL
-
- 3$10,000 to $14,999
- 4$20,000 to $24,999
- 8$50,000 to $59,999
- 5$80,000 to $89,999
- 4$90,000 to $99,999
- 34$100,000 to $124,999
- 34$125,000 to $149,999
- 55$150,000 to $174,999
- 16$175,000 to $199,999
- 37$200,000 to $249,999
- 47$250,000 to $299,999
- 98$300,000 to $399,999
- 52$400,000 to $499,999
- 28$500,000 to $749,999
- 6$750,000 to $999,999
Rent paid by renters in 2022 in Dunlap, IL
-
- 9$500 to $549
- 6$550 to $599
- 37$600 to $649
- 15$650 to $699
- 2$700 to $749
- 16$750 to $799
- 2$800 to $899
- 2$900 to $999
- 6$1,000 to $1,249
- 4$1,500 to $1,999
- 2No cash rent

Percentage of workers working in this county: 85.2%
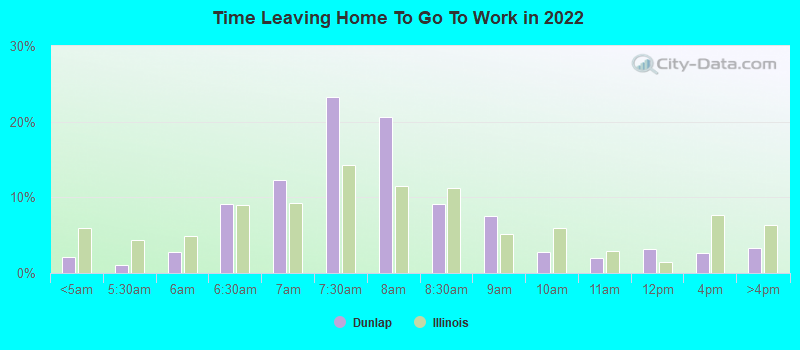
Number of people working at home: 116 (17.0% of all workers)
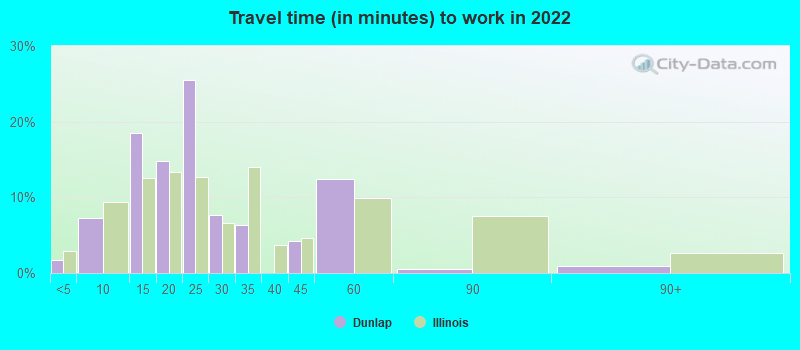
Travel time to work (commute)
- Less than 5 minutes: 22
- 5 to 9 minutes: 28
- 10 to 14 minutes: 112
- 15 to 19 minutes: 81
- 20 to 24 minutes: 215
- 25 to 29 minutes: 39
- 30 to 34 minutes: 62
- 35 to 39 minutes: 0
- 40 to 44 minutes: 7
- 45 to 59 minutes: 6
- 60 to 89 minutes: 2
- 90 or more minutes: 13
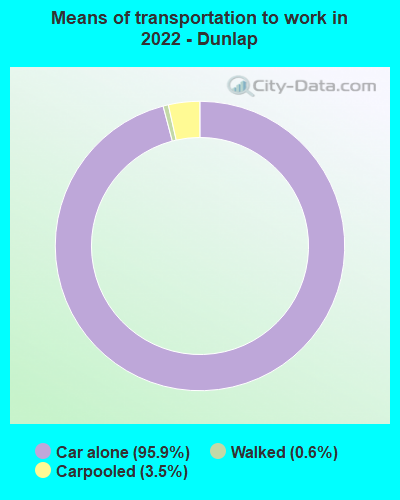
Means of transportation to work:
- Drove a car alone: 462 (77.1%)
- Carpooled: 19 (3.2%)
- Walked: 2 (0.3%)
- Worked at home: 126 (21.0%)
- Unemployment by race in 2022
- Unemployment rate for White non-Hispanic residents
- 3.2%Males
- 1.1%Females
- Unemployment rate for Asian residents
- 10.0%Males

- Year of entry for the foreign-born population in Dunlap, Illinois
- 292010 or later
- 222000 to 2009
- 31990 to 1999
- 61980 to 1989
- 21970 to 1979
- 3Before 1970

First ancestries reported:
- Irish: 126 (19.9%)
- English: 121 (19.1%)
- German: 91 (14.3%)
- American: 87 (13.7%)
- European: 11 (1.7%)
- Scandinavian: 9 (1.4%)
- Swedish: 8 (1.3%)
- Dutch: 5 (0.8%)
- Polish: 5 (0.8%)
- Scotch-Irish: 4 (0.6%)
- Italian: 2 (0.3%)
- Scottish: 2 (0.3%)
- Ethiopian: 2 (0.3%)
- Welsh: 1 (0.2%)
Most common places of birth for foreign-born residents (%):
| Dunlap: | 41.7% (25) |
| Illinois: | 9.2% (166,409) |
| Dunlap: | 18.3% (11) |
| Illinois: | 5.2% (93,003) |
| Dunlap: | 11.7% (7) |
| Illinois: | 0.1% (2,458) |
| Dunlap: | 5.0% (3) |
| Illinois: | 0.0% (679) |
| Dunlap: | 5.0% (3) |
| Illinois: | 1.3% (22,793) |
| Dunlap: | 3.3% (2) |
| Illinois: | 6.9% (124,474) |
| Dunlap: | 3.3% (2) |
| Illinois: | 0.3% (4,775) |
| Dunlap: | 3.3% (2) |
| Illinois: | 1.1% (19,306) |
Place of birth for U.S.-born residents:
- This state: 1,080
- Other state: 251
- Northeast: 23
- Midwest: 123
- South: 60
- West: 44
84.6% of Dunlap residents lived in the same house 1 years ago.
Out of people who lived in different houses, 28.7% lived in this county.
Out of people who lived in different counties, 48.3% lived in Illinois.
| Dunlap: | 84.6% |
| State average: | 88.3% |
Education attainment for males 25 years and older:
- No schooling: 0
- Nursery to 4th grade: 0
- 5th and 6th grade: 0
- 7th and 8th grade: 0
- 9th grade: 0
- 10th grade: 11
- 11th grade: 27
- 12th grade, no diploma: 3
- High school graduate (or equivalency): 59
- Less than 1 year of college: 22
- Some college more than 1 year, no degree: 38
- Associate degree: 38
- Bachelor's degree: 97
- Master's degree: 96
- Professional school degree: 33
- Doctorate degree: 24

Education attainment for females 25 years and older:
- No schooling: 0
- Nursery to 4th grade: 0
- 5th and 6th grade: 7
- 7th and 8th grade: 0
- 9th grade: 2
- 10th grade: 2
- 11th grade: 2
- 12th grade, no diploma: 12
- High school graduate (or equivalency): 82
- Less than 1 year of college: 34
- Some college more than 1 year, no degree: 32
- Associate degree: 33
- Bachelor's degree: 142
- Master's degree: 97
- Professional school degree: 17
- Doctorate degree: 23


Housing units in structures:
- One, detached: 503
- One, attached: 3
- Two: 10
- 3 or 4: 12
- 5 to 9: 28
- Mobile homes: 3
Housing units lacking complete kitchen facilities in 2022: 6.4%
House/condo owner moved in on average 11 years ago
Renter moved in on average 8 years ago

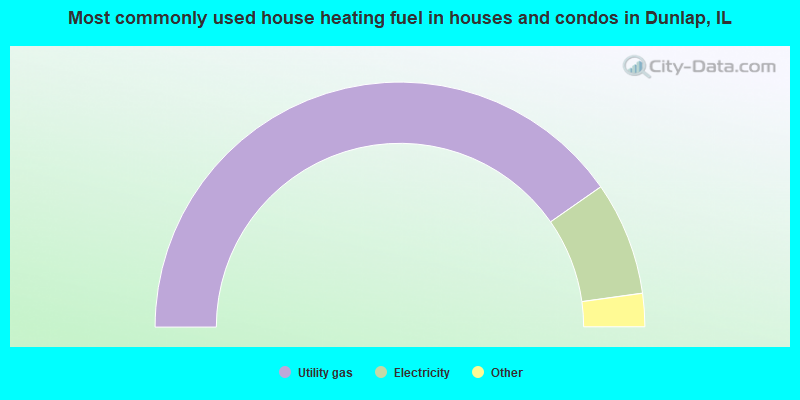
- 80.7%Utility gas
- 15.0%Electricity
- 1.7%Bottled, tank, or LP gas
- 1.7%Other fuel
- 1.0%Wood
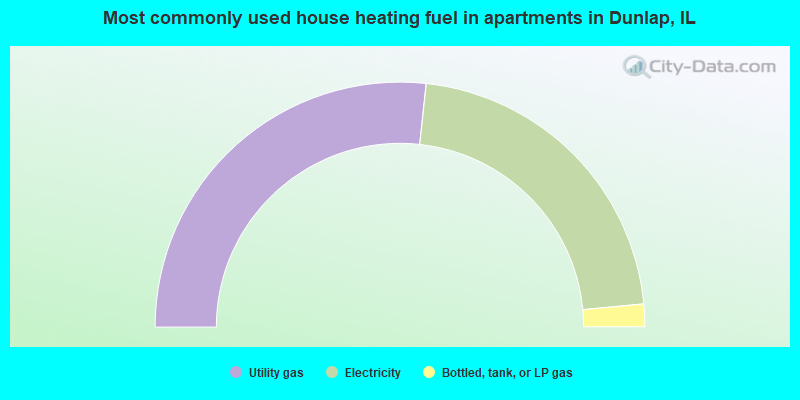
- 53.5%Utility gas
- 43.6%Electricity
- 3.0%Bottled, tank, or LP gas
Private vs. public school enrollment:
| Here: | 5.5% |
| Illinois: | 13.3% |
| Here: | 3.0% |
| Illinois: | 9.9% |
| Here: | 6.7% |
| Illinois: | 27.4% |


