Durham, CT (Connecticut) Houses and Residents
| Durham: | $387,208 |
| Connecticut: | $347,200 |
Mean price in 2022:
Detached houses: $372,800
Here: $372,800 State: $503,946
Total population: 2,933 (Urban population: 2,136, Rural population: 659 (19 farm, 640 nonfarm))
Houses: 1,467 (1,467 occupied: 1,312 owner occupied, 170 renter occupied)
| % of renters here: | 11% |
| State: | 34% |
Housing density: 234 houses/condos per square mile
Median price asked for vacant for-sale houses and condos in 2022 in this county: $431,754.
Median contract rent in 2022: $1,605 (lower quartile is $1,208, upper quartile is $1,821)
Median rent asked for vacant for-rent units in 2022: $1,774
Median gross rent in Durham, CT in 2022: $1,747
Housing units in Durham with a mortgage: 865 (76 second mortgage, 0 home equity loan, 78 both second mortgage and home equity loan)
Houses without a mortgage: 46
Median household income for houses/condos with a mortgage: $131,493
Median household income for apartments without a mortgage: $125,255
Median monthly housing costs: $1,985
Compare current foreclosures near Durham, CT:
| Photo | Address | Area | Beds / Baths | Price | Details |
|---|---|---|---|---|---|

|
#1
Haddam Quarter Rd
Durham, CT 06422
|
- sq. feet
|
- baths - beds |
show details | |

|
#2
Trinity Hill Dr
Durham, CT 06422
|
- sq. feet
|
- baths - beds |
show details | |

|
#3
Ozick Dr Ste 1
Durham, CT 06422
|
- sq. feet
|
- baths - beds |
show details | |

|
#4
Roosevelt St
New Britain, CT 06051
|
1,536 sq. feet
|
2 baths 3 beds |
$299,900
|
show details |

|
#5
Willis Ave
Meriden, CT 06450
|
1,008 sq. feet
|
1 baths 2 beds |
$299,900
|
show details |

|
#6
Winchester Ave
Hamden, CT 06517
|
1,820 sq. feet
|
2 baths 5 beds |
$489,900
|
show details |

|
#7
Winthrop Blvd
Cromwell, CT 06416
|
1,092 sq. feet
|
1 baths 3 beds |
$220,000
|
show details |

|
#8
Fairview Ave # U-2
Hamden, CT 06514
|
1,284 sq. feet
|
1 baths 3 beds |
$174,000
|
show details |

|
#9
Railroad Ave
Chester, CT 06412
|
2,092 sq. feet
|
2 baths 4 beds |
$484,900
|
show details |

|
#10
Birchwood Dr
Hamden, CT 06518
|
2,604 sq. feet
|
2 baths 3 beds |
$614,900
|
show details |
| Photo | Address | Area | Beds / Baths | Price | Details |
|---|---|---|---|---|---|

|
#11
Peck St
Berlin, CT 06037
|
608 sq. feet
|
1 baths 1 beds |
$144,900
|
show details |

|
#12
Hidden Valley Dr
Meriden, CT 06451
|
2,264 sq. feet
|
2 baths 4 beds |
show details | |

|
#13
Dora Dr
New Haven, CT 06513
|
1,302 sq. feet
|
1 baths 3 beds |
show details | |

|
#14
W Main St
New Britain, CT 06053
|
1,584 sq. feet
|
2 baths 4 beds |
show details | |

|
#15
Fawn Dr
Meriden, CT 06451
|
1,766 sq. feet
|
2 baths 4 beds |
show details | |

|
#16
Florida Rd
East Haddam, CT 06423
|
1,734 sq. feet
|
2 baths 3 beds |
show details | |

|
#17
Middletown Ave
Wethersfield, CT 06109
|
1,372 sq. feet
|
1 baths 4 beds |
show details | |

|
#18
Spring St
Meriden, CT 06451
|
660 sq. feet
|
1 baths 3 beds |
show details | |

|
#19
Windsor Rd
Hamden, CT 06517
|
1,116 sq. feet
|
3 baths 4 beds |
show details | |

|
#20
Amity St
Meriden, CT 06450
|
1,568 sq. feet
|
2 baths 3 beds |
show details |
| Photo | Address | Area | Beds / Baths | Price | Details |
|---|---|---|---|---|---|

|
#21
Horne Cir
Southington, CT 06489
|
1,902 sq. feet
|
2 baths 4 beds |
show details | |

|
#22
Park Rd
Marlborough, CT 06447
|
1,134 sq. feet
|
1 baths 3 beds |
show details | |

|
#23
Stanley St
New Britain, CT 06051
|
1,890 sq. feet
|
1 baths 3 beds |
show details | |

|
#24
Whiting St
Hamden, CT 06514
|
1,508 sq. feet
|
2 baths 4 beds |
show details | |

|
#25
Center St
Wallingford, CT 06492
|
2,412 sq. feet
|
1 baths 2 beds |
show details | |

|
#26
Shawmut Ave
North Haven, CT 06473
|
1,152 sq. feet
|
1 baths 3 beds |
show details | |

|
#27
Orient St
Meriden, CT 06450
|
1,780 sq. feet
|
3 baths 3 beds |
show details | |

|
#28
Pratt St
Meriden, CT 06450
|
1,040 sq. feet
|
2 baths 3 beds |
show details | |

|
#29
21 Webster St
New Britain, CT 06051
|
3 sq. feet
|
2 baths 6 beds |
show details | |

|
#30
Robin Ln
Cheshire, CT 06410
|
1,641 sq. feet
|
2 baths 3 beds |
show details |
| Photo | Address | Area | Beds / Baths | Price | Details |
|---|---|---|---|---|---|

|
#31
Bowen St
Hamden, CT 06514
|
1,190 sq. feet
|
1 baths 2 beds |
show details | |

|
#32
City Ave
New Britain, CT 06051
|
1,932 sq. feet
|
1 baths 3 beds |
show details | |

|
#33
Tom Swamp Rd
Hamden, CT 06518
|
2,008 sq. feet
|
2 baths 3 beds |
show details | |

|
#34
Evansville Ave
Meriden, CT 06451
|
624 sq. feet
|
1 baths 3 beds |
show details | |

|
#35
Richard St Apt 2
Newington, CT 06111
|
710 sq. feet
|
1 baths 1 beds |
show details | |

|
#36
Borrmann Rd
East Haven, CT 06512
|
1,222 sq. feet
|
2 baths 4 beds |
show details | |

|
#37
Robbins Ave
Newington, CT 06111
|
1,346 sq. feet
|
2 baths 3 beds |
show details | |

|
#38
Feather Ln
North Branford, CT 06471
|
4,408 sq. feet
|
2 baths 4 beds |
show details | |

|
#39
Butternut Ln
Rocky Hill, CT 06067
|
1,176 sq. feet
|
1 baths 2 beds |
show details | |

|
#40
Barbara Dr
Waterbury, CT 06705
|
1,248 sq. feet
|
2 baths 3 beds |
show details |
| Photo | Address | Area | Beds / Baths | Price | Details |
|---|---|---|---|---|---|

|
#41
Mount Parnassus Rd
East Haddam, CT 06423
|
2,328 sq. feet
|
3 baths 3 beds |
show details | |

|
#42
Old Fairwood Rd
Bethany, CT 06524
|
2,464 sq. feet
|
3 baths 4 beds |
show details | |

|
#43
Pond St
New Britain, CT 06051
|
2,400 sq. feet
|
2 baths 6 beds |
show details | |

|
#44
Ingram St
Hamden, CT 06517
|
1,592 sq. feet
|
1 baths 3 beds |
show details | |

|
#45
E Gate Ln
Hamden, CT 06514
|
1,152 sq. feet
|
1 baths 2 beds |
show details | |

|
#46
Ramona Way
Branford, CT 06405
|
1,665 sq. feet
|
2 baths 3 beds |
show details | |

|
#47
Sunrise Cir
Newington, CT 06111
|
1,224 sq. feet
|
1 baths 2 beds |
show details | |

|
#48
Scenic View Dr Apt 21
Deep River, CT 06417
|
864 sq. feet
|
1 baths 2 beds |
show details | |

|
#49
Dunbar Hill Rd
Hamden, CT 06514
|
1,691 sq. feet
|
1 baths 3 beds |
show details | |

|
Check over 1 million property listings on Foreclosure.com!
|
browse all offers | |||

Latest news about housing in Durham, CT collected exclusively by city-data.com from local newspapers, TV, and radio stations

 | Current Real estate markets (3987 replies) |
| Old Colonial Homes/Country Living/Schools in CT (58 replies) |
| 2024 Connecticut Town Tournament VI (Celebrating the 10-Year Anniversary & Dazzleman's Memorial) (1044 replies) |
| Declining Home Values in Madison (64 replies) |
| First-time home buyer in New Haven area, recommendations (38 replies) |
| Connecticut TOWN TOURNAMENT V (2022) (831 replies) |

Median year apartment built: 1968
Household type by relationship:
Households: 3,483- Male householders: 943 (154 living alone), Female householders: 521 (235 living alone)
763 spouses (761 opposite-sex spouses), 164 unmarried partners, (164 opposite-sex unmarried partners), 854 children (809 natural, 45 adopted, 0 stepchildren), 0 grandchildren, 16 brothers or sisters, 51 parents, 0 foster children, 0 other relatives, 160 non-relatives
- In group quarters: 8
Size of family households: 496 2-persons, 167 3-persons, 205 4-persons, 77 5-persons.
Size of nonfamily households: 412 1-person, 97 2-persons, 23 3-persons.
525 married couples with children.
48 single-parent households (0 men, 48 women).
93.1% of residents of Durham speak English at home.
2.9% of residents speak other Indo-European language at home (100% speak English very well).
3.0% of residents speak Asian or Pacific Island language at home (100% speak English not well).
Foreign born population: 144 (4.1%)
(87.5% of them are naturalized citizens)
| Here: | 7.0 |
| State: | 6.5 |
| Here: | 4.9 |
| State: | 4.0 |

- Bedrooms in owner-occupied houses and condos in Durham, Connecticut
- 0no bedroom
- 871 bedroom
- 992 bedrooms
- 7173 bedrooms
- 3834 bedrooms
- 265+ bedrooms

- Bedrooms in renter-occupied apartments in Durham, Connecticut
- 0no bedroom
- 131 bedroom
- 1032 bedrooms
- 553 bedrooms
- 04 bedrooms
- 05+ bedrooms

- Cars and other vehicles available in Durham in owner-occupied houses/condos
- 49no vehicle
- 1721 vehicle
- 5632 vehicles
- 1893 vehicles
- 2744 vehicles
- 665+ vehicles

- Cars and other vehicles available in Durham in renter-occupied apartments
- 13no vehicle
- 1051 vehicle
- 392 vehicles
- 143 vehicles
- 04 vehicles
- 05+ vehicles

- Rooms in owner-occupied houses in Durham, Connecticut
- 01 room
- 02 rooms
- 163 rooms
- 874 rooms
- 1585 rooms
- 2336 rooms
- 3477 rooms
- 2148 rooms
- 2589+ rooms

- Rooms in renter-occupied apartments in Durham, Connecticut
- 01 room
- 02 rooms
- 133 rooms
- 274 rooms
- 985 rooms
- 06 rooms
- 07 rooms
- 08 rooms
- 339+ rooms


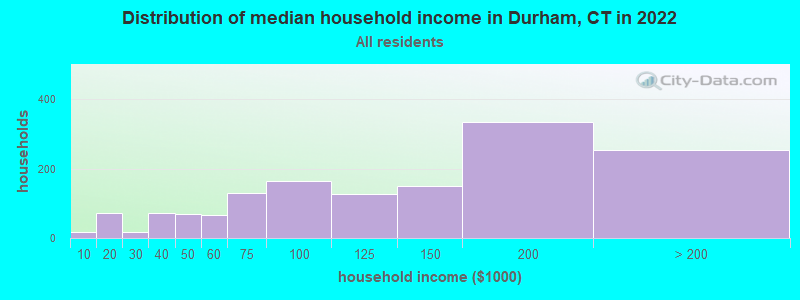
Durham, CT household income distribution

- 16Less than $10,000
- 71$10,000 to $19,999
- 18$20,000 to $29,999
- 73$30,000 to $39,999
- 70$40,000 to $49,999
- 66$50,000 to $59,999
- 129$60,000 to $74,999
- 165$75,000 to $99,999
- 128$100,000 to $124,999
- 151$125,000 to $149,999
- 335$150,000 to $199,999
- 254$200,000 or more
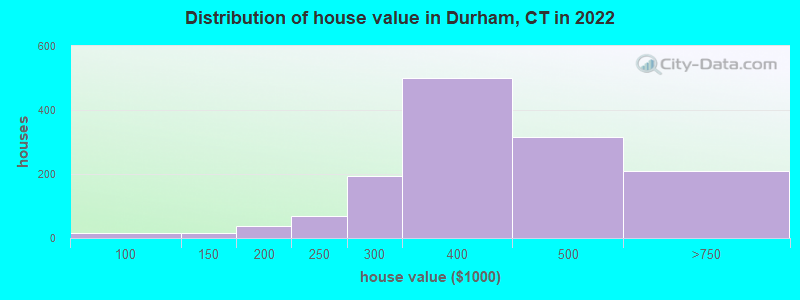
Home value of owner - occupied houses in 2022 in Durham, CT
-
- 4Less than $10,000
- 17$80,000 to $89,999
- 16$125,000 to $149,999
- 7$150,000 to $174,999
- 29$175,000 to $199,999
- 67$200,000 to $249,999
- 192$250,000 to $299,999
- 501$300,000 to $399,999
- 314$400,000 to $499,999
- 209$500,000 to $749,999
Rent paid by renters in 2022 in Durham, CT
-
- 10$350 to $399
- 27$1,000 to $1,249
- 13$1,250 to $1,499
- 101$1,500 to $1,999
- 19No cash rent


Percentage of workers working in this county: 52.7%
Number of people working at home: 476 (22.9% of all workers)
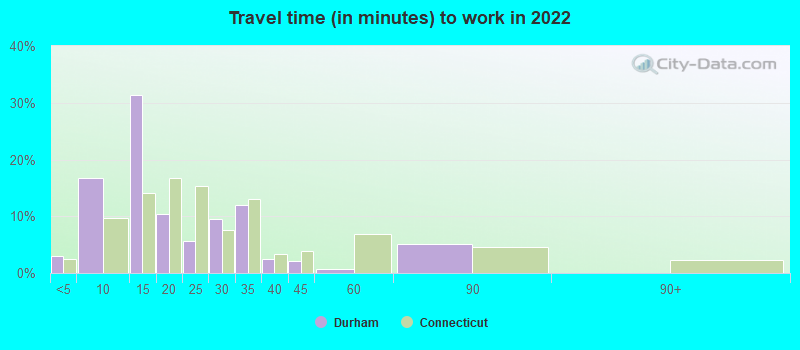
Travel time to work (commute)
- Less than 5 minutes: 50
- 5 to 9 minutes: 126
- 10 to 14 minutes: 124
- 15 to 19 minutes: 250
- 20 to 24 minutes: 383
- 25 to 29 minutes: 157
- 30 to 34 minutes: 210
- 35 to 39 minutes: 60
- 40 to 44 minutes: 88
- 45 to 59 minutes: 58
- 60 to 89 minutes: 116
- 90 or more minutes: 11
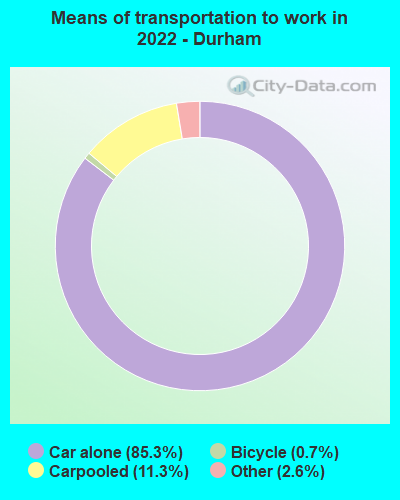
Means of transportation to work:
- Drove a car alone: 1,077 (63.2%)
- Carpooled: 151 (8.9%)
- Taxi: 39 (2.3%)
- Bicycle: 7 (0.4%)
- Worked at home: 476 (28.0%)

- Unemployment by race in 2022
- Unemployment rate for White non-Hispanic residents
- 9.3%Males
- 0.5%Females

- Year of entry for the foreign-born population in Durham, Connecticut
- 72010 or later
- 742000 to 2009
- 61990 to 1999
- 281980 to 1989
- 91970 to 1979
- 29Before 1970

First ancestries reported:
- English: 299 (20.8%)
- Italian: 262 (18.2%)
- Irish: 118 (8.2%)
- American: 115 (8.0%)
- Polish: 115 (8.0%)
- European: 105 (7.3%)
- Hungarian: 69 (4.8%)
- Swedish: 43 (3.0%)
- French: 33 (2.3%)
- French Canadian: 31 (2.2%)
- Latvian: 26 (1.8%)
- Danish: 20 (1.4%)
- Czechoslovakian: 17 (1.2%)
- Greek: 10 (0.7%)
Most common places of birth for foreign-born residents (%):
| Durham: | 50.0% (72) |
| Connecticut: | 0.3% (1,550) |
| Durham: | 11.8% (17) |
| Connecticut: | 1.2% (6,678) |
| Durham: | 11.1% (16) |
| Connecticut: | 4.4% (24,001) |
| Durham: | 2.8% (4) |
| Connecticut: | 0.6% (3,115) |
Place of birth for U.S.-born residents:
- This state: 2,676
- Other state: 615
- Northeast: 365
- Midwest: 31
- South: 45
- West: 186
89.6% of Durham residents lived in the same house 1 years ago.
Out of people who lived in different houses, 29.3% lived in this county.
Out of people who lived in different counties, 95.6% lived in Connecticut.
| Durham: | 89.6% |
| State average: | 88.4% |
Education attainment for males 25 years and older:
- No schooling: 61
- Nursery to 4th grade: 0
- 5th and 6th grade: 0
- 7th and 8th grade: 0
- 9th grade: 0
- 10th grade: 0
- 11th grade: 0
- 12th grade, no diploma: 30
- High school graduate (or equivalency): 538
- Less than 1 year of college: 142
- Some college more than 1 year, no degree: 181
- Associate degree: 85
- Bachelor's degree: 316
- Master's degree: 36
- Professional school degree: 11
- Doctorate degree: 78

Education attainment for females 25 years and older:
- No schooling: 88
- Nursery to 4th grade: 0
- 5th and 6th grade: 0
- 7th and 8th grade: 0
- 9th grade: 7
- 10th grade: 0
- 11th grade: 0
- 12th grade, no diploma: 0
- High school graduate (or equivalency): 281
- Less than 1 year of college: 62
- Some college more than 1 year, no degree: 72
- Associate degree: 50
- Bachelor's degree: 429
- Master's degree: 297
- Professional school degree: 19
- Doctorate degree: 28


Housing units in structures:
- One, detached: 1,350
- One, attached: 38
- Two: 18
- 3 or 4: 40
- Mobile homes: 20
House/condo owner moved in on average 16 years ago
Renter moved in on average 0 years ago

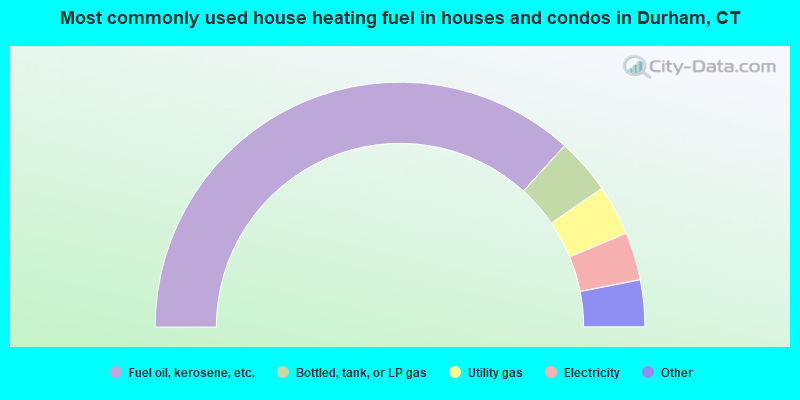
- 73.7%Fuel oil, kerosene, etc.
- 7.4%Bottled, tank, or LP gas
- 6.7%Utility gas
- 6.3%Electricity
- 3.7%Wood
- 2.3%Solar energy
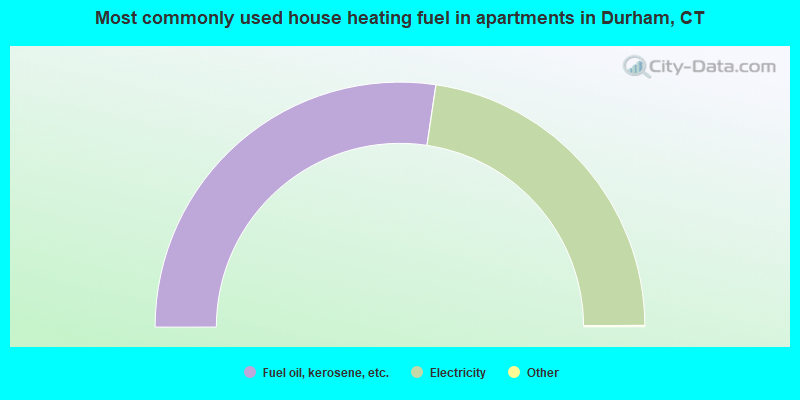
- 54.8%Fuel oil, kerosene, etc.
- 45.2%Electricity
Private vs. public school enrollment:
| Here: | 8.4% |
| Connecticut: | 9.5% |
| Here: | 44.0% |
| Connecticut: | 12.9% |
| Here: | 21.5% |
| Connecticut: | 35.5% |


