Dyer, IN (Indiana) Houses and Residents
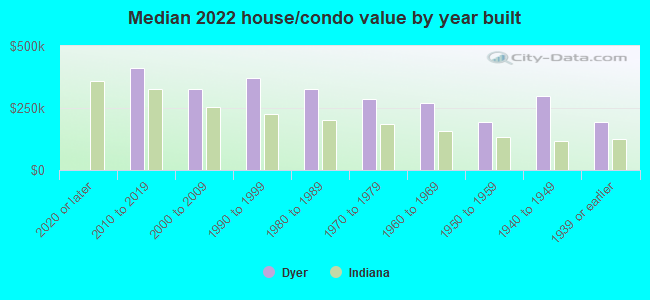
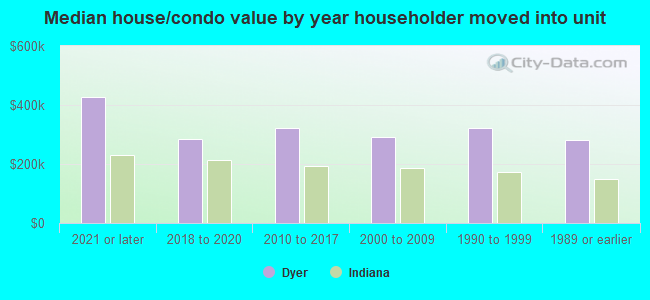
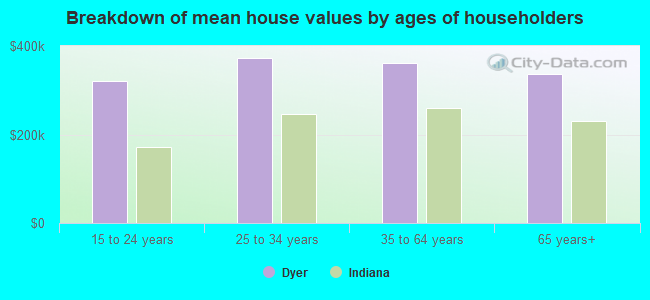
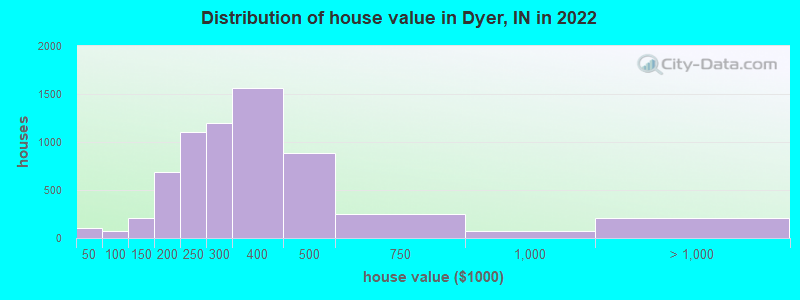
Estimated median house or condo value in 2022: $315,003 (it was $141,000 in 2000 )
Dyer:
$315,003Indiana:
$208,700
Lower value quartile - upper value quartile: $241,929 - $424,778Total population: 16,169 (Urban population: 13,856, Rural population: 0)
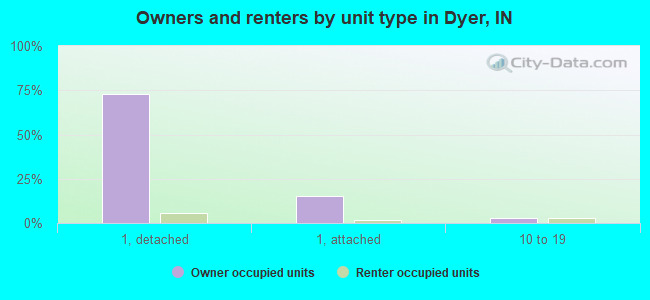
Houses: 6,554 (6,372 occupied: 5,668 owner occupied, 709 renter occupied )
% of renters here:
11%State:
29%
Housing density: 1,100 houses/condos per square mile
Median price asked for vacant for-sale houses and condos in 2022: $4,830,068.
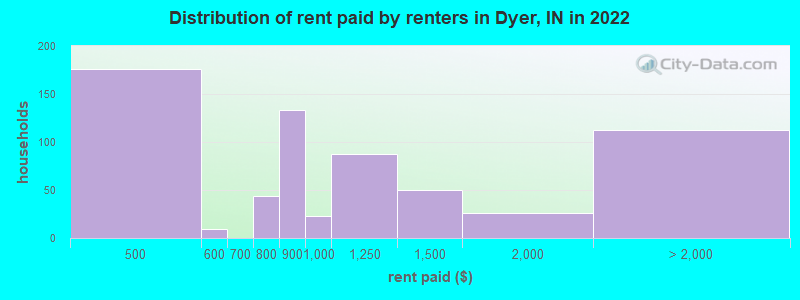
Median contract rent in 2022: $835
Median rent asked for vacant for-rent units in 2022: $638
Median gross rent in Dyer, IN in 2022: $1,141
Housing units in Dyer with a mortgage: 3,349 (373 second mortgage, 0 home equity loan, 374 both second mortgage and home equity loan )Houses without a mortgage: 126
Median household income for houses/condos with a mortgage: $122,551
Median household income for apartments without a mortgage: $85,028
Median monthly housing costs: $1,179
Data:
Median house or condo value ($)
Median house or condo value ($ change since 2000)
Median house or condo value ($) - White
Median house or condo value ($) - Black or African American
Median house or condo value ($) - Asian
Median house or condo value ($) - Hispanic or Latino
Median house or condo value ($) - American Indian and Alaska Native
Median house or condo value ($) - Multirace
Median house or condo value ($) - Other Race
Median price asked for mobile homes ($)
Household density (households per square mile)
Mean house or condo value by units in structure - 1, detached ($)
Mean house or condo value by units in structure - 1, attached ($)
Mean house or condo value by units in structure - 2 ($)
Mean house or condo value by units in structure by units in structure - 3 or 4 ($)
Mean house or condo value by units in structure - 5 or more ($)
Mean house or condo value by units in structure - Boat, RV, van, etc. ($)
Mean house or condo value by units in structure - Mobile home ($)
Median contract rent ($)
Median contract rent - Lower quartile ($)
Median contract rent - Upper quartile ($)
Median gross rent ($)
Urban houses (%)
Rural houses (%)
Houses occupied (%)
Houses occupied (% change since 2000)
Houses owner occupied (%)
Houses owner occupied (% change since 2000)
Houses renter occupied (%)
Houses renter occupied (% change since 2000)
Vacant housing units - For rent (%)
Vacant housing units - For rent (% change since 2000)
Vacant housing units - For sale only (%)
Vacant housing units - For sale only (% change since 2000)
Vacant housing units - Rented or sold, not occupied (%)
Vacant housing units - Rented or sold, not occupied (% change since 2000)
Vacant housing units - For seasonal, recreational, or occasional use (%)
Vacant housing units - For seasonal, recreational, or occasional use (% change since 2000)
Vacant housing units - For migrant workers (%)
Vacant housing units - For migrant workers (% change since 2000)
Vacant housing units - Other vacant (%)
Vacant housing units - Other vacant (% change since 2000)
Median monthly housing costs ($)
Median household income for houses/condos with a mortgage ($)
Median household income for houses/condos without a mortgage ($)
Median household income ($)
Median household income ($) - White
Median household income ($) - Black or African American
Median household income ($) - Asian
Median household income ($) - Hispanic or Latino
Median household income ($) - American Indian and Alaska Native
Median household income ($) - Multirace
Median household income ($) - Other Race
Mortgage status - with mortgage (%)
Mortgage status - with second mortgage (%)
Mortgage status - with home equity loan (%)
Mortgage status - with both second mortgage and home equity loan (%)
Mortgage status - without a mortgage (%)
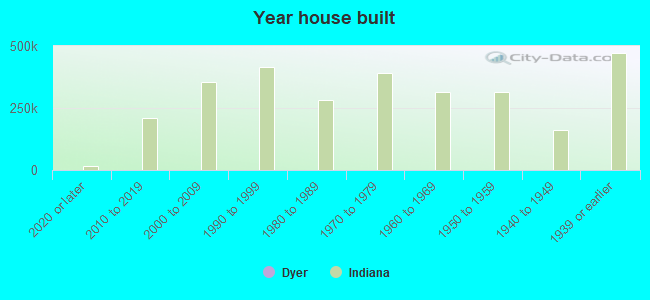
Median year house/condo built
Median year apartment built
Household type by relationship - Male householder living alone (%)
Household type by relationship - Male householder not living alone (%)
Household type by relationship - Female householder living alone (%)
Household type by relationship - Female householder not living alone (%)
Household type by relationship - Opposite-Sex spouse (%)
Household type by relationship - Same-Sex spouse (%)
Household type by relationship - Opposite-Sex unmarried partner (%)
Household type by relationship - Same-Sex unmarried partner (%)
Household type by relationship - In group quarters (%)
Size of family households - 2-person household (%)
Size of family households - 3-person household (%)
Size of family households - 4-person household (%)
Size of family households - 5-person household (%)
Size of family households - 6-person household (%)
Size of family households - 7-or-more-person household (%)
Size of nonfamily households - 1-person household (%)
Size of nonfamily households - 2-person household (%)
Size of nonfamily households - 3-person household (%)
Size of nonfamily households - 4-person household (%)
Size of nonfamily households - 5-person household (%)
Size of nonfamily households - 6-person household (%)
Size of nonfamily households - 7-or-moreperson household (%)
Year house built - Built 2010 or later (%)
Year house built - Built 2000 to 2009 (%)
Year house built - Built 1990 to 1999 (%)
Year house built - Built 1980 to 1989 (%)
Year house built - Built 1970 to 1979 (%)
Year house built - Built 1960 to 1969 (%)
Year house built - Built 1950 to 1959 (%)
Year house built - Built 1940 to 1949 (%)
Year house built - Built 1939 or earlier (%)
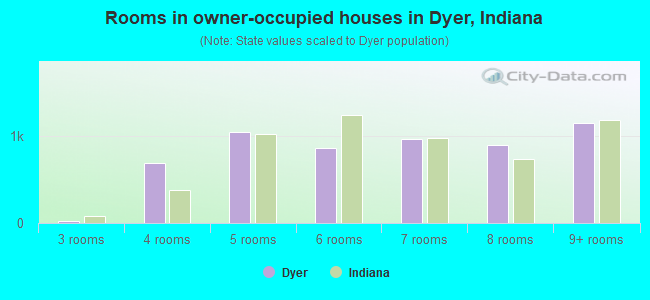
Median number of rooms in houses and condos
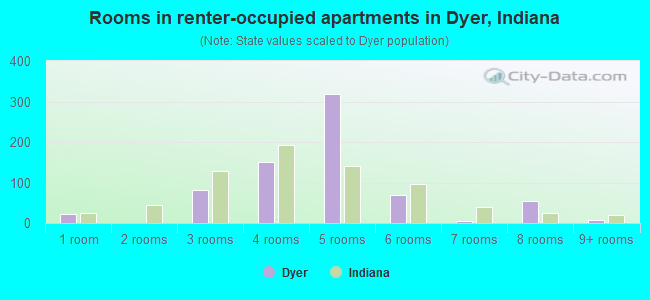
Median number of rooms in apartments
Median number of bedrooms in owner occupied houses
Mean number of bedrooms in owner occupied houses
Median number of bedrooms in renter occupied houses
Mean number of bedrooms in renter occupied houses
Median number of vehichles in owner occupied houses
Mean number of vehichles in owner occupied houses
Median number of vehichles in renter occupied houses
Mean number of vehichles in renter occupied houses
Rooms in owner-occupied houses - 1 room (%)
Rooms in owner-occupied houses - 2 rooms (%)
Rooms in owner-occupied houses - 3 rooms (%)
Rooms in owner-occupied houses - 4 rooms (%)
Rooms in owner-occupied houses - 5 rooms (%)
Rooms in owner-occupied houses - 6 rooms (%)
Rooms in owner-occupied houses - 7 rooms (%)
Rooms in owner-occupied houses - 8 rooms (%)
Rooms in owner-occupied houses - 9+ rooms (%)
Rooms in renter-occupied houses - 1 room (%)
Rooms in renter-occupied houses - 2 rooms (%)
Rooms in renter-occupied houses - 3 rooms (%)
Rooms in renter-occupied houses - 4 rooms (%)
Rooms in renter-occupied houses - 5 rooms (%)
Rooms in renter-occupied houses - 6 rooms (%)
Rooms in renter-occupied houses - 7 rooms (%)
Rooms in renter-occupied houses - 8 rooms (%)
Rooms in renter-occupied houses - 9+ rooms (%)
Bedrooms in owner-occupied houses - no bedrooms (%)
Bedrooms in owner-occupied houses - 1 bedroom (%)
Bedrooms in owner-occupied houses - 2 bedrooms (%)
Bedrooms in owner-occupied houses - 3 bedrooms (%)
Bedrooms in owner-occupied houses - 4 bedrooms (%)
Bedrooms in owner-occupied houses - 5+ bedrooms (%)
Bedrooms in renter-occupied houses - no bedrooms (%)
Bedrooms in renter-occupied houses - 1 bedroom (%)
Bedrooms in renter-occupied houses - 2 bedrooms (%)
Bedrooms in renter-occupied houses - 3 bedrooms (%)
Bedrooms in renter-occupied houses - 4 bedrooms (%)
Bedrooms in renter-occupied houses - 5+ bedrooms (%)
Vehicles available in owner-occupied houses - no vehicle available (%)
Vehicles available in owner-occupied houses - 1 vehicle available(%)
Vehicles available in owner-occupied houses - 2 Vehicles available (%)
Vehicles available in owner-occupied houses - 3 Vehicles available (%)
Vehicles available in owner-occupied houses - 4 Vehicles available (%)
Vehicles available in owner-occupied houses - 5+ Vehicles available (%)
Vehicles available in renter-occupied houses - no vehicle available (%)
Vehicles available in renter-occupied houses - 1 vehicle available (%)
Vehicles available in renter-occupied houses - 2 Vehicles available (%)
Vehicles available in renter-occupied houses - 3 Vehicles available (%)
Vehicles available in renter-occupied houses - 4 Vehicles available (%)
Vehicles available in renter-occupied houses - 5+ Vehicles available (%)
Housing units in structures - 1, detached (%)
Housing units in structures - 1, attached (%)
Housing units in structures - 2 (%)
Housing units in structures - 3 or 4 (%)
Housing units in structures - 5 to 9 (%)
Housing units in structures - 10 to 19 (%)
Housing units in structures - 20 to 49 (%)
Housing units in structures - 50 or more (%)
Housing units in structures - Mobile home (%)
Housing units in structures - Boat, RV, van, etc. (%)
Housing units in structures - Owners - 1, detached (%)
Housing units in structures - Owners - 1, attached (%)
Housing units in structures - Owners - 2 (%)
Housing units in structures - Owners - 3 or 4 (%)
Housing units in structures - Owners - 5 to 9 (%)
Housing units in structures - Owners - 10 to 19 (%)
Housing units in structures - Owners - 20 to 49 (%)
Housing units in structures - Owners - 50 or more (%)
Housing units in structures - Owners - Mobile home (%)
Housing units in structures - Owners - Boat, RV, van, etc. (%)
Housing units in structures - Renters - 1, detached (%)
Housing units in structures - Renters - 1, attached (%)
Housing units in structures - Renters - 2 (%)
Housing units in structures - Renters - 3 or 4 (%)
Housing units in structures - Renters - 5 to 9 (%)
Housing units in structures - Renters - 10 to 19 (%)
Housing units in structures - Renters - 20 to 49 (%)
Housing units in structures - Renters - 50 or more (%)
Housing units in structures - Renters - Mobile home (%)
Housing units in structures - Renters - Boat, RV, van, etc. (%)
House/condo owner moved in on average (years ago)
Renter moved in on average (years ago)
Year householder moved into unit - Moved in 1999 to March 2000 (%)
Year householder moved into unit - Moved in 1999 to March 2000 (%) - White
Year householder moved into unit - Moved in 1999 to March 2000 (%) - Black or African American
Year householder moved into unit - Moved in 1999 to March 2000 (%) - Asian
Year householder moved into unit - Moved in 1999 to March 2000 (%) - Hispanic or Latino
Year householder moved into unit - Moved in 1999 to March 2000 (%) - American Indian and Alaska Native
Year householder moved into unit - Moved in 1999 to March 2000 (%) - Multirace
Year householder moved into unit - Moved in 1999 to March 2000 (%) - Other Race
Year householder moved into unit - Moved in 1995 to 1998 (%)
Year householder moved into unit - Moved in 1995 to 1998 (%) - White
Year householder moved into unit - Moved in 1995 to 1998 (%) - Black or African American
Year householder moved into unit - Moved in 1995 to 1998 (%) - Asian
Year householder moved into unit - Moved in 1995 to 1998 (%) - Hispanic or Latino
Year householder moved into unit - Moved in 1995 to 1998 (%) - American Indian and Alaska Native
Year householder moved into unit - Moved in 1995 to 1998 (%) - Multirace
Year householder moved into unit - Moved in 1995 to 1998 (%) - Other Race
Year householder moved into unit - Moved in 1990 to 1994 (%)
Year householder moved into unit - Moved in 1990 to 1994 (%) - White
Year householder moved into unit - Moved in 1990 to 1994 (%) - Black or African American
Year householder moved into unit - Moved in 1990 to 1994 (%) - Asian
Year householder moved into unit - Moved in 1990 to 1994 (%) - Hispanic or Latino
Year householder moved into unit - Moved in 1990 to 1994 (%) - American Indian and Alaska Native
Year householder moved into unit - Moved in 1990 to 1994 (%) - Multirace
Year householder moved into unit - Moved in 1990 to 1994 (%) - Other Race
Year householder moved into unit - Moved in 1980 to 1989 (%)
Year householder moved into unit - Moved in 1980 to 1989 (%) - White
Year householder moved into unit - Moved in 1980 to 1989 (%) - Black or African American
Year householder moved into unit - Moved in 1980 to 1989 (%) - Asian
Year householder moved into unit - Moved in 1980 to 1989 (%) - Hispanic or Latino
Year householder moved into unit - Moved in 1980 to 1989 (%) - American Indian and Alaska Native
Year householder moved into unit - Moved in 1980 to 1989 (%) - Multirace
Year householder moved into unit - Moved in 1980 to 1989 (%) - Other Race
Year householder moved into unit - Moved in 1970 to 1979 (%)
Year householder moved into unit - Moved in 1970 to 1979 (%) - White
Year householder moved into unit - Moved in 1970 to 1979 (%) - Black or African American
Year householder moved into unit - Moved in 1970 to 1979 (%) - Asian
Year householder moved into unit - Moved in 1970 to 1979 (%) - Hispanic or Latino
Year householder moved into unit - Moved in 1970 to 1979 (%) - American Indian and Alaska Native
Year householder moved into unit - Moved in 1970 to 1979 (%) - Multirace
Year householder moved into unit - Moved in 1970 to 1979 (%) - Other Race
Year householder moved into unit - Moved in 1969 or earlier (%)
Year householder moved into unit - Moved in 1969 or earlier (%) - White
Year householder moved into unit - Moved in 1969 or earlier (%) - Black or African American
Year householder moved into unit - Moved in 1969 or earlier (%) - Asian
Year householder moved into unit - Moved in 1969 or earlier (%) - Hispanic or Latino
Year householder moved into unit - Moved in 1969 or earlier (%) - American Indian and Alaska Native
Year householder moved into unit - Moved in 1969 or earlier (%) - Multirace
Year householder moved into unit - Moved in 1969 or earlier (%) - Other Race
Housing units lacking complete plumbing facilities (%)
Housing units lacking complete kitchen facilities (%)
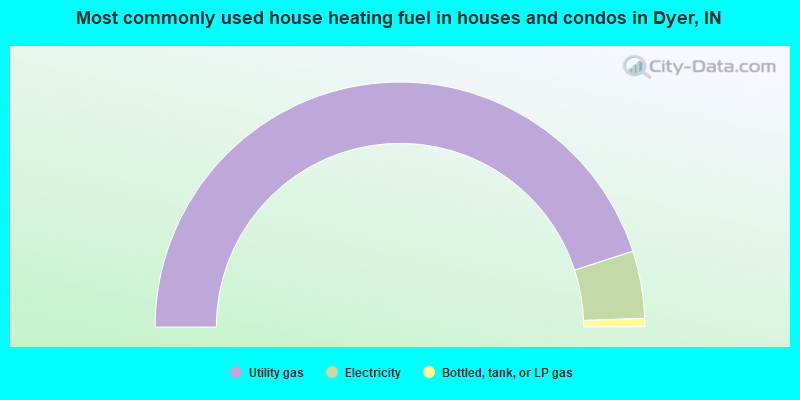
House heating fuel used in houses and condos - Utility gas (%)
House heating fuel used in houses and condos - Bottled, tank, or LP gas (%)
House heating fuel used in houses and condos - Electricity (%)
House heating fuel used in houses and condos - Fuel oil, kerosene, etc. (%)
House heating fuel used in houses and condos - Coal or coke (%)
House heating fuel used in houses and condos - Wood (%)
House heating fuel used in houses and condos - Solar energy (%)
House heating fuel used in houses and condos - Other fuel (%)
House heating fuel used in houses and condos - No fuel used (%)
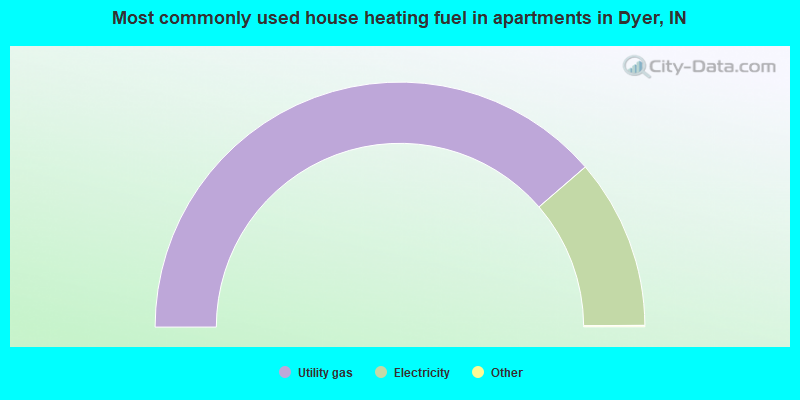
House heating fuel used in apartments - Utility gas (%)
House heating fuel used in apartments - Bottled, tank, or LP gas (%)
House heating fuel used in apartments - Electricity (%)
House heating fuel used in apartments - Fuel oil, kerosene, etc. (%)
House heating fuel used in apartments - Coal or coke (%)
House heating fuel used in apartments - Wood (%)
House heating fuel used in apartments - Solar energy (%)
House heating fuel used in apartments - Other fuel (%)
House heating fuel used in apartments - No fuel used (%)
Latest news about housing in Dyer, IN collected exclusively by city-data.com from local newspapers, TV, and radio stations
Median year house/condo built: 1992Median year apartment built: 1990Household type by relationship:
Households: 16,473
Male householders: 2,933 (462 living alone ), Female householders: 3,393 (846 living alone )3,431 spouses (3,413 opposite-sex spouses ), 579 unmarried partners , (579 opposite-sex unmarried partners ), 4,917 children (4,717 natural , 101 adopted , 98 stepchildren ), 300 grandchildren , 26 brothers or sisters , 159 parents , 0 foster children , 149 other relatives , 263 non-relatives In group quarters: 318
Size of family households: 2,569 2-persons , 849 3-persons , 727 4-persons , 339 5-persons , 145 6-persons , 25 7-or-more-persons .
Size of nonfamily households: 1,341 1-person , 331 2-persons , 9 5-persons .
2,311 married couples with children. single-parent households (47 men , 612 women ).
89.6% of residents of Dyer speak English at home. of residents speak Spanish at home (88% speak English very well , 8% speak English well , 5% speak English not well ).of residents speak other Indo-European language at home (72% speak English very well , 22% speak English well , 3% speak English not well , 4% don't speak English at all ).of residents speak Asian or Pacific Island language at home (43% speak English very well , 29% speak English well , 28% speak English not well ).of residents speak other language at home (32% speak English very well , 68% speak English well ).
Foreign born population: 1,216 (7.4%)of them are naturalized citizens )
Median number of rooms in houses and condos:
Median number of rooms in apartments
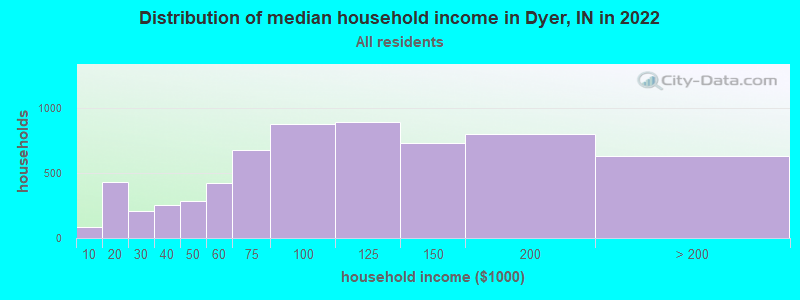
Dyer, IN household income distribution 85 Less than $10,000432 $10,000 to $19,999208 $20,000 to $29,999257 $30,000 to $39,999288 $40,000 to $49,999426 $50,000 to $59,999676 $60,000 to $74,999880 $75,000 to $99,999894 $100,000 to $124,999732 $125,000 to $149,999803 $150,000 to $199,999631 $200,000 or more
Home value of owner - occupied houses in 2022 in Dyer, IN 67 Less than $10,00029 $15,000 to $19,9994 $20,000 to $24,99951 $50,000 to $59,99917 $80,000 to $89,9996 $90,000 to $99,99969 $100,000 to $124,999141 $125,000 to $149,999385 $150,000 to $174,999305 $175,000 to $199,9991,105 $200,000 to $249,9991,197 $250,000 to $299,9991,566 $300,000 to $399,999886 $400,000 to $499,999250 $500,000 to $749,99971 $750,000 to $999,999136 $1,000,000 to $1,499,99920 $1,500,000 to $1,999,99949 $2,000,000 or moreRent paid by renters in 2022 in Dyer, IN 176 $450 to $4998 $500 to $54943 $750 to $799132 $800 to $89923 $900 to $99987 $1,000 to $1,24949 $1,250 to $1,49925 $1,500 to $1,99949 $2,000 to $2,49923 $3,500 or more40 No cash rent
Percentage of workers working in this county: 64.4%Number of people working at home: 1,250 (14.9% of all workers )
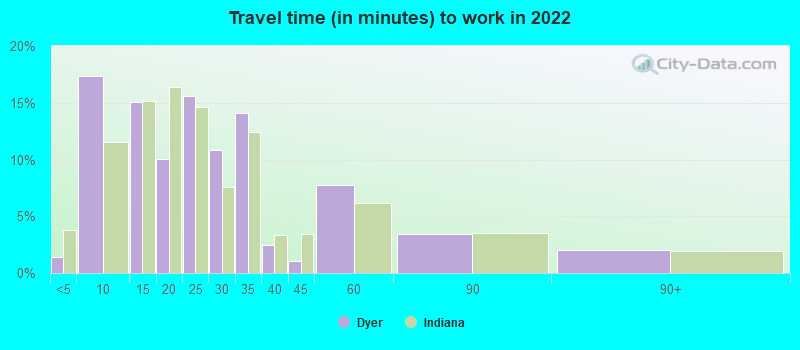
Travel time to work (commute)
Less than 5 minutes: 535 to 9 minutes: 80310 to 14 minutes: 74015 to 19 minutes: 1,08620 to 24 minutes: 96125 to 29 minutes: 48930 to 34 minutes: 94535 to 39 minutes: 31540 to 44 minutes: 31445 to 59 minutes: 67060 to 89 minutes: 78490 or more minutes: 152
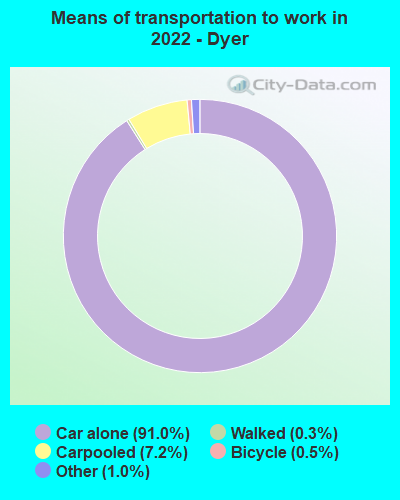
Means of transportation to work:
Drove a car alone: 4,393 (74.1%)Carpooled: 415 (7.0%)Taxi: 47 (0.8%)Bicycle: 54 (0.9%)Walked: 13 (0.2%)Worked at home: 1,250 (21.1%)
Unemployment by race in 2022
Unemployment rate for White non-Hispanic residents 2.3% Males2.4% FemalesUnemployment rate for Asian residents 23.7% MalesUnemployment rate for other race residents 29.5% FemalesUnemployment rate for two or more race residents 3.6% Males2.4% FemalesUnemployment rate for Hispanic or Latino residents 3.2% Females
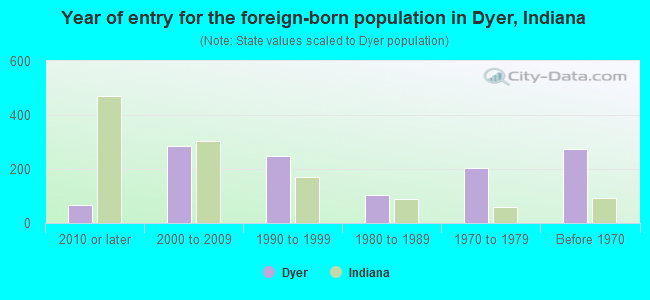
Year of entry for the foreign-born population in Dyer, Indiana
66 2010 or later 286 2000 to 2009 249 1990 to 1999 103 1980 to 1989 205 1970 to 1979 274 Before 1970
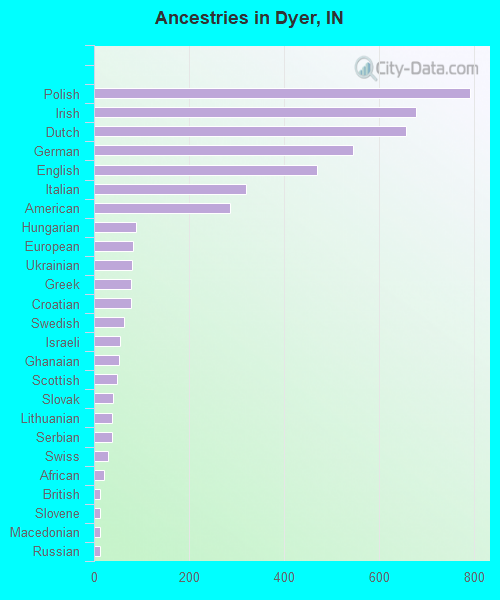
First ancestries reported:
Polish: 791 (11.8%)
Irish: 677 (10.1%)
Dutch: 655 (9.8%)
German: 544 (8.1%)
English: 469 (7.0%)
Italian: 319 (4.8%)
American: 286 (4.3%)
Hungarian: 88 (1.3%)
European: 82 (1.2%)
Ukrainian: 79 (1.2%)
Greek: 78 (1.2%)
Croatian: 77 (1.2%)
Swedish: 63 (0.9%)
Israeli: 55 (0.8%)
Ghanaian: 52 (0.8%)
Scottish: 48 (0.7%)
Slovak: 39 (0.6%)
Lithuanian: 37 (0.6%)
Serbian: 37 (0.6%)
Swiss: 29 (0.4%)
African: 21 (0.3%)
British: 13 (0.2%)
Slovene: 13 (0.2%)
Macedonian: 12 (0.2%)
Russian: 12 (0.2%)
Yugoslavian: 12 (0.2%)
Arab: 11 (0.2%)
Norwegian: 11 (0.2%)
Nigerian: 10 (0.1%)
Welsh: 8 (0.1%) Most common places of birth for foreign-born residents (%): Mexico Dyer:
27.1% (340)Indiana:
27.0% (101,996)
India Dyer:
10.8% (136)Indiana:
8.5% (32,127)
England Dyer:
10.3% (129)Indiana:
0.8% (2,847)
Philippines Dyer:
8.4% (105)Indiana:
3.1% (11,851)
Poland Dyer:
7.2% (90)Indiana:
0.8% (2,959)
Other Eastern Africa Dyer:
3.3% (42)Indiana:
0.4% (1,469)
Germany Dyer:
3.3% (41)Indiana:
1.7% (6,439)
Romania Dyer:
2.7% (34)Indiana:
0.4% (1,537)
Honduras Dyer:
2.7% (34)Indiana:
1.6% (5,892)
Israel Dyer:
2.2% (28)Indiana:
0.1% (422)
Korea Dyer:
2.0% (25)Indiana:
2.0% (7,653)
Ghana Dyer:
1.8% (22)Indiana:
0.5% (1,776)
Place of birth for U.S.-born residents:
This state: 7,695Other state: 7,537Northeast: 314Midwest: 6,483South: 450West: 432 93.8% of Dyer residents lived in the same house 1 years ago.
Out of people who lived in different houses, 40.8% lived in this county.
Out of people who lived in different counties, 24.9% lived in Indiana.
Dyer:
93.8%State average:
87.1%
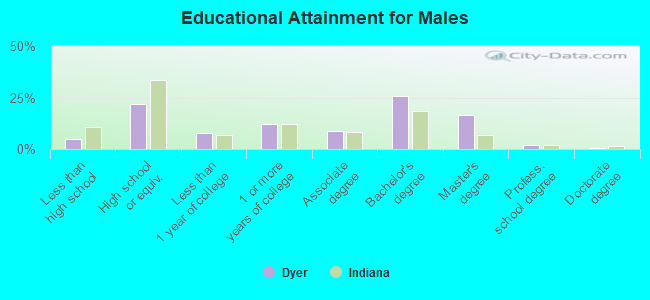
Education attainment for males 25 years and older:
No schooling: 31Nursery to 4th grade: 05th and 6th grade: 377th and 8th grade: 39th grade: 010th grade: 1611th grade: 2412th grade, no diploma: 159High school graduate (or equivalency): 1,250Less than 1 year of college: 452Some college more than 1 year, no degree: 699Associate degree: 509Bachelor's degree: 1,489Master's degree: 941Professional school degree: 112Doctorate degree: 27
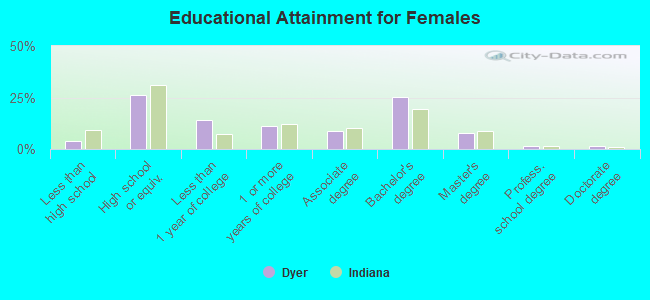
Education attainment for females 25 years and older:
No schooling: 45Nursery to 4th grade: 105th and 6th grade: 447th and 8th grade: 39th grade: 010th grade: 1711th grade: 1712th grade, no diploma: 139High school graduate (or equivalency): 1,761Less than 1 year of college: 940Some college more than 1 year, no degree: 758Associate degree: 604Bachelor's degree: 1,724Master's degree: 521Professional school degree: 101Doctorate degree: 86
Housing units in structures:
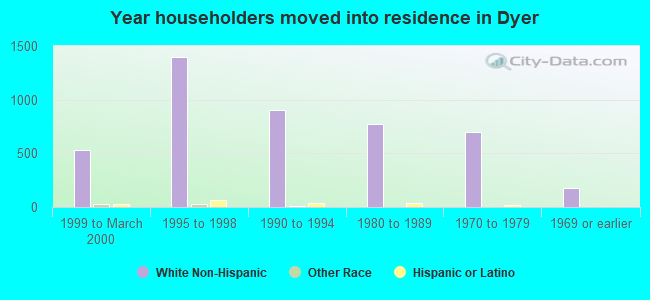
One, detached: 5,138One, attached: 9793 or 4: 135 to 9: 1810 to 19: 30950 or more: 82Mobile homes: 12Housing units lacking complete kitchen facilities in 2022: 1.3%House/condo owner moved in on average 13 years ago
Renter moved in on average 9 years ago
Private vs. public school enrollment:
Students in private schools in grades 1 to 8 (elementary and middle school): 174 Students in private schools in grades 9 to 12 (high school): 126 Students in private undergraduate colleges: 186