Eagleville, TN (Tennessee) Houses and Residents
| Eagleville: | $441,657 |
| Tennessee: | $284,800 |
Total population: 629 (Urban population: 0, Rural population: 446 (10 farm, 436 nonfarm))
Houses: 358 (343 occupied: 300 owner occupied, 52 renter occupied)
| % of renters here: | 15% |
| State: | 33% |
Housing density: 168 houses/condos per square mile
Median price asked for vacant for-sale houses and condos in 2022 in this county: $253,303.
Median contract rent in 2022: $942 (lower quartile is $584, upper quartile is $1,325)
Median rent asked for vacant for-rent units in 2022: $568
Median gross rent in Eagleville, TN in 2022: $1,216
Housing units in Eagleville with a mortgage: 214 (44 second mortgage, 0 home equity loan, 31 both second mortgage and home equity loan)
Houses without a mortgage: 0
Median household income for houses/condos with a mortgage: $98,477
Median household income for apartments without a mortgage: $89,492
Median monthly housing costs: $1,227
Compare current foreclosures near Eagleville, TN:
| Photo | Address | Area | Beds / Baths | Price | Details |
|---|---|---|---|---|---|

|
#1
Oak St
Eagleville, TN 37060
|
1,200 sq. feet
|
1 baths - beds |
show details | |

|
#2
Highway 41a N
Eagleville, TN 37060
|
1,428 sq. feet
|
1 baths - beds |
show details | |

|
#3
Baptist Church Rd
Eagleville, TN 37060
|
1,486 sq. feet
|
2 baths - beds |
show details | |

|
#4
Highway 41a N
Eagleville, TN 37060
|
- sq. feet
|
- baths - beds |
show details | |

|
#5
Little Rock Rd
Eagleville, TN 37060
|
- sq. feet
|
- baths - beds |
show details | |

|
#6
Monoco Dr
Spring Hill, TN 37174
|
- sq. feet
|
2 baths 3 beds |
show details | |

|
#7
Indian Park Dr
Murfreesboro, TN 37128
|
1,081 sq. feet
|
3 baths 3 beds |
show details | |

|
#8
Lequire Lane
Spring Hill, TN 37174
|
3,045 sq. feet
|
4 baths 6 beds |
show details | |

|
#9
Stern Ln
Shelbyville, TN 37160
|
1,232 sq. feet
|
2 baths 3 beds |
show details | |

|
#10
Addison Avenue
Chapel Hill, TN 37034
|
2,208 sq. feet
|
2 baths - beds |
show details |
| Photo | Address | Area | Beds / Baths | Price | Details |
|---|---|---|---|---|---|

|
#11
Risen Star Dr
Murfreesboro, TN 37128
|
1,470 sq. feet
|
2 baths 2 beds |
show details | |

|
#12
Oak Valley Cir
Smyrna, TN 37167
|
1,360 sq. feet
|
2 baths 3 beds |
show details | |

|
#13
Forsyth St
Murfreesboro, TN 37127
|
2,156 sq. feet
|
2 baths - beds |
show details | |

|
#14
Painted Pony Dr
Murfreesboro, TN 37128
|
1,512 sq. feet
|
2 baths - beds |
show details | |

|
#15
Sequoia Trl
Spring Hill, TN 37174
|
1,563 sq. feet
|
2 baths - beds |
show details | |

|
#16
New Path Ct
Thompsons Station, TN 37179
|
1,668 sq. feet
|
3 baths - beds |
show details | |

|
#17
Spike Trl
Murfreesboro, TN 37129
|
1,344 sq. feet
|
2 baths - beds |
show details | |

|
#18
Snead Dr
Murfreesboro, TN 37128
|
1,170 sq. feet
|
2 baths - beds |
show details | |

|
#19
Bridlewood Trl
Franklin, TN 37067
|
3,225 sq. feet
|
4 baths - beds |
show details | |

|
#20
Heatherwood Ct
Murfreesboro, TN 37129
|
1,260 sq. feet
|
2 baths - beds |
show details |
| Photo | Address | Area | Beds / Baths | Price | Details |
|---|---|---|---|---|---|

|
#21
Forest Run Dr
Lewisburg, TN 37091
|
1,290 sq. feet
|
2 baths - beds |
show details | |

|
#22
Ridgewood Rd
Franklin, TN 37064
|
2,184 sq. feet
|
2 baths - beds |
show details | |

|
#23
Mayflower Dr
Smyrna, TN 37167
|
1,250 sq. feet
|
2 baths - beds |
show details | |

|
#24
Commonwealth Dr
Spring Hill, TN 37174
|
2,494 sq. feet
|
3 baths - beds |
show details | |

|
#25
Bear Creek Pike
Columbia, TN 38401
|
1,680 sq. feet
|
2 baths - beds |
show details | |

|
#26
Dante Ranch Ln
Nolensville, TN 37135
|
2,710 sq. feet
|
3 baths - beds |
show details | |

|
#27
Hardwood Dr
Murfreesboro, TN 37129
|
1,335 sq. feet
|
2 baths - beds |
show details | |

|
#28
One Mile Ln
Smyrna, TN 37167
|
2,400 sq. feet
|
3 baths - beds |
show details | |

|
#29
Upland Dr
Franklin, TN 37067
|
1,669 sq. feet
|
3 baths - beds |
show details | |

|
#30
Pawnee Trl
Murfreesboro, TN 37128
|
1,565 sq. feet
|
3 baths - beds |
show details |
| Photo | Address | Area | Beds / Baths | Price | Details |
|---|---|---|---|---|---|

|
#31
Gale Ct
Spring Hill, TN 37174
|
1,852 sq. feet
|
3 baths - beds |
show details | |

|
#32
Bunbury Dr
Thompsons Station, TN 37179
|
4,040 sq. feet
|
5 baths - beds |
show details | |

|
#33
Cornelius Dr
Murfreesboro, TN 37129
|
1,575 sq. feet
|
3 baths - beds |
show details | |

|
#34
Arapaho Dr
Murfreesboro, TN 37128
|
1,360 sq. feet
|
2 baths - beds |
show details | |

|
#35
Westgate Blvd
Murfreesboro, TN 37128
|
1,076 sq. feet
|
2 baths - beds |
show details | |

|
#36
Cloverland Ct
Smyrna, TN 37167
|
1,008 sq. feet
|
1 baths - beds |
show details | |

|
#37
Mccoury Ln
Spring Hill, TN 37174
|
2,853 sq. feet
|
4 baths - beds |
show details | |

|
#38
Boyd Dr
Murfreesboro, TN 37129
|
1,360 sq. feet
|
3 baths - beds |
show details | |

|
#39
Holiday Dr
Murfreesboro, TN 37129
|
2,017 sq. feet
|
2 baths - beds |
show details | |

|
#40
Butterfly Bnd
Murfreesboro, TN 37129
|
1,440 sq. feet
|
2 baths - beds |
show details |
| Photo | Address | Area | Beds / Baths | Price | Details |
|---|---|---|---|---|---|

|
#41
Chippewa Pl
Murfreesboro, TN 37128
|
1,260 sq. feet
|
2 baths - beds |
show details | |

|
#42
Libby St
Smyrna, TN 37167
|
1,595 sq. feet
|
2 baths - beds |
show details | |

|
#43
Venada Trl
Murfreesboro, TN 37128
|
1,621 sq. feet
|
2 baths - beds |
show details | |

|
#44
Arno Rd
Franklin, TN 37064
|
1,582 sq. feet
|
2 baths - beds |
show details | |

|
#45
Brownlee Cv
Murfreesboro, TN 37129
|
1,971 sq. feet
|
2 baths - beds |
show details | |

|
#46
Lone Eagle Dr
Murfreesboro, TN 37128
|
1,204 sq. feet
|
2 baths - beds |
show details | |

|
#47
Carpenters Pass
Spring Hill, TN 37174
|
2,371 sq. feet
|
2 baths - beds |
show details | |

|
#48
Stewarts Bend Dr
Murfreesboro, TN 37129
|
1,298 sq. feet
|
2 baths - beds |
show details | |

|
#49
Venada Trl
Murfreesboro, TN 37128
|
1,292 sq. feet
|
2 baths - beds |
show details | |

|
Check over 1 million property listings on Foreclosure.com!
|
browse all offers | |||

Latest news about housing in Eagleville, TN collected exclusively by city-data.com from local newspapers, TV, and radio stations

 | Tennessee's 2020 Census results (74 replies) |
| Cason Estates Apartments, Murfreesboro (19 replies) |
| Five Questions about Living in Franklin, TN (25 replies) |
| Neighborhoods near Nashville (Eaglesville, Franklin, etc.) Newer homes, Equestrian (10 replies) |
| Median Home Prices by County in Nashville MSA (11 replies) |
| 2018 TN Population Estimates (24 replies) |

Median year apartment built: 1973
Household type by relationship:
Households: 1,030- Male householders: 118 (27 living alone), Female householders: 222 (35 living alone)
223 spouses (223 opposite-sex spouses), 11 unmarried partners, (11 opposite-sex unmarried partners), 416 children (357 natural, 41 adopted, 16 stepchildren), 15 grandchildren, 6 brothers or sisters, 0 parents, 0 foster children, 3 other relatives, 12 non-relatives
Size of family households: 70 2-persons, 67 3-persons, 90 4-persons, 44 5-persons, 1 6-persons.
Size of nonfamily households: 66 1-person, 7 2-persons, 1 3-persons.
251 married couples with children.
55 single-parent households (11 men, 44 women).
97.4% of residents of Eagleville speak English at home.
1.6% of residents speak Spanish at home (53% speak English very well, 20% speak English well, 27% speak English not well).
0.2% of residents speak other Indo-European language at home (100% speak English very well).
Foreign born population: 22 (2.1%)
(77.3% of them are naturalized citizens)
| Here: | 6.9 |
| State: | 6.5 |
| Here: | 4.7 |
| State: | 4.4 |

- Bedrooms in owner-occupied houses and condos in Eagleville, Tennessee
- 14no bedroom
- 01 bedroom
- 212 bedrooms
- 1873 bedrooms
- 634 bedrooms
- 165+ bedrooms

- Bedrooms in renter-occupied apartments in Eagleville, Tennessee
- 0no bedroom
- 131 bedroom
- 152 bedrooms
- 233 bedrooms
- 14 bedrooms
- 05+ bedrooms

- Cars and other vehicles available in Eagleville in owner-occupied houses/condos
- 11no vehicle
- 491 vehicle
- 1122 vehicles
- 793 vehicles
- 424 vehicles
- 85+ vehicles

- Cars and other vehicles available in Eagleville in renter-occupied apartments
- 0no vehicle
- 251 vehicle
- 142 vehicles
- 123 vehicles
- 14 vehicles
- 05+ vehicles

- Rooms in owner-occupied houses in Eagleville, Tennessee
- 31 room
- 02 rooms
- 113 rooms
- 24 rooms
- 695 rooms
- 476 rooms
- 367 rooms
- 448 rooms
- 889+ rooms

- Rooms in renter-occupied apartments in Eagleville, Tennessee
- 01 room
- 72 rooms
- 53 rooms
- 84 rooms
- 265 rooms
- 76 rooms
- 07 rooms
- 08 rooms
- 09+ rooms


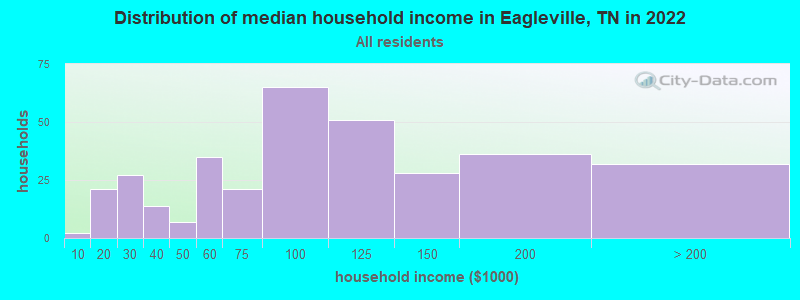
Eagleville, TN household income distribution

- 2Less than $10,000
- 21$10,000 to $19,999
- 27$20,000 to $29,999
- 14$30,000 to $39,999
- 7$40,000 to $49,999
- 35$50,000 to $59,999
- 21$60,000 to $74,999
- 65$75,000 to $99,999
- 51$100,000 to $124,999
- 28$125,000 to $149,999
- 36$150,000 to $199,999
- 32$200,000 or more
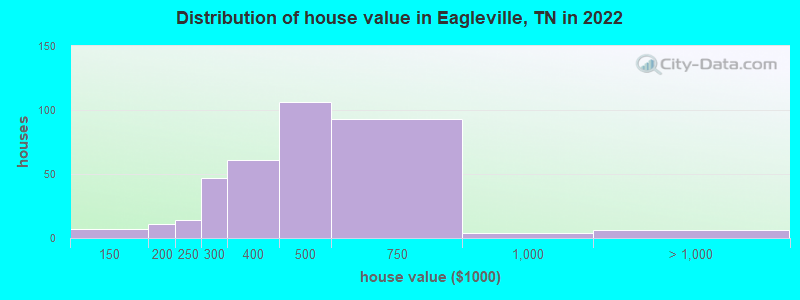
Home value of owner - occupied houses in 2022 in Eagleville, TN
-
- 4$100,000 to $124,999
- 2$125,000 to $149,999
- 6$150,000 to $174,999
- 4$175,000 to $199,999
- 14$200,000 to $249,999
- 47$250,000 to $299,999
- 60$300,000 to $399,999
- 106$400,000 to $499,999
- 93$500,000 to $749,999
- 4$750,000 to $999,999
- 6$1,000,000 to $1,499,999
Rent paid by renters in 2022 in Eagleville, TN
-
- 5$450 to $499
- 6$500 to $549
- 1$550 to $599
- 2$700 to $749
- 2$750 to $799
- 2$800 to $899
- 4$900 to $999
- 8$1,000 to $1,249
- 5$1,250 to $1,499
- 6$1,500 to $1,999


Percentage of workers working in this county: 51.0%
Number of people working at home: 111 (21.1% of all workers)
Travel time to work (commute)
- Less than 5 minutes: 7
- 5 to 9 minutes: 22
- 10 to 14 minutes: 16
- 15 to 19 minutes: 36
- 20 to 24 minutes: 15
- 25 to 29 minutes: 20
- 30 to 34 minutes: 103
- 35 to 39 minutes: 12
- 40 to 44 minutes: 56
- 45 to 59 minutes: 123
- 60 to 89 minutes: 8
- 90 or more minutes: 10
Means of transportation to work:
- Drove a car alone: 172 (79.6%)
- Carpooled: 28 (13.0%)
- Walked: 9 (4.2%)
- Other means: 1 (0.5%)
- Worked at home: 6 (2.8%)

- Unemployment by race in 2022
- Unemployment rate for White non-Hispanic residents
- 0.5%Males
- 1.3%Females

- Year of entry for the foreign-born population in Eagleville, Tennessee
- 02010 or later
- 102000 to 2009
- 31990 to 1999
- 31980 to 1989
- 11970 to 1979
- 0Before 1970

First ancestries reported:
- American: 220 (44.2%)
- English: 70 (14.1%)
- Irish: 26 (5.2%)
- German: 22 (4.4%)
- European: 13 (2.6%)
- French: 13 (2.6%)
- Polish: 9 (1.8%)
- Dutch: 3 (0.6%)
- British: 2 (0.4%)
- Danish: 2 (0.4%)
- Welsh: 2 (0.4%)
- Scottish: 1 (0.2%)
Most common places of birth for foreign-born residents (%):
| Eagleville: | 25.0% (4) |
| Tennessee: | 2.3% (8,490) |
| Eagleville: | 18.8% (3) |
| Tennessee: | 5.7% (21,286) |
| Eagleville: | 12.5% (2) |
| Tennessee: | 2.7% (10,313) |
| Eagleville: | 12.5% (2) |
| Tennessee: | 23.0% (86,435) |
| Eagleville: | 12.5% (2) |
| Tennessee: | 0.3% (948) |
Place of birth for U.S.-born residents:
- This state: 595
- Other state: 388
- Northeast: 19
- Midwest: 85
- South: 133
- West: 164
93.8% of Eagleville residents lived in the same house 1 years ago.
Out of people who lived in different houses, 36.4% lived in this county.
Out of people who lived in different counties, 85.2% lived in Tennessee.
| Eagleville: | 93.8% |
| State average: | 87.0% |
Education attainment for males 25 years and older:
- No schooling: 0
- Nursery to 4th grade: 0
- 5th and 6th grade: 0
- 7th and 8th grade: 0
- 9th grade: 1
- 10th grade: 2
- 11th grade: 3
- 12th grade, no diploma: 6
- High school graduate (or equivalency): 115
- Less than 1 year of college: 47
- Some college more than 1 year, no degree: 11
- Associate degree: 20
- Bachelor's degree: 76
- Master's degree: 14
- Professional school degree: 13
- Doctorate degree: 0

Education attainment for females 25 years and older:
- No schooling: 2
- Nursery to 4th grade: 0
- 5th and 6th grade: 0
- 7th and 8th grade: 0
- 9th grade: 0
- 10th grade: 3
- 11th grade: 12
- 12th grade, no diploma: 2
- High school graduate (or equivalency): 75
- Less than 1 year of college: 23
- Some college more than 1 year, no degree: 59
- Associate degree: 33
- Bachelor's degree: 67
- Master's degree: 27
- Professional school degree: 1
- Doctorate degree: 7


Housing units in structures:
- One, detached: 319
- One, attached: 6
- Two: 8
- 3 or 4: 2
- 5 to 9: 2
- Mobile homes: 20
Housing units lacking complete kitchen facilities in 2022: 0.6%
House/condo owner moved in on average 9 years ago
Renter moved in on average 5 years ago

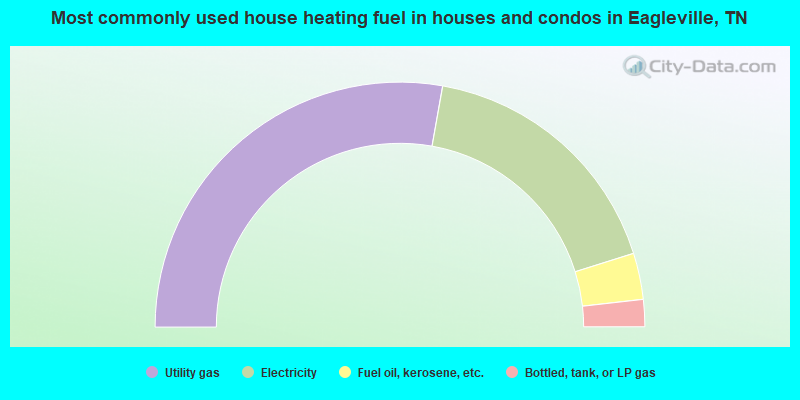
- 55.6%Utility gas
- 34.7%Electricity
- 6.1%Fuel oil, kerosene, etc.
- 3.6%Bottled, tank, or LP gas
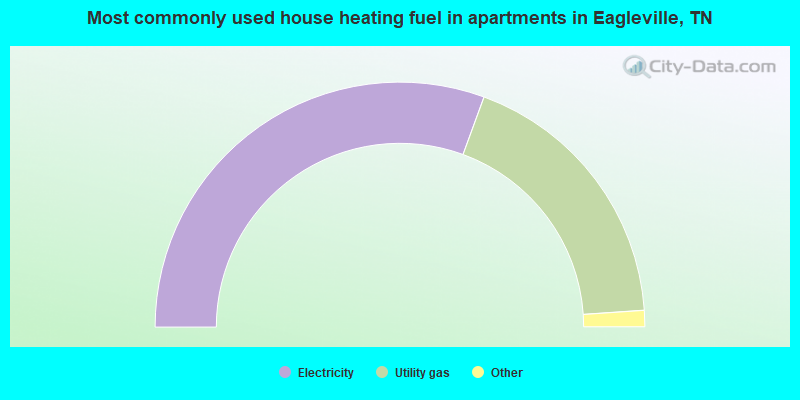
- 62.5%Electricity
- 37.5%Utility gas
Private vs. public school enrollment:
| Here: | 1.7% |
| Tennessee: | 15.0% |
| Here: | 5.6% |
| Tennessee: | 16.2% |
| Here: | 23.3% |
| Tennessee: | 23.5% |


