East Compton, CA (California) Houses and Residents
| East Compton: | $538,000 |
| California: | $715,900 |
Total population: 9,472 (Urban population: 9,080, Rural population: 0)
Houses: 1,897 (1,825 occupied: 911 owner occupied, 914 renter occupied)
| % of renters here: | 50% |
| State: | 44% |
Housing density: 3,666 houses/condos per square mile
Median price asked for vacant for-sale houses and condos in 2022 in this county: $1,291,802.
Median contract rent in 2022: $1,367 (lower quartile is $1,059, upper quartile is $1,713)
Median rent asked for vacant for-rent units in 2022: $1,341
Median gross rent in East Compton, CA in 2022: $1,576
Housing units in East Compton with a mortgage: 723 (95 second mortgage, 14 home equity loan, 0 both second mortgage and home equity loan)
Houses without a mortgage: 137


Household type by relationship:
Households: 9,646,924- In family households: 8,234,154 (1,430,848 male householders, 763,232 female householders)
1,480,665 spouses, 3,033,524 children (2,872,074 natural, 53,496 adopted, 107,954 stepchildren), 308,856 grandchildren, 205,746 brothers or sisters, 184,807 parents, foster children, 318,669 other relatives, 372,007 non-relatives
- In nonfamily households: 1,412,770 (510,532 male householders (360,530 living alone)), 536,592 female householders (424,398 living alone)), 365,646 nonrelatives
- In group quarters: 171,681 (68,682 institutionalized population)
1,648,001 married couples with children.
626,289 single-parent households (146,085 men, 480,204 women).
27.0% of residents of East Compton speak English at home.
72.1% of residents speak Spanish at home (43% speak English very well, 23% speak English well, 19% speak English not well, 15% don't speak English at all).
0.9% of residents speak Asian or Pacific Island language at home (76% speak English very well, 24% speak English well).
Foreign born population: 3,536 (38.1%)
(34.4% of them are naturalized citizens)
| Here: | 4.6 |
| State: | 6.0 |
| Here: | 3.7 |
| State: | 3.9 |

- Bedrooms in owner-occupied houses and condos in East Compton, California
- 29no bedroom
- 1431 bedroom
- 3602 bedrooms
- 3073 bedrooms
- 584 bedrooms
- 145+ bedrooms

- Bedrooms in renter-occupied apartments in East Compton, California
- 100no bedroom
- 2741 bedroom
- 3852 bedrooms
- 1103 bedrooms
- 364 bedrooms
- 95+ bedrooms

- Cars and other vehicles available in East Compton in owner-occupied houses/condos
- 58no vehicle
- 2021 vehicle
- 2882 vehicles
- 2163 vehicles
- 684 vehicles
- 795+ vehicles

- Cars and other vehicles available in East Compton in renter-occupied apartments
- 163no vehicle
- 4361 vehicle
- 2072 vehicles
- 663 vehicles
- 234 vehicles
- 195+ vehicles

- Rooms in owner-occupied houses in East Compton, California
- 01 room
- 1012 rooms
- 1843 rooms
- 2284 rooms
- 1275 rooms
- 1666 rooms
- 797 rooms
- 148 rooms
- 129+ rooms

- Rooms in renter-occupied apartments in East Compton, California
- 701 room
- 2272 rooms
- 1233 rooms
- 2564 rooms
- 1275 rooms
- 806 rooms
- 157 rooms
- 78 rooms
- 99+ rooms


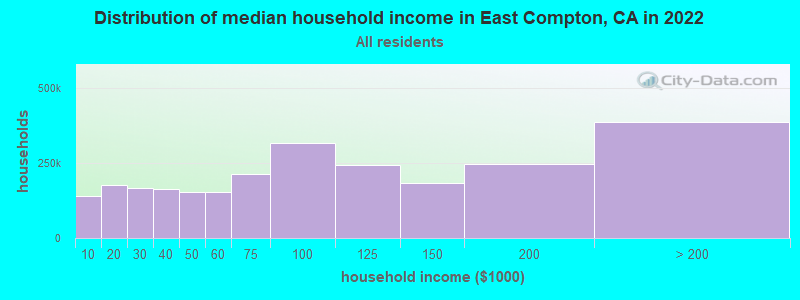
East Compton, CA household income distribution

- 139,940Less than $10,000
- 176,410$10,000 to $19,999
- 165,513$20,000 to $29,999
- 163,334$30,000 to $39,999
- 154,430$40,000 to $49,999
- 154,553$50,000 to $59,999
- 212,895$60,000 to $74,999
- 314,239$75,000 to $99,999
- 244,131$100,000 to $124,999
- 184,170$125,000 to $149,999
- 246,713$150,000 to $199,999
- 385,732$200,000 or more
Percentage of workers working in this county: 93.6%
Number of people working at home: 553 (17.0% of all workers)
Travel time to work (commute)
- Less than 5 minutes: 12
- 5 to 9 minutes: 102
- 10 to 14 minutes: 262
- 15 to 19 minutes: 333
- 20 to 24 minutes: 466
- 25 to 29 minutes: 166
- 30 to 34 minutes: 526
- 35 to 39 minutes: 111
- 40 to 44 minutes: 118
- 45 to 59 minutes: 183
- 60 to 89 minutes: 157
- 90 or more minutes: 103
Means of transportation to work:
- Drove a car alone: 1,649 (62.5%)
- Carpooled: 586 (22.2%)
- Bus or trolley bus: 136 (5.2%)
- Streetcar or trolley car: 11 (0.4%)
- Taxi: 12 (0.5%)
- Walked: 111 (4.2%)
- Other means: 34 (1.3%)
- Worked at home: 98 (3.7%)


- Year of entry for the foreign-born population in East Compton, California
- 8551995 to March 2000
- 4991990 to 1994
- 6851985 to 1989
- 5931980 to 1984
- 5621975 to 1979
- 3361970 to 1974
- 1971965 to 1969
- 60Before 1965
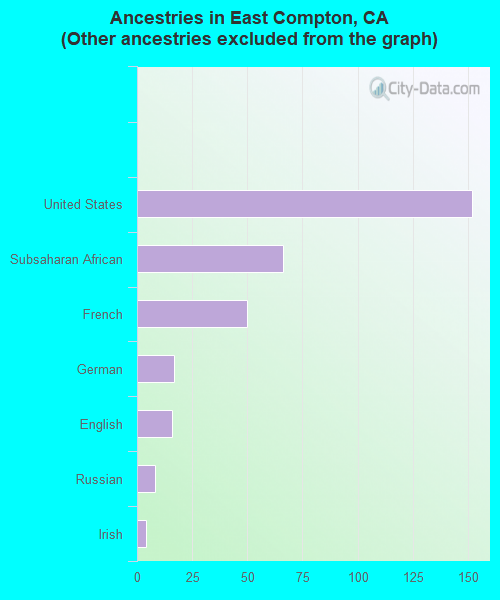
First ancestries reported:
- Other: 7,888 (96.2%)
- United States: 152 (1.9%)
- Subsaharan African: 66 (0.8%)
- French: 50 (0.6%)
- German: 17 (0.2%)
- English: 16 (0.2%)
- Russian: 8 (0.10%)
- Irish: 4 (0.05%)
Most common places of birth for foreign-born residents (%):
| East Compton: | 89.1% (3,374) |
| California: | 44.3% (3,928,701) |
| East Compton: | 6.0% (228) |
| California: | 4.1% (359,673) |
Place of birth for U.S.-born residents:
- This state: 4,661
- Other state: 566
- Northeast: 58
- Midwest: 55
- South: 453
- West: 0
63% of East Compton residents lived in the same house 5 years ago.
Out of people who lived in different houses, 95% lived in this county.
Out of people who lived in different counties, 85% lived in California.
Education attainment for males 25 years and older:
- No schooling: 210
- Nursery to 4th grade: 170
- 5th and 6th grade: 372
- 7th and 8th grade: 109
- 9th grade: 100
- 10th grade: 58
- 11th grade: 124
- 12th grade, no diploma: 132
- High school graduate (or equivalency): 332
- Less than 1 year of college: 83
- Some college more than 1 year, no degree: 153
- Associate degree: 88
- Bachelor's degree: 52
- Master's degree: 5
- Professional school degree: 0
- Doctorate degree: 8

Education attainment for females 25 years and older:
- No schooling: 188
- Nursery to 4th grade: 130
- 5th and 6th grade: 448
- 7th and 8th grade: 73
- 9th grade: 80
- 10th grade: 54
- 11th grade: 100
- 12th grade, no diploma: 183
- High school graduate (or equivalency): 294
- Less than 1 year of college: 172
- Some college more than 1 year, no degree: 191
- Associate degree: 96
- Bachelor's degree: 36
- Master's degree: 50
- Professional school degree: 0
- Doctorate degree: 0


Housing units in structures:
- One, detached: 1,318
- One, attached: 267
- Two: 95
- 3 or 4: 114
- 5 to 9: 75
- 10 to 19: 28
Housing units lacking complete kitchen facilities: 0.7%

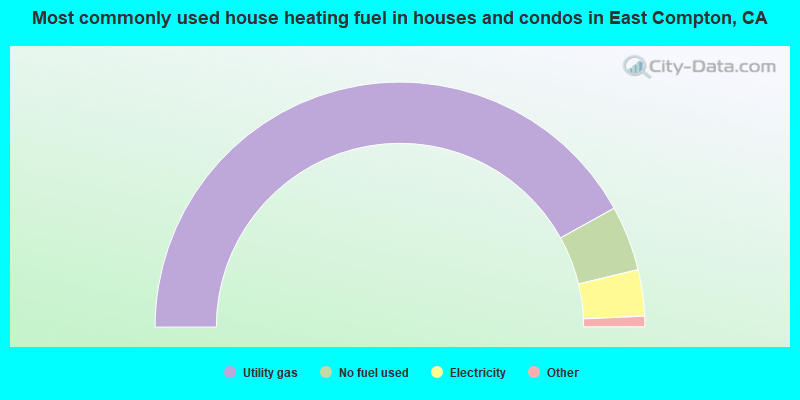
- 83.9%Utility gas
- 8.6%No fuel used
- 6.1%Electricity
- 0.8%Bottled, tank, or LP gas
- 0.7%Solar energy
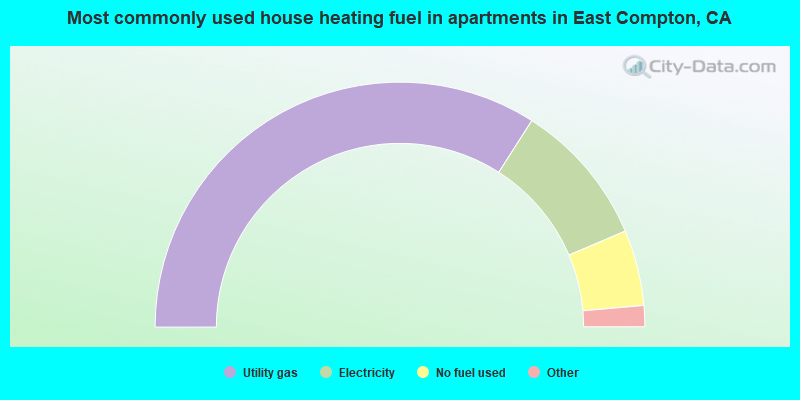
- 68.1%Utility gas
- 19.1%Electricity
- 10.0%No fuel used
- 1.4%Bottled, tank, or LP gas
- 1.4%Solar energy
Private vs. public school enrollment:
| Here: | 7.6% |
| California: | 9.9% |
| Here: | 8.8% |
| California: | 7.8% |
| Here: | 12.6% |
| California: | 15.4% |


