East Glenville, NY (New York) Houses and Residents
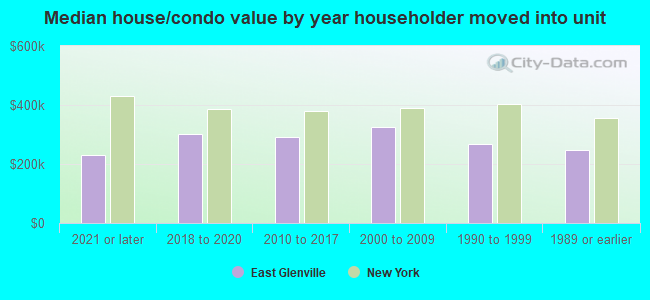
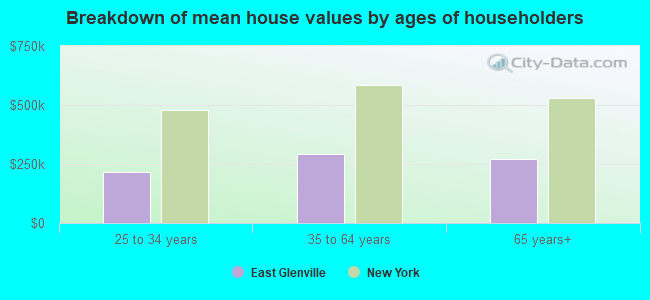
| East Glenville: | $283,876 |
| New York: | $400,400 |
Total population: 6,616 (Urban population: 6,064, Rural population: 0)
Houses: 5,266 (4,740 occupied: 3,076 owner occupied, 1,758 renter occupied)
| % of renters here: | 36% |
| State: | 46% |
Housing density: 725 houses/condos per square mile
Median price asked for vacant for-sale houses and condos in 2022 in this county: $378,269.
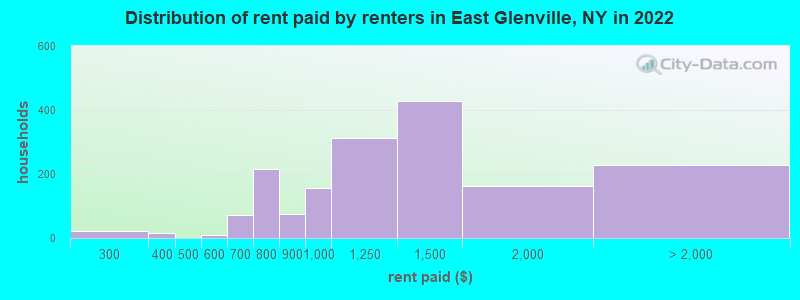
Median contract rent in 2022: $1,172 (lower quartile is $953, upper quartile is $1,494)
Median rent asked for vacant for-rent units in 2022: $2,039
Median gross rent in East Glenville, NY in 2022: $1,369
Housing units in East Glenville with a mortgage: 1,922 (373 second mortgage, 37 home equity loan, 312 both second mortgage and home equity loan)
Houses without a mortgage: 22
Median household income for houses/condos with a mortgage: $130,022
Median household income for apartments without a mortgage: $81,147
Median monthly housing costs: $1,419
Compare current foreclosures near East Glenville, NY:
| Photo | Address | Area | Beds / Baths | Price | Details |
|---|---|---|---|---|---|

|
#1
River St
Troy, NY 12180
|
2,112 sq. feet
|
2 baths 6 beds |
$33,250
|
show details |

|
#2
Lark St
Altamont, NY 12009
|
2,045 sq. feet
|
2 baths 3 beds |
$189,000
|
show details |

|
#3
Wilkins Ave
Albany, NY 12205
|
638 sq. feet
|
1 baths 2 beds |
$189,900
|
show details |

|
#4
N Allen St
Albany, NY 12206
|
2,464 sq. feet
|
2 baths 6 beds |
$74,900
|
show details |

|
#5
Brookview Ter
Slingerlands, NY 12159
|
1,574 sq. feet
|
2 baths 2 beds |
show details | |

|
#6
Ray Ave
Schenectady, NY 12304
|
1,780 sq. feet
|
2 baths 3 beds |
show details | |

|
#7
Vliet Blvd
Cohoes, NY 12047
|
2,550 sq. feet
|
2 baths 6 beds |
show details | |

|
#8
Swift Rd
Voorheesville, NY 12186
|
4,905 sq. feet
|
3 baths 5 beds |
show details | |

|
#9
Fuller Ter
Albany, NY 12205
|
775 sq. feet
|
2 baths 2 beds |
show details | |

|
#10
11th St
Troy, NY 12180
|
1,850 sq. feet
|
2 baths 3 beds |
show details |
| Photo | Address | Area | Beds / Baths | Price | Details |
|---|---|---|---|---|---|

|
#11
Nys Rt 29
Middle Grove, NY 12850
|
962 sq. feet
|
1 baths 3 beds |
show details | |

|
#12
Redfield Park
Clifton Park, NY 12065
|
2,573 sq. feet
|
2 baths 4 beds |
show details | |

|
#13
Hudson St
Waterford, NY 12188
|
1,764 sq. feet
|
2 baths 4 beds |
show details | |

|
#14
New Turnpike Rd
Troy, NY 12182
|
981 sq. feet
|
1 baths 3 beds |
show details | |

|
#15
Arcadia Ct
Albany, NY 12205
|
1,692 sq. feet
|
1 baths 4 beds |
show details | |

|
#16
Fiero Ave
Schenectady, NY 12303
|
1,598 sq. feet
|
2 baths 3 beds |
show details | |

|
#17
Chester Ct
Troy, NY 12182
|
2,974 sq. feet
|
1 baths 4 beds |
show details | |

|
#18
Lincoln Ave
Cohoes, NY 12047
|
2,200 sq. feet
|
2 baths 4 beds |
show details | |

|
#19
Mann Avenue & 12 Elm Street
Cohoes, NY 12047
|
1,864 sq. feet
|
2 baths 4 beds |
show details | |

|
#20
Sacandaga Rd
Schenectady, NY 12302
|
1,272 sq. feet
|
1 baths 3 beds |
show details |
| Photo | Address | Area | Beds / Baths | Price | Details |
|---|---|---|---|---|---|

|
#21
Outer Dr
Schenectady, NY 12303
|
1,404 sq. feet
|
1 baths 3 beds |
show details | |

|
#22
Willett St
Schenectady, NY 12303
|
1,944 sq. feet
|
2 baths 4 beds |
show details | |

|
#23
4th Ave
Troy, NY 12182
|
872 sq. feet
|
1 baths 3 beds |
show details | |

|
#24
Midway Dr
Albany, NY 12205
|
1,296 sq. feet
|
1 baths 3 beds |
show details | |

|
#25
Stone Church Rd
Ballston Spa, NY 12020
|
- sq. feet
|
2 baths 4 beds |
show details | |

|
#26
Parker Rd
Schenectady, NY 12304
|
1,645 sq. feet
|
1 baths 3 beds |
show details | |

|
#27
Generals Way
Clifton Park, NY 12065
|
1,059 sq. feet
|
1 baths 2 beds |
show details | |

|
#28
George St
Troy, NY 12183
|
2,200 sq. feet
|
2 baths 6 beds |
show details | |

|
#29
Generals Way
Clifton Park, NY 12065
|
1,080 sq. feet
|
1 baths 2 beds |
show details | |

|
#30
Conqua Ln
Schenectady, NY 12306
|
1,760 sq. feet
|
2 baths 3 beds |
show details |
| Photo | Address | Area | Beds / Baths | Price | Details |
|---|---|---|---|---|---|

|
#31
Kirby Rd
Saratoga Springs, NY 12866
|
1,280 sq. feet
|
1 baths 2 beds |
show details | |

|
#32
Crescent Ave
Amsterdam, NY 12010
|
1,386 sq. feet
|
2 baths 5 beds |
show details | |

|
#33
Western Tpke
Altamont, NY 12009
|
2,019 sq. feet
|
3 baths 5 beds |
show details | |

|
#34
Everett Rd
Albany, NY 12205
|
1,428 sq. feet
|
2 baths 3 beds |
show details | |

|
#35
Lawrence St
Waterford, NY 12188
|
2,200 sq. feet
|
1 baths 2 beds |
show details | |

|
#36
Ontario St
Cohoes, NY 12047
|
2,618 sq. feet
|
2 baths 5 beds |
show details | |

|
#37
Bridge Ave
Cohoes, NY 12047
|
1,116 sq. feet
|
1 baths 2 beds |
show details | |

|
#38
Kasper Dr
Albany, NY 12211
|
1,342 sq. feet
|
1 baths 3 beds |
show details | |

|
#39
2nd St # 1
Waterford, NY 12188
|
2,500 sq. feet
|
2 baths 4 beds |
show details | |

|
#40
Maplewood Ave
Albany, NY 12205
|
1,087 sq. feet
|
1 baths 3 beds |
show details |
| Photo | Address | Area | Beds / Baths | Price | Details |
|---|---|---|---|---|---|

|
#41
Leto Rd
Albany, NY 12203
|
1,272 sq. feet
|
2 baths 3 beds |
show details | |

|
#42
Acorn Dr
Schenectady, NY 12302
|
2,536 sq. feet
|
2 baths 4 beds |
show details | |

|
#43
Lincoln Ave
Cohoes, NY 12047
|
1,560 sq. feet
|
1 baths 5 beds |
show details | |

|
#44
Ledgewood Dr
Albany, NY 12205
|
1,964 sq. feet
|
3 baths 4 beds |
show details | |

|
#45
Anthony Ln
Albany, NY 12205
|
1,224 sq. feet
|
1 baths 2 beds |
show details | |

|
#46
Lake Rd
Galway, NY 12074
|
1,512 sq. feet
|
1 baths 3 beds |
show details | |

|
#47
Middletown Rd
Waterford, NY 12188
|
1,008 sq. feet
|
1 baths 3 beds |
show details | |

|
#48
Central Ave
Cohoes, NY 12047
|
1,232 sq. feet
|
1 baths 3 beds |
show details | |

|
#49
Wertman Ln
Albany, NY 12211
|
1,397 sq. feet
|
1 baths 4 beds |
show details | |

|
Check over 1 million property listings on Foreclosure.com!
|
browse all offers | |||


 | Move to Schenectady area from Southern California? (27 replies) |
| Albany area subway/light rail/commuter rail (90 replies) |
| Possibly Relocating to Saratoga County (29 replies) |
| Ballston Spa / Glens Falls - jobs, schools, neighborhood questions (7 replies) |

Median year apartment built: 1997
Household type by relationship:
Households: 11,523- Male householders: 2,310 (645 living alone), Female householders: 2,412 (1,094 living alone)
2,304 spouses (2,303 opposite-sex spouses), 389 unmarried partners, (377 opposite-sex unmarried partners), 3,179 children (3,071 natural, 5 adopted, 103 stepchildren), 73 grandchildren, 75 brothers or sisters, 75 parents, 0 foster children, 54 other relatives, 396 non-relatives
- In group quarters: 252
Size of family households: 1,376 2-persons, 724 3-persons, 353 4-persons, 172 5-persons, 87 6-persons, 32 7-or-more-persons.
Size of nonfamily households: 1,730 1-person, 348 2-persons, 37 5-persons.
2,324 married couples with children.
454 single-parent households (302 men, 152 women).
95.2% of residents of East Glenville speak English at home.
2.8% of residents speak Spanish at home (71% speak English very well, 14% speak English well, 15% speak English not well).
0.6% of residents speak other Indo-European language at home (100% speak English very well).
1.2% of residents speak Asian or Pacific Island language at home (64% speak English very well, 31% speak English well, 6% speak English not well).
0.6% of residents speak other language at home (100% speak English very well).
Foreign born population: 496 (4.3%)
(75.2% of them are naturalized citizens)
| Here: | 7.4 |
| State: | 6.3 |
| Here: | 3.6 |
| State: | 3.8 |
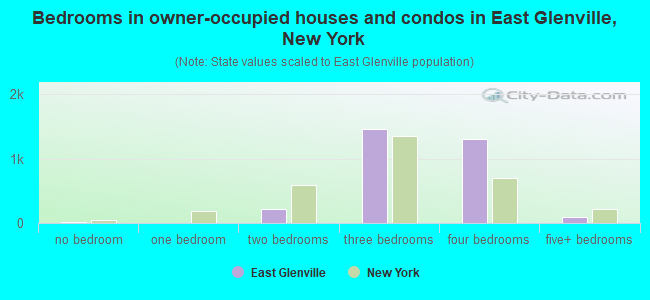
- Bedrooms in owner-occupied houses and condos in East Glenville, New York
- 10no bedroom
- 51 bedroom
- 2142 bedrooms
- 1,4603 bedrooms
- 1,2994 bedrooms
- 885+ bedrooms
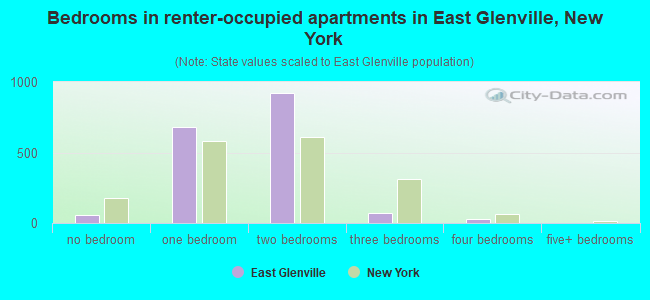
- Bedrooms in renter-occupied apartments in East Glenville, New York
- 58no bedroom
- 6831 bedroom
- 9222 bedrooms
- 703 bedrooms
- 274 bedrooms
- 05+ bedrooms
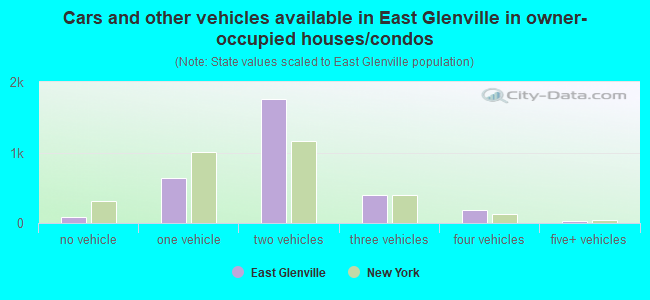
- Cars and other vehicles available in East Glenville in owner-occupied houses/condos
- 82no vehicle
- 6361 vehicle
- 1,7542 vehicles
- 3963 vehicles
- 1804 vehicles
- 295+ vehicles
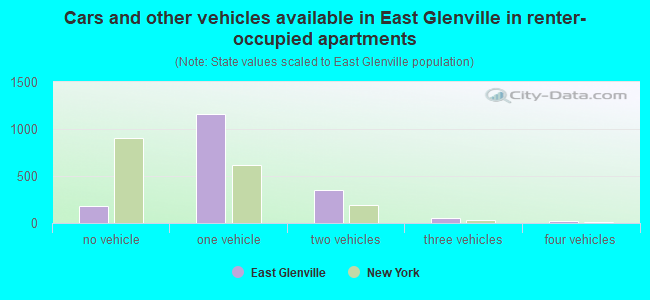
- Cars and other vehicles available in East Glenville in renter-occupied apartments
- 182no vehicle
- 1,1591 vehicle
- 3522 vehicles
- 503 vehicles
- 164 vehicles
- 05+ vehicles
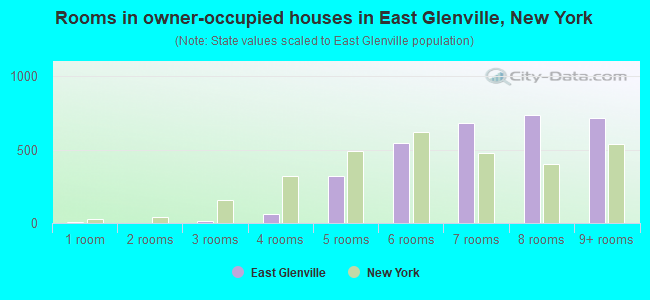
- Rooms in owner-occupied houses in East Glenville, New York
- 101 room
- 02 rooms
- 113 rooms
- 614 rooms
- 3175 rooms
- 5456 rooms
- 6807 rooms
- 7368 rooms
- 7189+ rooms
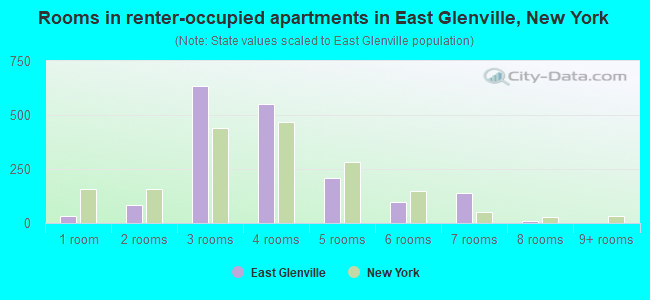
- Rooms in renter-occupied apartments in East Glenville, New York
- 311 room
- 852 rooms
- 6363 rooms
- 5514 rooms
- 2095 rooms
- 996 rooms
- 1397 rooms
- 98 rooms
- 09+ rooms
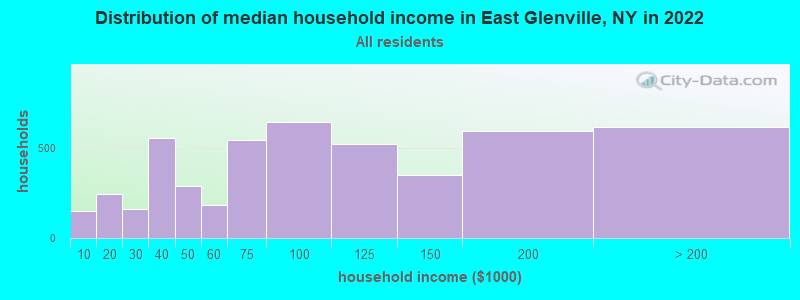
East Glenville, NY household income distribution

- 152Less than $10,000
- 241$10,000 to $19,999
- 162$20,000 to $29,999
- 554$30,000 to $39,999
- 286$40,000 to $49,999
- 185$50,000 to $59,999
- 545$60,000 to $74,999
- 642$75,000 to $99,999
- 523$100,000 to $124,999
- 347$125,000 to $149,999
- 591$150,000 to $199,999
- 617$200,000 or more
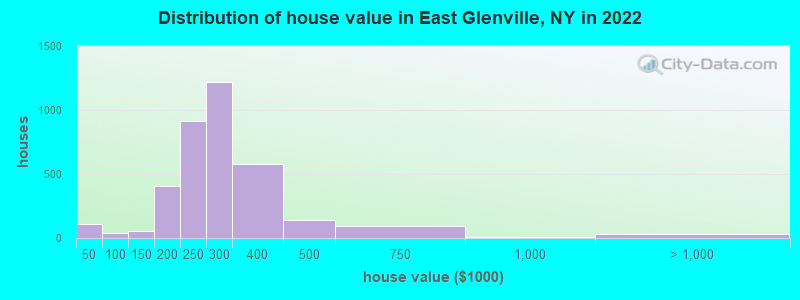
Home value of owner - occupied houses in 2022 in East Glenville, NY
-
- 51Less than $10,000
- 16$15,000 to $19,999
- 12$20,000 to $24,999
- 9$25,000 to $29,999
- 17$30,000 to $34,999
- 7$60,000 to $69,999
- 4$70,000 to $79,999
- 25$90,000 to $99,999
- 20$100,000 to $124,999
- 37$125,000 to $149,999
- 89$150,000 to $174,999
- 317$175,000 to $199,999
- 916$200,000 to $249,999
- 1,215$250,000 to $299,999
- 577$300,000 to $399,999
- 137$400,000 to $499,999
- 92$500,000 to $749,999
- 8$750,000 to $999,999
- 8$1,000,000 to $1,499,999
- 27$2,000,000 or more
Rent paid by renters in 2022 in East Glenville, NY
-
- 22$200 to $249
- 15$300 to $349
- 10$550 to $599
- 19$600 to $649
- 52$650 to $699
- 6$700 to $749
- 208$750 to $799
- 76$800 to $899
- 156$900 to $999
- 313$1,000 to $1,249
- 428$1,250 to $1,499
- 161$1,500 to $1,999
- 58$2,000 to $2,499
- 125$2,500 to $2,999
- 45No cash rent
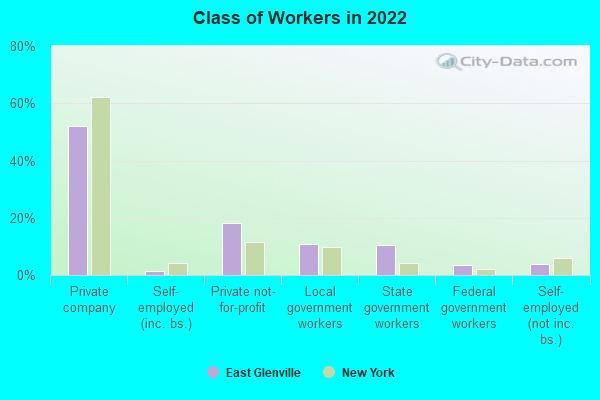
Percentage of workers working in this county: 53.4%
Number of people working at home: 455 (8.8% of all workers)
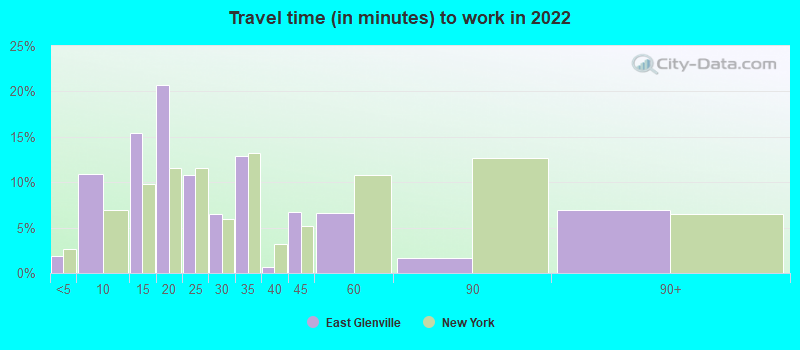
Travel time to work (commute)
- Less than 5 minutes: 76
- 5 to 9 minutes: 351
- 10 to 14 minutes: 561
- 15 to 19 minutes: 812
- 20 to 24 minutes: 813
- 25 to 29 minutes: 303
- 30 to 34 minutes: 765
- 35 to 39 minutes: 196
- 40 to 44 minutes: 397
- 45 to 59 minutes: 299
- 60 to 89 minutes: 38
- 90 or more minutes: 48
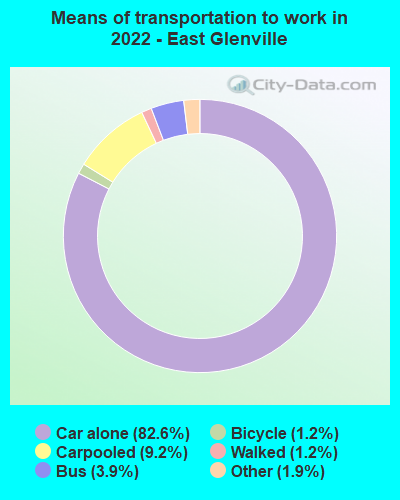
Means of transportation to work:
- Drove a car alone: 3,979 (73.3%)
- Carpooled: 481 (8.9%)
- Bus: 196 (3.6%)
- Taxi: 158 (2.9%)
- Bicycle: 56 (1.0%)
- Walked: 47 (0.9%)
- Worked at home: 455 (8.4%)
- Unemployment by race in 2022
- Unemployment rate for White non-Hispanic residents
- 5.3%Males
- 1.8%Females
- Unemployment rate for two or more race residents
- 8.1%Males
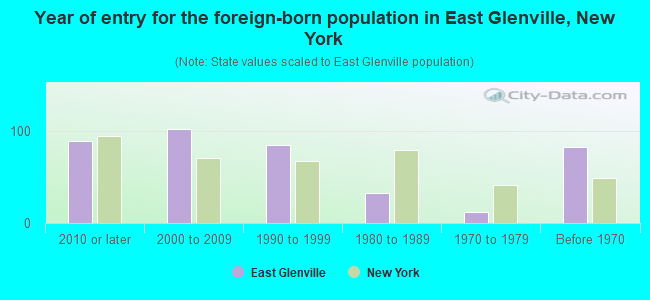
- Year of entry for the foreign-born population in East Glenville, New York
- 892010 or later
- 1022000 to 2009
- 851990 to 1999
- 331980 to 1989
- 121970 to 1979
- 82Before 1970
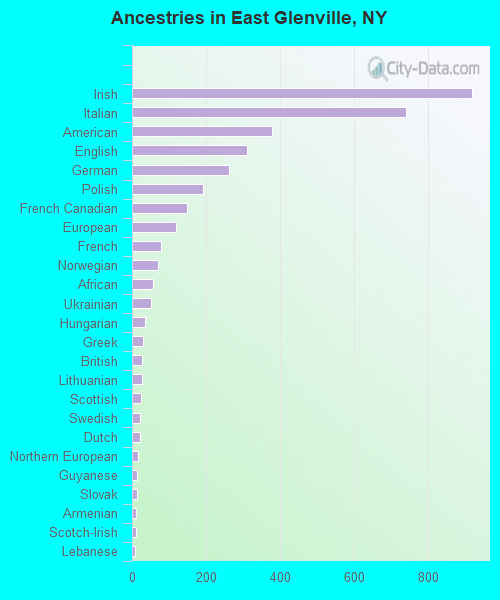
First ancestries reported:
- Irish: 920 (21.9%)
- Italian: 741 (17.6%)
- American: 379 (9.0%)
- English: 312 (7.4%)
- German: 262 (6.2%)
- Polish: 191 (4.5%)
- French Canadian: 150 (3.6%)
- European: 119 (2.8%)
- French: 78 (1.9%)
- Norwegian: 70 (1.7%)
- African: 58 (1.4%)
- Ukrainian: 52 (1.2%)
- Hungarian: 34 (0.8%)
- Greek: 30 (0.7%)
- British: 28 (0.7%)
- Lithuanian: 26 (0.6%)
- Scottish: 24 (0.6%)
- Swedish: 23 (0.5%)
- Dutch: 22 (0.5%)
- Northern European: 16 (0.4%)
- Guyanese: 14 (0.3%)
- Slovak: 13 (0.3%)
- Armenian: 11 (0.3%)
- Scotch-Irish: 10 (0.2%)
- Lebanese: 9 (0.2%)
- Czech: 9 (0.2%)
- Portuguese: 9 (0.2%)
- Welsh: 9 (0.2%)
- Danish: 8 (0.2%)
- Trinidadian and Tobagonian: 8 (0.2%)
- Haitian: 2 (0.05%)
Most common places of birth for foreign-born residents (%):
| East Glenville: | 20.4% (93) |
| New York: | 3.8% (172,129) |
| East Glenville: | 14.3% (65) |
| New York: | 0.9% (39,058) |
| East Glenville: | 8.1% (37) |
| New York: | 0.4% (19,652) |
| East Glenville: | 7.9% (36) |
| New York: | 3.5% (158,432) |
| East Glenville: | 7.7% (35) |
| New York: | 0.5% (23,058) |
| East Glenville: | 6.4% (29) |
| New York: | 9.1% (410,910) |
| East Glenville: | 5.3% (24) |
| New York: | 1.3% (59,107) |
| East Glenville: | 4.6% (21) |
| New York: | 0.9% (38,713) |
| East Glenville: | 4.2% (19) |
| New York: | 2.4% (108,067) |
| East Glenville: | 3.7% (17) |
| New York: | 0.1% (5,087) |
| East Glenville: | 2.4% (11) |
| New York: | 0.2% (8,808) |
| East Glenville: | 2.2% (10) |
| New York: | 1.8% (82,786) |
| East Glenville: | 1.8% (8) |
| New York: | 0.3% (11,967) |
| East Glenville: | 1.8% (8) |
| New York: | 0.1% (4,623) |
Place of birth for U.S.-born residents:
- This state: 8,966
- Other state: 1,886
- Northeast: 1,157
- Midwest: 441
- South: 298
- West: 99
87.0% of East Glenville residents lived in the same house 1 years ago.
Out of people who lived in different houses, 19.1% lived in this county.
Out of people who lived in different counties, 84.8% lived in New York.
| East Glenville: | 87.0% |
| State average: | 89.6% |
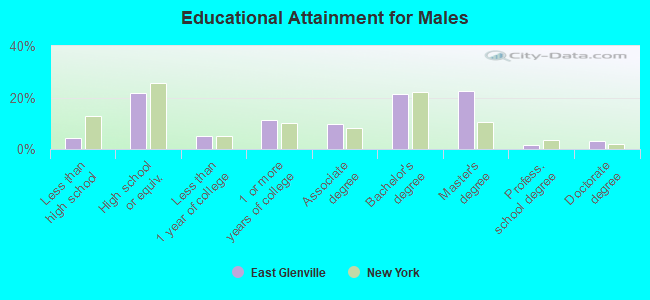
Education attainment for males 25 years and older:
- No schooling: 33
- Nursery to 4th grade: 0
- 5th and 6th grade: 0
- 7th and 8th grade: 0
- 9th grade: 9
- 10th grade: 0
- 11th grade: 14
- 12th grade, no diploma: 96
- High school graduate (or equivalency): 806
- Less than 1 year of college: 190
- Some college more than 1 year, no degree: 421
- Associate degree: 355
- Bachelor's degree: 790
- Master's degree: 831
- Professional school degree: 62
- Doctorate degree: 113
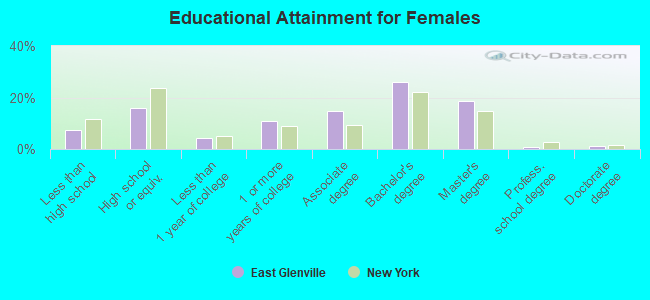
Education attainment for females 25 years and older:
- No schooling: 102
- Nursery to 4th grade: 0
- 5th and 6th grade: 0
- 7th and 8th grade: 33
- 9th grade: 56
- 10th grade: 31
- 11th grade: 22
- 12th grade, no diploma: 103
- High school graduate (or equivalency): 725
- Less than 1 year of college: 190
- Some college more than 1 year, no degree: 500
- Associate degree: 675
- Bachelor's degree: 1,196
- Master's degree: 861
- Professional school degree: 42
- Doctorate degree: 56


Housing units in structures:
- One, detached: 3,281
- One, attached: 65
- Two: 22
- 3 or 4: 430
- 5 to 9: 653
- 10 to 19: 373
- 20 to 49: 56
- 50 or more: 374
- Mobile homes: 9
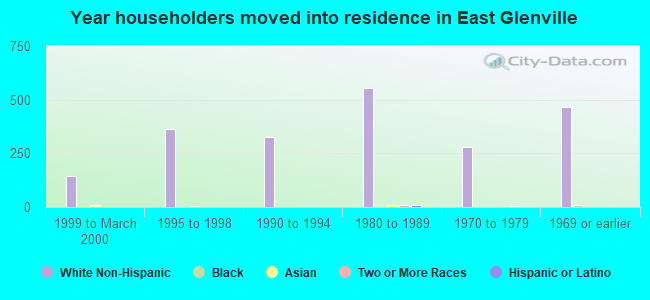
House/condo owner moved in on average 14 years ago
Renter moved in on average 2 years ago
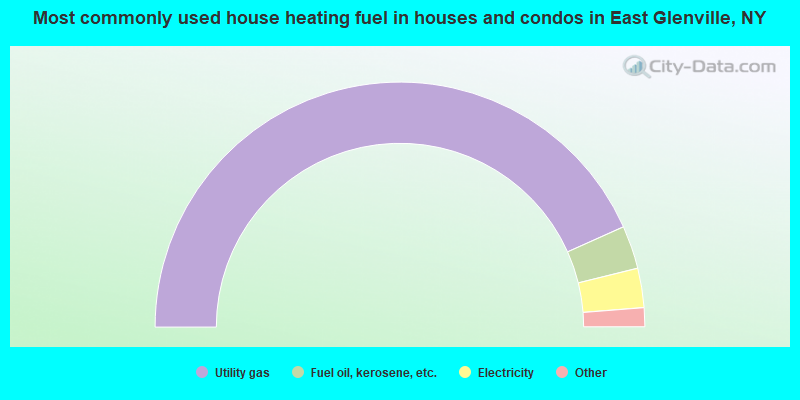
- 86.5%Utility gas
- 5.7%Fuel oil, kerosene, etc.
- 5.2%Electricity
- 2.3%Bottled, tank, or LP gas
- 0.2%Wood
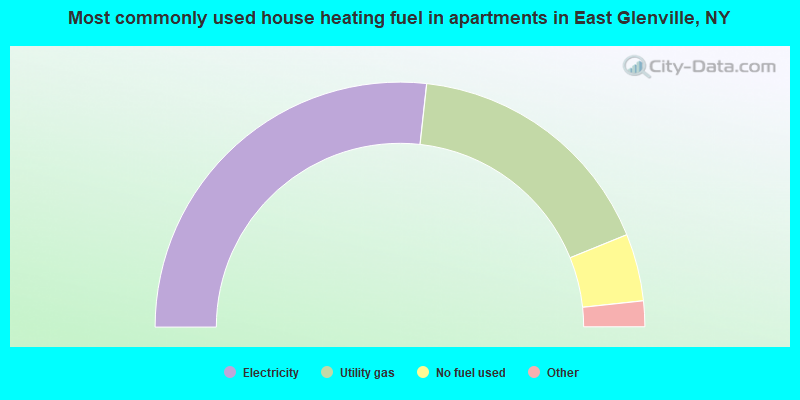
- 53.5%Electricity
- 34.2%Utility gas
- 8.9%No fuel used
- 2.0%Fuel oil, kerosene, etc.
- 1.3%Bottled, tank, or LP gas
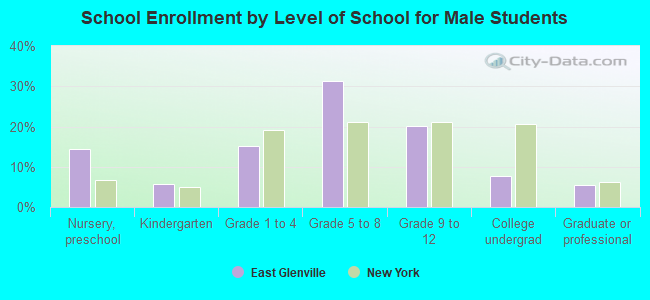
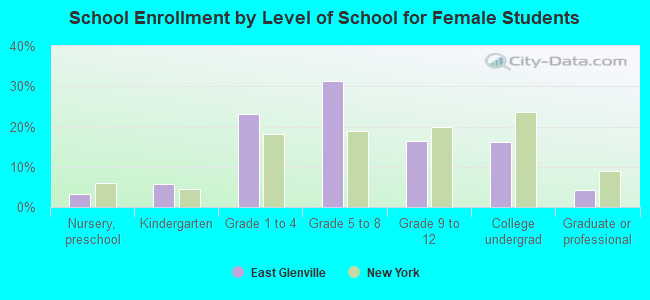
Private vs. public school enrollment:
| Here: | 0.0% |
| New York: | 15.6% |
| Here: | 5.7% |
| New York: | 15.0% |
| Here: | 50.6% |
| New York: | 39.2% |