Housing density: 109 houses/condos per square mile
Median price asked for vacant for-sale houses and condos in 2022 in this county: $360,195.
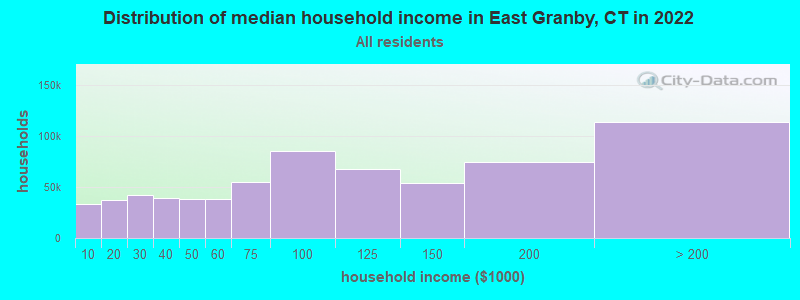
Median contract rent in 2022: $1,217 (lower quartile is $997, upper quartile is $1,616)
Median rent asked for vacant for-rent units in 2022: $344
Median gross rent in East Granby, CT in 2022: $1,431
Housing units in East Granby with a mortgage: 1,086 (104 second mortgage, 167 home equity loan, 8 both second mortgage and home equity loan) Houses without a mortgage: 268
Compare current foreclosures near East Granby, CT:
In family households: 715,089 (143,179 male householders, 84,652 female householders)
161,327 spouses, 258,438 children (243,975 natural, 5,783 adopted, 8,680 stepchildren), 15,602 grandchildren, 8,779 brothers or sisters, 9,385 parents, foster children, 10,085 other relatives, 18,701 non-relatives
In nonfamily households: 150,698 (54,155 male householders (41,831 living alone)), 68,868 female householders (58,693 living alone)), 27,675 nonrelatives
In group quarters: 28,227 (15,383 institutionalized population)
135,700 married couples with children.
56,984 single-parent households (8,611 men, 48,373 women).
93.2% of residents of East Granby speak English at home.
1.3% of residents speak Spanish at home (88% speak English very well, 12% speak English not well).
4.6% of residents speak other Indo-European language at home (77% speak English very well, 12% speak English well, 11% speak English not well).
0.7% of residents speak Asian or Pacific Island language at home (78% speak English very well, 22% speak English well).
0.2% of residents speak other language at home (100% speak English not well).
Foreign born population: 257 (4.7%)
(72.4% of them are naturalized citizens)
Year of entry for the foreign-born population in East Granby, Connecticut
421995 to March 2000
101990 to 1994
301985 to 1989
71980 to 1984
171975 to 1979
01970 to 1974
271965 to 1969
27Before 1965
First ancestries reported:
Italian: 964 (16.4%)
Irish: 850 (14.4%)
German: 628 (10.7%)
English: 568 (9.6%)
Polish: 557 (9.5%)
Other: 495 (8.4%)
French: 428 (7.3%)
French Canadian: 293 (5.0%)
United States: 214 (3.6%)
Russian: 180 (3.1%)
Lithuanian: 124 (2.1%)
Scottish: 120 (2.0%)
Dutch: 67 (1.1%)
Swedish: 66 (1.1%)
Portuguese: 57 (1.0%)
Welsh: 57 (1.0%)
Hungarian: 51 (0.9%)
Ukrainian: 45 (0.8%)
Scotch-Irish: 39 (0.7%)
Danish: 28 (0.5%)
Norwegian: 26 (0.4%)
Slovak: 19 (0.3%)
Subsaharan African: 10 (0.2%)
Czech: 8 (0.1%)
Most common places of birth for foreign-born residents (%):
India
East Granby:
16.9% (27)
Connecticut:
4.1% (15,108)
Canada
East Granby:
16.9% (27)
Connecticut:
5.2% (19,083)
China, excluding Hong Kong and Taiwan
East Granby:
15.0% (24)
Connecticut:
2.5% (9,358)
Romania
East Granby:
11.9% (19)
Connecticut:
0.6% (2,371)
Guyana
East Granby:
11.9% (19)
Connecticut:
0.8% (2,940)
Ireland
East Granby:
8.1% (13)
Connecticut:
1.2% (4,344)
Sweden
East Granby:
5.6% (9)
Connecticut:
0.4% (1,374)
Other South Eastern Asia
East Granby:
5.0% (8)
Connecticut:
0.1% (299)
Korea
East Granby:
4.4% (7)
Connecticut:
1.5% (5,508)
Vietnam
East Granby:
4.4% (7)
Connecticut:
1.8% (6,680)
Place of birth for U.S.-born residents:
This state: 2,923
Other state: 1,599
Northeast: 1,058
Midwest: 234
South: 189
West: 118
62% of East Granby residents lived in the same house 5 years ago. Out of people who lived in different houses, 74% lived in this county. Out of people who lived in different counties, 30% lived in Connecticut.
Education attainment for males 25 years and older:
No schooling: 0
Nursery to 4th grade: 8
5th and 6th grade: 0
7th and 8th grade: 25
9th grade: 28
10th grade: 30
11th grade: 10
12th grade, no diploma: 37
High school graduate (or equivalency): 403
Less than 1 year of college: 67
Some college more than 1 year, no degree: 232
Associate degree: 137
Bachelor's degree: 337
Master's degree: 286
Professional school degree: 21
Doctorate degree: 23
Education attainment for females 25 years and older: