East Haven, CT (Connecticut) Houses and Residents
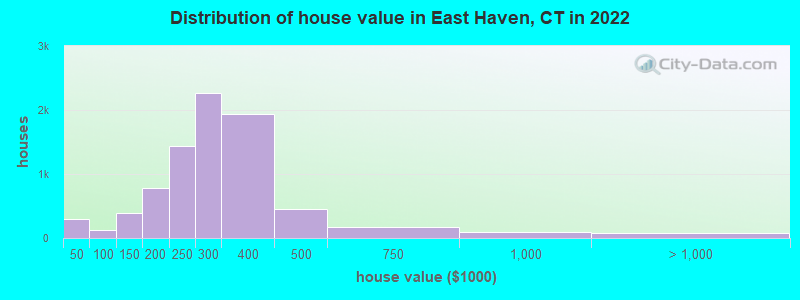
Estimated median house or condo value in 2022: $281,664 (it was $125,000 in 2000 )
East Haven:
$281,664Connecticut:
$347,200
Lower value quartile - upper value quartile: $220,777 - $342,839Mean price in 2022: Detached houses: $308,387 Here:
$308,387State:
$503,946
Townhouses or other attached units: $230,828 Here:
$230,828State:
$304,959
In 2-unit structures: $339,041 Here:
$339,041State:
$304,133
In 3-to-4-unit structures: $238,426 Here:
$238,426State:
$272,970
In 5-or-more-unit structures: $223,464 Here:
$223,464State:
$249,308
Total population: 29,257 (Urban population: 28,160, Rural population: 29 (all nonfarm) )
Houses: 11,713 (11,092 occupied: 8,463 owner occupied, 2,750 renter occupied )
% of renters here:
25%State:
34%
Housing density: 955 houses/condos per square mile
Median price asked for vacant for-sale houses and condos in 2022: $193,002.
Median contract rent in 2022: $1,158 (lower quartile is $905, upper quartile is $1,532)
Median rent asked for vacant for-rent units in 2022: $1,134
Median gross rent in East Haven, CT in 2022: $1,328
Housing units in East Haven with a mortgage: 5,541 (515 second mortgage, 19 home equity loan, 395 both second mortgage and home equity loan )Houses without a mortgage: 73
Median household income for houses/condos with a mortgage: $114,133
Median household income for apartments without a mortgage: $76,444
Median monthly housing costs: $1,488
Data:
Median house or condo value ($)
Median house or condo value ($ change since 2000)
Median house or condo value ($) - White
Median house or condo value ($) - Black or African American
Median house or condo value ($) - Asian
Median house or condo value ($) - Hispanic or Latino
Median house or condo value ($) - American Indian and Alaska Native
Median house or condo value ($) - Multirace
Median house or condo value ($) - Other Race
Median price asked for mobile homes ($)
Household density (households per square mile)
Mean house or condo value by units in structure - 1, detached ($)
Mean house or condo value by units in structure - 1, attached ($)
Mean house or condo value by units in structure - 2 ($)
Mean house or condo value by units in structure by units in structure - 3 or 4 ($)
Mean house or condo value by units in structure - 5 or more ($)
Mean house or condo value by units in structure - Boat, RV, van, etc. ($)
Mean house or condo value by units in structure - Mobile home ($)
Median contract rent ($)
Median contract rent - Lower quartile ($)
Median contract rent - Upper quartile ($)
Median gross rent ($)
Urban houses (%)
Rural houses (%)
Houses occupied (%)
Houses occupied (% change since 2000)
Houses owner occupied (%)
Houses owner occupied (% change since 2000)
Houses renter occupied (%)
Houses renter occupied (% change since 2000)
Vacant housing units - For rent (%)
Vacant housing units - For rent (% change since 2000)
Vacant housing units - For sale only (%)
Vacant housing units - For sale only (% change since 2000)
Vacant housing units - Rented or sold, not occupied (%)
Vacant housing units - Rented or sold, not occupied (% change since 2000)
Vacant housing units - For seasonal, recreational, or occasional use (%)
Vacant housing units - For seasonal, recreational, or occasional use (% change since 2000)
Vacant housing units - For migrant workers (%)
Vacant housing units - For migrant workers (% change since 2000)
Vacant housing units - Other vacant (%)
Vacant housing units - Other vacant (% change since 2000)
Median monthly housing costs ($)
Median household income for houses/condos with a mortgage ($)
Median household income for houses/condos without a mortgage ($)
Median household income ($)
Median household income ($) - White
Median household income ($) - Black or African American
Median household income ($) - Asian
Median household income ($) - Hispanic or Latino
Median household income ($) - American Indian and Alaska Native
Median household income ($) - Multirace
Median household income ($) - Other Race
Mortgage status - with mortgage (%)
Mortgage status - with second mortgage (%)
Mortgage status - with home equity loan (%)
Mortgage status - with both second mortgage and home equity loan (%)
Mortgage status - without a mortgage (%)
Median year house/condo built
Median year apartment built
Household type by relationship - Male householder living alone (%)
Household type by relationship - Male householder not living alone (%)
Household type by relationship - Female householder living alone (%)
Household type by relationship - Female householder not living alone (%)
Household type by relationship - Opposite-Sex spouse (%)
Household type by relationship - Same-Sex spouse (%)
Household type by relationship - Opposite-Sex unmarried partner (%)
Household type by relationship - Same-Sex unmarried partner (%)
Household type by relationship - In group quarters (%)
Size of family households - 2-person household (%)
Size of family households - 3-person household (%)
Size of family households - 4-person household (%)
Size of family households - 5-person household (%)
Size of family households - 6-person household (%)
Size of family households - 7-or-more-person household (%)
Size of nonfamily households - 1-person household (%)
Size of nonfamily households - 2-person household (%)
Size of nonfamily households - 3-person household (%)
Size of nonfamily households - 4-person household (%)
Size of nonfamily households - 5-person household (%)
Size of nonfamily households - 6-person household (%)
Size of nonfamily households - 7-or-moreperson household (%)
Year house built - Built 2010 or later (%)
Year house built - Built 2000 to 2009 (%)
Year house built - Built 1990 to 1999 (%)
Year house built - Built 1980 to 1989 (%)
Year house built - Built 1970 to 1979 (%)
Year house built - Built 1960 to 1969 (%)
Year house built - Built 1950 to 1959 (%)
Year house built - Built 1940 to 1949 (%)
Year house built - Built 1939 or earlier (%)
Median number of rooms in houses and condos
Median number of rooms in apartments
Median number of bedrooms in owner occupied houses
Mean number of bedrooms in owner occupied houses
Median number of bedrooms in renter occupied houses
Mean number of bedrooms in renter occupied houses
Median number of vehichles in owner occupied houses
Mean number of vehichles in owner occupied houses
Median number of vehichles in renter occupied houses
Mean number of vehichles in renter occupied houses
Rooms in owner-occupied houses - 1 room (%)
Rooms in owner-occupied houses - 2 rooms (%)
Rooms in owner-occupied houses - 3 rooms (%)
Rooms in owner-occupied houses - 4 rooms (%)
Rooms in owner-occupied houses - 5 rooms (%)
Rooms in owner-occupied houses - 6 rooms (%)
Rooms in owner-occupied houses - 7 rooms (%)
Rooms in owner-occupied houses - 8 rooms (%)
Rooms in owner-occupied houses - 9+ rooms (%)
Rooms in renter-occupied houses - 1 room (%)
Rooms in renter-occupied houses - 2 rooms (%)
Rooms in renter-occupied houses - 3 rooms (%)
Rooms in renter-occupied houses - 4 rooms (%)
Rooms in renter-occupied houses - 5 rooms (%)
Rooms in renter-occupied houses - 6 rooms (%)
Rooms in renter-occupied houses - 7 rooms (%)
Rooms in renter-occupied houses - 8 rooms (%)
Rooms in renter-occupied houses - 9+ rooms (%)
Bedrooms in owner-occupied houses - no bedrooms (%)
Bedrooms in owner-occupied houses - 1 bedroom (%)
Bedrooms in owner-occupied houses - 2 bedrooms (%)
Bedrooms in owner-occupied houses - 3 bedrooms (%)
Bedrooms in owner-occupied houses - 4 bedrooms (%)
Bedrooms in owner-occupied houses - 5+ bedrooms (%)
Bedrooms in renter-occupied houses - no bedrooms (%)
Bedrooms in renter-occupied houses - 1 bedroom (%)
Bedrooms in renter-occupied houses - 2 bedrooms (%)
Bedrooms in renter-occupied houses - 3 bedrooms (%)
Bedrooms in renter-occupied houses - 4 bedrooms (%)
Bedrooms in renter-occupied houses - 5+ bedrooms (%)
Vehicles available in owner-occupied houses - no vehicle available (%)
Vehicles available in owner-occupied houses - 1 vehicle available(%)
Vehicles available in owner-occupied houses - 2 Vehicles available (%)
Vehicles available in owner-occupied houses - 3 Vehicles available (%)
Vehicles available in owner-occupied houses - 4 Vehicles available (%)
Vehicles available in owner-occupied houses - 5+ Vehicles available (%)
Vehicles available in renter-occupied houses - no vehicle available (%)
Vehicles available in renter-occupied houses - 1 vehicle available (%)
Vehicles available in renter-occupied houses - 2 Vehicles available (%)
Vehicles available in renter-occupied houses - 3 Vehicles available (%)
Vehicles available in renter-occupied houses - 4 Vehicles available (%)
Vehicles available in renter-occupied houses - 5+ Vehicles available (%)
Housing units in structures - 1, detached (%)
Housing units in structures - 1, attached (%)
Housing units in structures - 2 (%)
Housing units in structures - 3 or 4 (%)
Housing units in structures - 5 to 9 (%)
Housing units in structures - 10 to 19 (%)
Housing units in structures - 20 to 49 (%)
Housing units in structures - 50 or more (%)
Housing units in structures - Mobile home (%)
Housing units in structures - Boat, RV, van, etc. (%)
Housing units in structures - Owners - 1, detached (%)
Housing units in structures - Owners - 1, attached (%)
Housing units in structures - Owners - 2 (%)
Housing units in structures - Owners - 3 or 4 (%)
Housing units in structures - Owners - 5 to 9 (%)
Housing units in structures - Owners - 10 to 19 (%)
Housing units in structures - Owners - 20 to 49 (%)
Housing units in structures - Owners - 50 or more (%)
Housing units in structures - Owners - Mobile home (%)
Housing units in structures - Owners - Boat, RV, van, etc. (%)
Housing units in structures - Renters - 1, detached (%)
Housing units in structures - Renters - 1, attached (%)
Housing units in structures - Renters - 2 (%)
Housing units in structures - Renters - 3 or 4 (%)
Housing units in structures - Renters - 5 to 9 (%)
Housing units in structures - Renters - 10 to 19 (%)
Housing units in structures - Renters - 20 to 49 (%)
Housing units in structures - Renters - 50 or more (%)
Housing units in structures - Renters - Mobile home (%)
Housing units in structures - Renters - Boat, RV, van, etc. (%)
House/condo owner moved in on average (years ago)
Renter moved in on average (years ago)
Year householder moved into unit - Moved in 1999 to March 2000 (%)
Year householder moved into unit - Moved in 1999 to March 2000 (%) - White
Year householder moved into unit - Moved in 1999 to March 2000 (%) - Black or African American
Year householder moved into unit - Moved in 1999 to March 2000 (%) - Asian
Year householder moved into unit - Moved in 1999 to March 2000 (%) - Hispanic or Latino
Year householder moved into unit - Moved in 1999 to March 2000 (%) - American Indian and Alaska Native
Year householder moved into unit - Moved in 1999 to March 2000 (%) - Multirace
Year householder moved into unit - Moved in 1999 to March 2000 (%) - Other Race
Year householder moved into unit - Moved in 1995 to 1998 (%)
Year householder moved into unit - Moved in 1995 to 1998 (%) - White
Year householder moved into unit - Moved in 1995 to 1998 (%) - Black or African American
Year householder moved into unit - Moved in 1995 to 1998 (%) - Asian
Year householder moved into unit - Moved in 1995 to 1998 (%) - Hispanic or Latino
Year householder moved into unit - Moved in 1995 to 1998 (%) - American Indian and Alaska Native
Year householder moved into unit - Moved in 1995 to 1998 (%) - Multirace
Year householder moved into unit - Moved in 1995 to 1998 (%) - Other Race
Year householder moved into unit - Moved in 1990 to 1994 (%)
Year householder moved into unit - Moved in 1990 to 1994 (%) - White
Year householder moved into unit - Moved in 1990 to 1994 (%) - Black or African American
Year householder moved into unit - Moved in 1990 to 1994 (%) - Asian
Year householder moved into unit - Moved in 1990 to 1994 (%) - Hispanic or Latino
Year householder moved into unit - Moved in 1990 to 1994 (%) - American Indian and Alaska Native
Year householder moved into unit - Moved in 1990 to 1994 (%) - Multirace
Year householder moved into unit - Moved in 1990 to 1994 (%) - Other Race
Year householder moved into unit - Moved in 1980 to 1989 (%)
Year householder moved into unit - Moved in 1980 to 1989 (%) - White
Year householder moved into unit - Moved in 1980 to 1989 (%) - Black or African American
Year householder moved into unit - Moved in 1980 to 1989 (%) - Asian
Year householder moved into unit - Moved in 1980 to 1989 (%) - Hispanic or Latino
Year householder moved into unit - Moved in 1980 to 1989 (%) - American Indian and Alaska Native
Year householder moved into unit - Moved in 1980 to 1989 (%) - Multirace
Year householder moved into unit - Moved in 1980 to 1989 (%) - Other Race
Year householder moved into unit - Moved in 1970 to 1979 (%)
Year householder moved into unit - Moved in 1970 to 1979 (%) - White
Year householder moved into unit - Moved in 1970 to 1979 (%) - Black or African American
Year householder moved into unit - Moved in 1970 to 1979 (%) - Asian
Year householder moved into unit - Moved in 1970 to 1979 (%) - Hispanic or Latino
Year householder moved into unit - Moved in 1970 to 1979 (%) - American Indian and Alaska Native
Year householder moved into unit - Moved in 1970 to 1979 (%) - Multirace
Year householder moved into unit - Moved in 1970 to 1979 (%) - Other Race
Year householder moved into unit - Moved in 1969 or earlier (%)
Year householder moved into unit - Moved in 1969 or earlier (%) - White
Year householder moved into unit - Moved in 1969 or earlier (%) - Black or African American
Year householder moved into unit - Moved in 1969 or earlier (%) - Asian
Year householder moved into unit - Moved in 1969 or earlier (%) - Hispanic or Latino
Year householder moved into unit - Moved in 1969 or earlier (%) - American Indian and Alaska Native
Year householder moved into unit - Moved in 1969 or earlier (%) - Multirace
Year householder moved into unit - Moved in 1969 or earlier (%) - Other Race
Housing units lacking complete plumbing facilities (%)
Housing units lacking complete kitchen facilities (%)
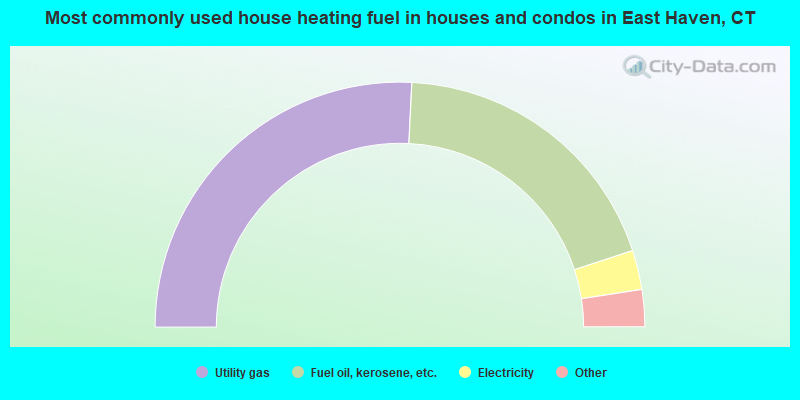
House heating fuel used in houses and condos - Utility gas (%)
House heating fuel used in houses and condos - Bottled, tank, or LP gas (%)
House heating fuel used in houses and condos - Electricity (%)
House heating fuel used in houses and condos - Fuel oil, kerosene, etc. (%)
House heating fuel used in houses and condos - Coal or coke (%)
House heating fuel used in houses and condos - Wood (%)
House heating fuel used in houses and condos - Solar energy (%)
House heating fuel used in houses and condos - Other fuel (%)
House heating fuel used in houses and condos - No fuel used (%)
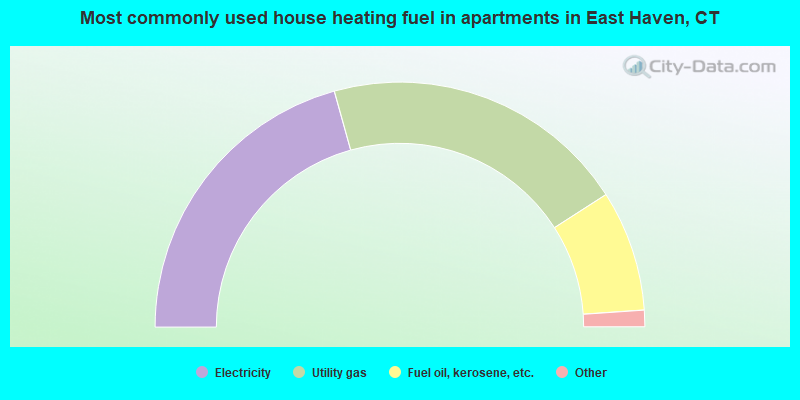
House heating fuel used in apartments - Utility gas (%)
House heating fuel used in apartments - Bottled, tank, or LP gas (%)
House heating fuel used in apartments - Electricity (%)
House heating fuel used in apartments - Fuel oil, kerosene, etc. (%)
House heating fuel used in apartments - Coal or coke (%)
House heating fuel used in apartments - Wood (%)
House heating fuel used in apartments - Solar energy (%)
House heating fuel used in apartments - Other fuel (%)
House heating fuel used in apartments - No fuel used (%)
Median year house/condo built: 1964Median year apartment built: 1977Household type by relationship:
Households: 27,985
Male householders: 5,321 (1,545 living alone ), Female householders: 5,751 (1,939 living alone )4,914 spouses (4,853 opposite-sex spouses ), 868 unmarried partners , (796 opposite-sex unmarried partners ), 7,428 children (7,014 natural , 136 adopted , 277 stepchildren ), 960 grandchildren , 385 brothers or sisters , 375 parents , 10 foster children , 860 other relatives , 832 non-relatives In group quarters: 276
Size of family households: 3,162 2-persons , 1,656 3-persons , 1,083 4-persons , 649 5-persons , 277 6-persons , 92 7-or-more-persons .
Size of nonfamily households: 3,679 1-person , 543 2-persons , 64 3-persons , 12 4-persons .
2,394 married couples with children. single-parent households (631 men , 837 women ).
81.6% of residents of East Haven speak English at home. of residents speak Spanish at home (66% speak English very well , 19% speak English well , 12% speak English not well , 3% don't speak English at all ).of residents speak other Indo-European language at home (64% speak English very well , 32% speak English well , 3% speak English not well ).of residents speak Asian or Pacific Island language at home (39% speak English very well , 24% speak English well , 37% speak English not well ).of residents speak other language at home (29% speak English very well , 71% speak English not well ).
Foreign born population: 3,054 (10.9%)of them are naturalized citizens )
Median number of rooms in houses and condos:
Median number of rooms in apartments
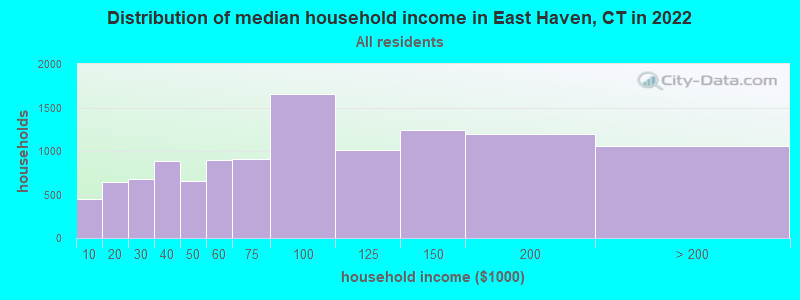
East Haven, CT household income distribution 446 Less than $10,000639 $10,000 to $19,999683 $20,000 to $29,999880 $30,000 to $39,999660 $40,000 to $49,999901 $50,000 to $59,999910 $60,000 to $74,9991,651 $75,000 to $99,9991,013 $100,000 to $124,9991,242 $125,000 to $149,9991,198 $150,000 to $199,9991,055 $200,000 or more
Home value of owner - occupied houses in 2022 in East Haven, CT 47 $10,000 to $14,99939 $15,000 to $19,99981 $20,000 to $24,99951 $25,000 to $29,99912 $30,000 to $34,99961 $35,000 to $39,99933 $50,000 to $59,99925 $70,000 to $79,99923 $80,000 to $89,99941 $90,000 to $99,999160 $100,000 to $124,999227 $125,000 to $149,999457 $150,000 to $174,999323 $175,000 to $199,9991,430 $200,000 to $249,9992,262 $250,000 to $299,9991,943 $300,000 to $399,999448 $400,000 to $499,999179 $500,000 to $749,99986 $750,000 to $999,99912 $1,000,000 to $1,499,99963 $2,000,000 or moreRent paid by renters in 2022 in East Haven, CT 2 Less than $10022 $100 to $14923 $150 to $19969 $200 to $24988 $350 to $39947 $400 to $44962 $500 to $54917 $550 to $59911 $600 to $649103 $650 to $69943 $700 to $749104 $750 to $79949 $800 to $899155 $900 to $999782 $1,000 to $1,249344 $1,250 to $1,499538 $1,500 to $1,999132 $2,000 to $2,4993 $2,500 to $2,999116 No cash rent
Percentage of workers working in this county: 85.0%Number of people working at home: 1,323 (9.2% of all workers )
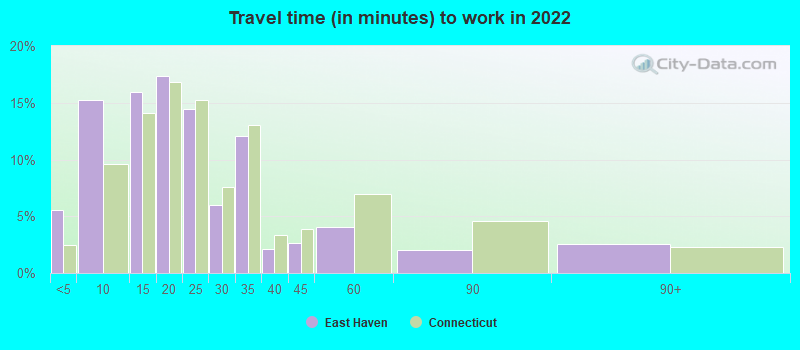
Travel time to work (commute)
Less than 5 minutes: 4715 to 9 minutes: 1,23110 to 14 minutes: 2,03015 to 19 minutes: 2,58320 to 24 minutes: 2,25125 to 29 minutes: 1,05030 to 34 minutes: 1,12835 to 39 minutes: 8140 to 44 minutes: 32645 to 59 minutes: 59060 to 89 minutes: 66690 or more minutes: 387
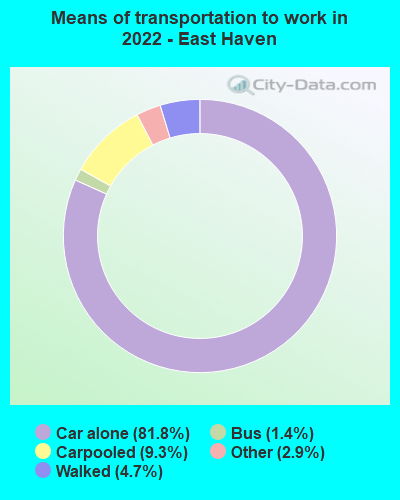
Means of transportation to work:
Drove a car alone: 5,688 (68.0%)Carpooled: 683 (8.2%)Bus : 100 (1.2%)Taxi: 241 (2.9%)Walked: 347 (4.2%)Worked at home: 1,323 (15.8%)
Unemployment by race in 2022
Unemployment rate for White non-Hispanic residents 3.7% Males4.1% FemalesUnemployment rate for Black residents 4.2% Males11.7% FemalesUnemployment rate for other race residents 3.0% MalesUnemployment rate for Hispanic or Latino residents 3.4% Males1.0% Females
Year of entry for the foreign-born population in East Haven, Connecticut
799 2010 or later 653 2000 to 2009 842 1990 to 1999 343 1980 to 1989 249 1970 to 1979 798 Before 1970
First ancestries reported:
Italian: 5,726 (39.9%)
Irish: 1,420 (9.9%)
English: 488 (3.4%)
Polish: 461 (3.2%)
American: 399 (2.8%)
German: 375 (2.6%)
Brazilian: 265 (1.8%)
European: 219 (1.5%)
Portuguese: 83 (0.6%)
Scottish: 74 (0.5%)
French Canadian: 74 (0.5%)
Ukrainian: 69 (0.5%)
Greek: 59 (0.4%)
Turkish: 58 (0.4%)
Barbadian: 57 (0.4%)
Jamaican: 55 (0.4%)
Arab: 52 (0.4%)
Eastern European: 36 (0.3%)
Dutch: 33 (0.2%)
French: 26 (0.2%)
Welsh: 24 (0.2%)
Czechoslovakian: 23 (0.2%)
Swedish: 22 (0.2%)
Albanian: 22 (0.2%)
Egyptian: 19 (0.1%)
Nigerian: 18 (0.1%)
Danish: 18 (0.1%)
Lithuanian: 17 (0.1%)
Hungarian: 17 (0.1%)
Palestinian: 16 (0.1%)
Scandinavian: 14 (0.10%)
Norwegian: 14 (0.10%)
Syrian: 13 (0.09%)
African: 12 (0.08%)
Slovak: 7 (0.05%)
Canadian: 5 (0.03%)
Czech: 4 (0.03%)
Scotch-Irish: 2 (0.01%) Most common places of birth for foreign-born residents (%): Italy East Haven:
14.8% (453)Connecticut:
2.8% (15,141)
El Salvador East Haven:
13.3% (407)Connecticut:
1.1% (6,024)
Ecuador East Haven:
12.6% (384)Connecticut:
4.4% (24,026)
Mexico East Haven:
7.8% (239)Connecticut:
4.8% (25,802)
China, excluding Hong Kong and Taiwan East Haven:
5.1% (157)Connecticut:
4.4% (24,001)
Dominican Republic East Haven:
4.4% (134)Connecticut:
5.0% (27,361)
Chile East Haven:
4.2% (128)Connecticut:
0.4% (2,399)
Colombia East Haven:
3.2% (98)Connecticut:
3.3% (18,124)
Brazil East Haven:
2.9% (90)Connecticut:
4.7% (25,461)
Vietnam East Haven:
2.7% (81)Connecticut:
1.2% (6,448)
Poland East Haven:
2.3% (71)Connecticut:
4.0% (21,729)
Peru East Haven:
2.2% (67)Connecticut:
2.5% (13,591)
India East Haven:
1.9% (58)Connecticut:
7.3% (39,879)
Philippines East Haven:
1.9% (58)Connecticut:
1.9% (10,545)
Germany East Haven:
1.7% (51)Connecticut:
1.3% (7,149)
Place of birth for U.S.-born residents:
This state: 20,064Other state: 3,809Northeast: 2,498Midwest: 360South: 655West: 283 92.4% of East Haven residents lived in the same house 1 years ago.
Out of people who lived in different houses, 40.0% lived in this county.
Out of people who lived in different counties, 42.4% lived in Connecticut.
East Haven:
92.4%State average:
88.4%
Education attainment for males 25 years and older:
No schooling: 200Nursery to 4th grade: 525th and 6th grade: 667th and 8th grade: 859th grade: 4510th grade: 3711th grade: 9112th grade, no diploma: 187High school graduate (or equivalency): 4,812Less than 1 year of college: 716Some college more than 1 year, no degree: 934Associate degree: 500Bachelor's degree: 1,569Master's degree: 538Professional school degree: 181Doctorate degree: 51
Education attainment for females 25 years and older:
No schooling: 221Nursery to 4th grade: 415th and 6th grade: 777th and 8th grade: 299th grade: 7810th grade: 10711th grade: 15812th grade, no diploma: 105High school graduate (or equivalency): 4,384Less than 1 year of college: 868Some college more than 1 year, no degree: 1,405Associate degree: 758Bachelor's degree: 1,492Master's degree: 1,035Professional school degree: 74Doctorate degree: 65
Housing units in structures:
One, detached: 8,049One, attached: 828Two: 3493 or 4: 5605 to 9: 65110 to 19: 40020 to 49: 25850 or more: 568Mobile homes: 46Housing units lacking complete plumbing facilities in 2022: 0.7%Housing units lacking complete kitchen facilities in 2022: 1.7%House/condo owner moved in on average 15 years ago
Renter moved in on average 3 years ago
Private vs. public school enrollment:
Students in private schools in grades 1 to 8 (elementary and middle school): 39 Here:
2.2%Connecticut:
9.5%
Students in private schools in grades 9 to 12 (high school): 136 Here:
8.3%Connecticut:
12.9%
Students in private undergraduate colleges: 282 Here:
21.8%Connecticut:
35.5%