East Kingston, NH (New Hampshire) Houses and Residents
| East Kingston: | $562,534 |
| New Hampshire: | $384,700 |
Total population: 2,357 (Urban population: 128, Rural population: 1,656 (28 farm, 1,628 nonfarm))
Houses: 648 (629 occupied: 576 owner occupied, 53 renter occupied)
| % of renters here: | 8% |
| State: | 28% |
Housing density: 65 houses/condos per square mile
Median price asked for vacant for-sale houses and condos in 2022 in this county: $227,726.
Median contract rent in 2022: $1,629 (lower quartile is $1,064, upper quartile is $1,997)
Median rent asked for vacant for-rent units in 2022: $780
Median gross rent in East Kingston, NH in 2022: $1,794
Housing units in East Kingston with a mortgage: 369 (31 second mortgage, 54 home equity loan, 0 both second mortgage and home equity loan)
Houses without a mortgage: 45
Compare current foreclosures near East Kingston, NH:
| Photo | Address | Area | Beds / Baths | Price | Details |
|---|---|---|---|---|---|

|
#1
Cedar St # A
Haverhill, MA 01830
|
1,134 sq. feet
|
2 baths 2 beds |
$209,300
|
show details |

|
#2
Main St
Fremont, NH 03044
|
1,470 sq. feet
|
2 baths 4 beds |
$306,800
|
show details |

|
#3
Brentwood Rd
Exeter, NH 03833
|
2,756 sq. feet
|
2 baths 3 beds |
$419,900
|
show details |

|
#4
Lawrence Rd
Salem, NH 03079
|
1,305 sq. feet
|
1 baths 1 beds |
show details | |

|
#5
High St
Derry, NH 03038
|
2,149 sq. feet
|
3 baths 4 beds |
show details | |

|
#6
Michael Ave
Derry, NH 03038
|
1,536 sq. feet
|
1 baths 4 beds |
show details | |

|
#7
Everett St
Derry, NH 03038
|
1,525 sq. feet
|
1 baths 3 beds |
show details | |

|
#8
Redfield Cir
Derry, NH 03038
|
2,124 sq. feet
|
3 baths 4 beds |
show details | |

|
#9
Maclarnon Rd
Salem, NH 03079
|
1,578 sq. feet
|
2 baths 3 beds |
show details | |

|
#10
Campo Seco St
Lawrence, MA 01841
|
2,276 sq. feet
|
3 baths 4 beds |
show details |
| Photo | Address | Area | Beds / Baths | Price | Details |
|---|---|---|---|---|---|

|
#11
Washington St
Haverhill, MA 01832
|
3,162 sq. feet
|
5 baths 5 beds |
show details | |

|
#12
Warrenton Rd
Haverhill, MA 01832
|
1,200 sq. feet
|
1 baths 3 beds |
show details | |

|
#13
S Webster St
Haverhill, MA 01835
|
978 sq. feet
|
1 baths 2 beds |
show details | |

|
#14
Adams Park
Rye, NH 03870
|
1,008 sq. feet
|
2 baths 3 beds |
show details | |

|
#15
Berry Rd
Derry, NH 03038
|
1,942 sq. feet
|
1 baths 2 beds |
show details | |

|
#16
Golf Ave
Methuen, MA 01844
|
2,208 sq. feet
|
1 baths 3 beds |
show details | |

|
#17
Baldwin St
Haverhill, MA 01832
|
2,504 sq. feet
|
2 baths 6 beds |
show details | |

|
#18
S Warren St
Haverhill, MA 01835
|
1,356 sq. feet
|
1 baths 3 beds |
show details | |

|
#19
Hunters Run Pl
Haverhill, MA 01832
|
948 sq. feet
|
1 baths 2 beds |
show details | |

|
#20
Marshall St
Methuen, MA 01844
|
840 sq. feet
|
1 baths 2 beds |
show details |
| Photo | Address | Area | Beds / Baths | Price | Details |
|---|---|---|---|---|---|

|
#21
Danielle Dr
Haverhill, MA 01832
|
1,548 sq. feet
|
2 baths 3 beds |
show details | |

|
#22
Pond St # 1
Methuen, MA 01844
|
1,540 sq. feet
|
1 baths 3 beds |
show details | |

|
#23
Byron St
Haverhill, MA 01835
|
2,446 sq. feet
|
1 baths 4 beds |
show details | |

|
#24
Webster St
Salem, NH 03079
|
1,912 sq. feet
|
2 baths 3 beds |
show details | |

|
#25
Hazen Ave
Haverhill, MA 01830
|
2,594 sq. feet
|
2 baths 7 beds |
show details | |

|
#26
Lawrence St
Lawrence, MA 01841
|
4,206 sq. feet
|
3 baths 9 beds |
show details | |

|
#27
Old Ferry Rd
Haverhill, MA 01830
|
2,099 sq. feet
|
2 baths 4 beds |
show details | |

|
#28
Acorn St # 51
Haverhill, MA 01832
|
896 sq. feet
|
1 baths 2 beds |
show details | |

|
#29
Piscassic St
Newmarket, NH 03857
|
1,608 sq. feet
|
2 baths 4 beds |
show details | |

|
#30
Hilldale Ave
Haverhill, MA 01832
|
1,456 sq. feet
|
2 baths 2 beds |
show details |
| Photo | Address | Area | Beds / Baths | Price | Details |
|---|---|---|---|---|---|

|
#31
Kenoza Ave Apt 1
Haverhill, MA 01830
|
750 sq. feet
|
1 baths 2 beds |
show details | |

|
#32
Sanborn Rd
Derry, NH 03038
|
1,082 sq. feet
|
2 baths 2 beds |
show details | |

|
#33
Hilldale Ave # 2
Haverhill, MA 01832
|
2,000 sq. feet
|
2 baths 4 beds |
show details | |

|
#34
Peyton Way
Haverhill, MA 01832
|
2,724 sq. feet
|
2 baths 4 beds |
show details | |

|
#35
Pine Ave
Haverhill, MA 01832
|
1,159 sq. feet
|
1 baths 4 beds |
show details | |

|
#36
Acorn S 2
Haverhill, MA 01832
|
896 sq. feet
|
1 baths 2 beds |
show details | |

|
#37
Cote Cir
Raymond, NH 03077
|
2,024 sq. feet
|
2 baths 3 beds |
show details | |

|
#38
Cedar St
Haverhill, MA 01830
|
2,162 sq. feet
|
2 baths 3 beds |
show details | |

|
#39
Haverhill Rd
Chester, NH 03036
|
2,702 sq. feet
|
3 baths 3 beds |
show details | |

|
#40
Boardman St
Haverhill, MA 01830
|
1,092 sq. feet
|
2 baths 3 beds |
show details |
| Photo | Address | Area | Beds / Baths | Price | Details |
|---|---|---|---|---|---|

|
#41
Cedar Point Rd
Durham, NH 03824
|
4,052 sq. feet
|
3 baths 3 beds |
show details | |

|
#42
Juniper Wood Dr
Haverhill, MA 01832
|
2,404 sq. feet
|
2 baths 4 beds |
show details | |

|
#43
Steeplechase Ct
Haverhill, MA 01832
|
1,179 sq. feet
|
1 baths 2 beds |
show details | |

|
#44
Came Ave
Haverhill, MA 01830
|
1,890 sq. feet
|
1 baths 3 beds |
show details | |

|
#45
Spofford St
Georgetown, MA 01833
|
3,594 sq. feet
|
4 baths 5 beds |
show details | |

|
#46
Pine Blf # 3
Derry, NH 03038
|
1,872 sq. feet
|
2 baths 3 beds |
show details | |

|
#47
Washington St
Haverhill, MA 01832
|
864 sq. feet
|
1 baths 2 beds |
show details | |

|
#48
Farnham Rd
Rowley, MA 01969
|
1,106 sq. feet
|
2 baths 3 beds |
show details | |

|
#49
Fiddlehead Ln
Chester, NH 03036
|
2,682 sq. feet
|
2 baths 4 beds |
show details | |

|
Check over 1 million property listings on Foreclosure.com!
|
browse all offers | |||

 | Around 95 up to Portsmouth - Looking to buy a house in good school district 475k (11 replies) |
| Moving to southeast NH help!!! (48 replies) |
| Real estate and schools near the seacoast--input please! (13 replies) |
| Epping or East Kingston? (9 replies) |
| Looking at Southern NH...Where would you recommend searching? (15 replies) |
| Portsmouth vs Exeter for New Family (10 replies) |

Household type by relationship:
Households: 292,725- In family households: 247,693 (57,848 male householders, 21,984 female householders)
64,858 spouses, 85,601 children (80,134 natural, 2,077 adopted, 3,390 stepchildren), 3,954 grandchildren, 1,562 brothers or sisters, 2,352 parents, foster children, 1,664 other relatives, 5,842 non-relatives
- In nonfamily households: 45,032 (17,024 male householders (12,402 living alone)), 18,177 female householders (14,574 living alone)), 9,831 nonrelatives
- In group quarters: 2,498 (1,438 institutionalized population)
57,723 married couples with children.
11,266 single-parent households (3,032 men, 8,234 women).
97.5% of residents of East Kingston speak English at home.
0.6% of residents speak Spanish at home (80% speak English very well, 20% speak English well).
1.7% of residents speak other Indo-European language at home (61% speak English very well, 36% speak English well, 4% speak English not well).
0.2% of residents speak other language at home (100% speak English very well).
Foreign born population: 101 (4.9%)
(51.5% of them are naturalized citizens)
| Here: | 6.5 |
| State: | 6.4 |
| Here: | 3.8 |
| State: | 4.0 |

- Bedrooms in owner-occupied houses and condos in East Kingston, New Hampshire
- 0no bedroom
- 111 bedroom
- 1082 bedrooms
- 3493 bedrooms
- 854 bedrooms
- 235+ bedrooms

- Bedrooms in renter-occupied apartments in East Kingston, New Hampshire
- 0no bedroom
- 131 bedroom
- 252 bedrooms
- 113 bedrooms
- 44 bedrooms
- 05+ bedrooms

- Cars and other vehicles available in East Kingston in owner-occupied houses/condos
- 14no vehicle
- 701 vehicle
- 3302 vehicles
- 1283 vehicles
- 204 vehicles
- 145+ vehicles

- Cars and other vehicles available in East Kingston in renter-occupied apartments
- 4no vehicle
- 161 vehicle
- 252 vehicles
- 43 vehicles
- 44 vehicles
- 05+ vehicles

- Rooms in owner-occupied houses in East Kingston, New Hampshire
- 01 room
- 02 rooms
- 83 rooms
- 454 rooms
- 665 rooms
- 1576 rooms
- 1207 rooms
- 1068 rooms
- 749+ rooms

- Rooms in renter-occupied apartments in East Kingston, New Hampshire
- 01 room
- 02 rooms
- 103 rooms
- 194 rooms
- 65 rooms
- 106 rooms
- 07 rooms
- 68 rooms
- 29+ rooms


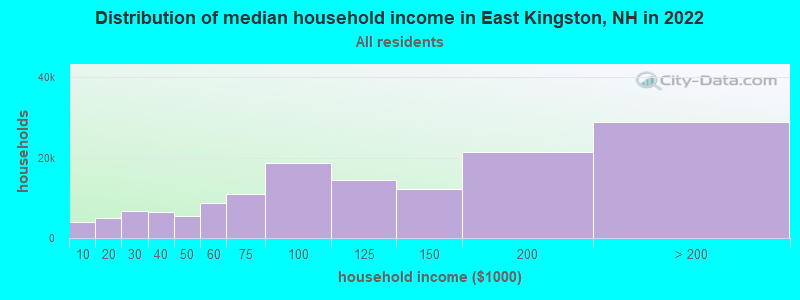
East Kingston, NH household income distribution

- 3,978Less than $10,000
- 4,893$10,000 to $19,999
- 6,822$20,000 to $29,999
- 6,417$30,000 to $39,999
- 5,463$40,000 to $49,999
- 8,784$50,000 to $59,999
- 11,008$60,000 to $74,999
- 18,546$75,000 to $99,999
- 14,322$100,000 to $124,999
- 12,175$125,000 to $149,999
- 21,435$150,000 to $199,999
- 28,872$200,000 or more
Percentage of workers working in this county: 62.2%
Number of people working at home: 231 (20.5% of all workers)
Travel time to work (commute)
- Less than 5 minutes: 25
- 5 to 9 minutes: 39
- 10 to 14 minutes: 97
- 15 to 19 minutes: 107
- 20 to 24 minutes: 121
- 25 to 29 minutes: 62
- 30 to 34 minutes: 113
- 35 to 39 minutes: 35
- 40 to 44 minutes: 43
- 45 to 59 minutes: 132
- 60 to 89 minutes: 95
- 90 or more minutes: 17
Means of transportation to work:
- Drove a car alone: 791 (82.3%)
- Carpooled: 68 (7.1%)
- Bus or trolley bus: 4 (0.4%)
- Railroad: 5 (0.5%)
- Motorcycle: 3 (0.3%)
- Walked: 13 (1.4%)
- Other means: 2 (0.2%)
- Worked at home: 75 (7.8%)


- Year of entry for the foreign-born population in East Kingston, New Hampshire
- 91995 to March 2000
- 111990 to 1994
- 131985 to 1989
- 11980 to 1984
- 31975 to 1979
- 41970 to 1974
- 21965 to 1969
- 19Before 1965

First ancestries reported:
- Irish: 451 (19.7%)
- English: 366 (16.0%)
- French: 206 (9.0%)
- United States: 200 (8.7%)
- French Canadian: 167 (7.3%)
- Italian: 148 (6.5%)
- German: 145 (6.3%)
- Other: 142 (6.2%)
- Scottish: 96 (4.2%)
- Polish: 93 (4.1%)
- Scotch-Irish: 39 (1.7%)
- Welsh: 35 (1.5%)
- Greek: 33 (1.4%)
- Portuguese: 32 (1.4%)
- Swedish: 32 (1.4%)
- Dutch: 24 (1.0%)
- Norwegian: 24 (1.0%)
- Swiss: 19 (0.8%)
- Russian: 11 (0.5%)
- Lithuanian: 9 (0.4%)
- Hungarian: 5 (0.2%)
- Arab: 3 (0.1%)
- Danish: 3 (0.1%)
- West Indian: 3 (0.1%)
- Czech: 2 (0.09%)
- Slovak: 2 (0.09%)
Most common places of birth for foreign-born residents (%):
| East Kingston: | 27.4% (17) |
| New Hampshire: | 22.9% (12,397) |
| East Kingston: | 16.1% (10) |
| New Hampshire: | 4.7% (2,530) |
| East Kingston: | 11.3% (7) |
| New Hampshire: | 2.9% (1,582) |
| East Kingston: | 8.1% (5) |
| New Hampshire: | 0.9% (508) |
| East Kingston: | 6.5% (4) |
| New Hampshire: | 4.9% (2,670) |
| East Kingston: | 6.5% (4) |
| New Hampshire: | 2.3% (1,261) |
| East Kingston: | 6.5% (4) |
| New Hampshire: | 0.3% (171) |
| East Kingston: | 4.8% (3) |
| New Hampshire: | 0.9% (511) |
| East Kingston: | 3.2% (2) |
| New Hampshire: | 8.1% (4,396) |
| East Kingston: | 3.2% (2) |
| New Hampshire: | 0.7% (401) |
| East Kingston: | 3.2% (2) |
| New Hampshire: | 1.7% (940) |
Place of birth for U.S.-born residents:
- This state: 503
- Other state: 1,214
- Northeast: 1,087
- Midwest: 52
- South: 50
- West: 25
67% of East Kingston residents lived in the same house 5 years ago.
Out of people who lived in different houses, 41% lived in this county.
Out of people who lived in different counties, 17% lived in New Hampshire.
Education attainment for males 25 years and older:
- No schooling: 0
- Nursery to 4th grade: 0
- 5th and 6th grade: 3
- 7th and 8th grade: 4
- 9th grade: 9
- 10th grade: 7
- 11th grade: 8
- 12th grade, no diploma: 16
- High school graduate (or equivalency): 177
- Less than 1 year of college: 38
- Some college more than 1 year, no degree: 58
- Associate degree: 62
- Bachelor's degree: 138
- Master's degree: 44
- Professional school degree: 16
- Doctorate degree: 11

Education attainment for females 25 years and older:
- No schooling: 2
- Nursery to 4th grade: 0
- 5th and 6th grade: 5
- 7th and 8th grade: 7
- 9th grade: 8
- 10th grade: 10
- 11th grade: 17
- 12th grade, no diploma: 10
- High school graduate (or equivalency): 186
- Less than 1 year of college: 34
- Some college more than 1 year, no degree: 93
- Associate degree: 74
- Bachelor's degree: 128
- Master's degree: 44
- Professional school degree: 8
- Doctorate degree: 6


Housing units in structures:
- One, detached: 565
- One, attached: 4
- Two: 11
- 20 to 49: 2
- 50 or more: 2
- Mobile homes: 64
Median worth of mobile homes: $310,573
Housing units lacking complete kitchen facilities: 0.5%

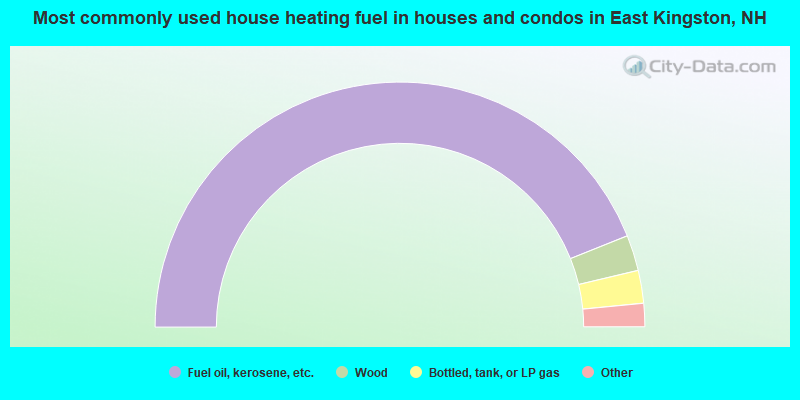
- 87.8%Fuel oil, kerosene, etc.
- 4.7%Wood
- 4.3%Bottled, tank, or LP gas
- 1.9%Electricity
- 1.2%Utility gas
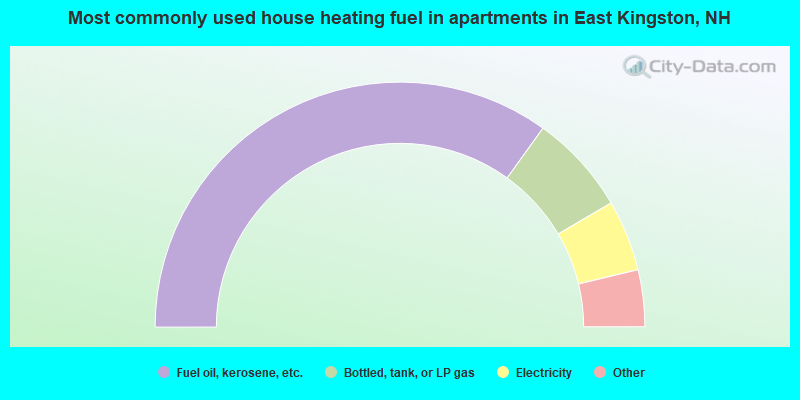
- 69.8%Fuel oil, kerosene, etc.
- 13.2%Bottled, tank, or LP gas
- 9.4%Electricity
- 3.8%Utility gas
- 3.8%Wood
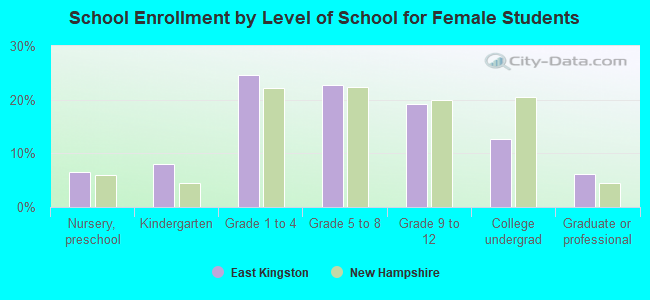
Private vs. public school enrollment:
| Here: | 4.9% |
| New Hampshire: | 8.9% |
| Here: | 4.7% |
| New Hampshire: | 10.7% |
| Here: | 47.6% |
| New Hampshire: | 36.4% |