East Lake-Orient Park, FL (Florida) Houses and Residents
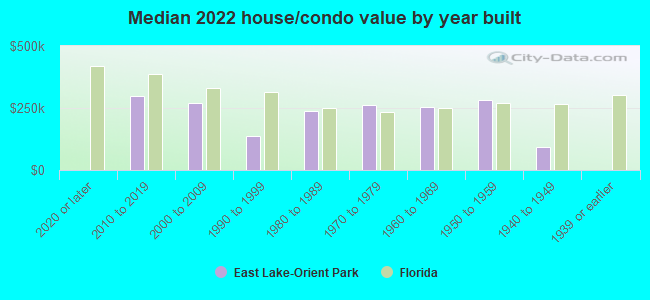
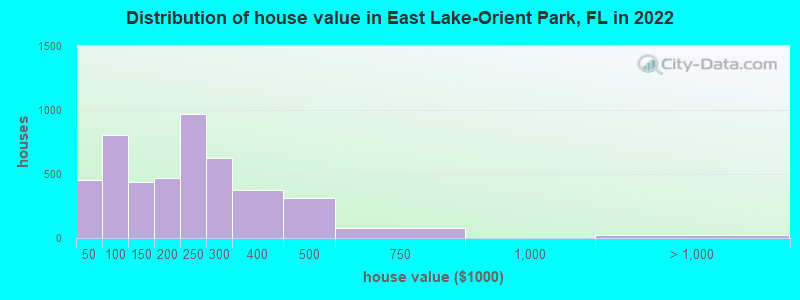
Estimated median house or condo value in 2022: $252,936 (it was $61,900 in 2000 )
East Lake-Orient Park:
$252,936Florida:
$354,100
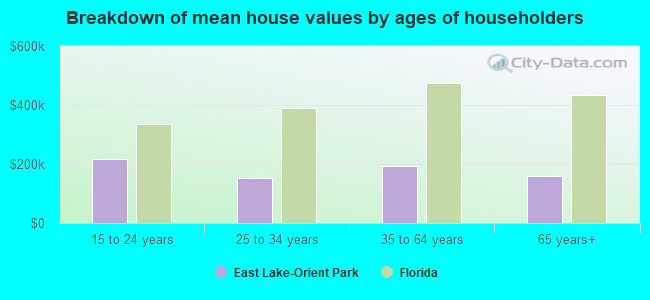
Lower value quartile - upper value quartile: $137,655 - $314,297Mean price in 2022: Detached houses: $285,103 Here:
$285,103State:
$500,941
Townhouses or other attached units: $215,502 Here:
$215,502State:
$370,869
In 3-to-4-unit structures: $204,626 Here:
$204,626State:
$309,944
In 5-or-more-unit structures: $125,243 Here:
$125,243State:
$447,145
Mobile homes: $80,268 Here:
$80,268State:
$113,202
Total population: 22,753 (Urban population: 5,560, Rural population: 0)
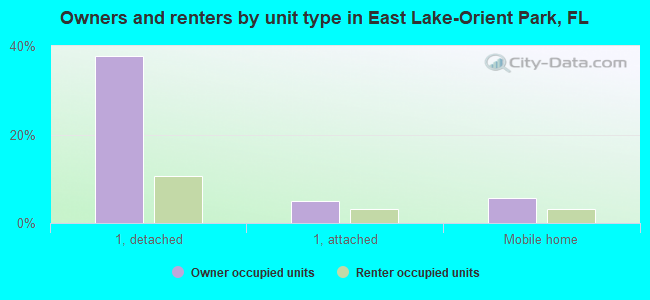
Houses: 12,230 (11,339 occupied: 5,676 owner occupied, 5,709 renter occupied )
% of renters here:
50%State:
33%
Housing density: 2,792 houses/condos per square mile
Median price asked for vacant for-sale houses and condos in 2022: $259,261.
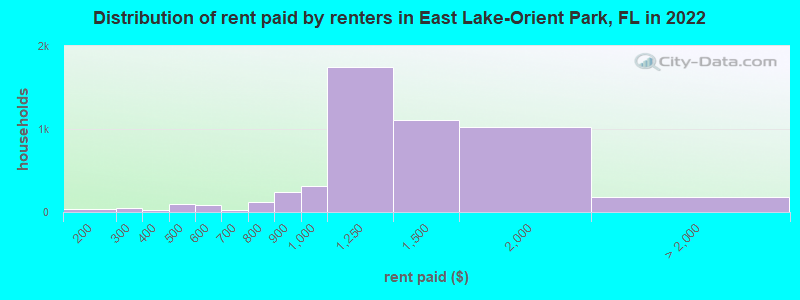
Median contract rent in 2022: $1,296 (lower quartile is $1,078, upper quartile is $1,566)
Median rent asked for vacant for-rent units in 2022: $1,672
Median gross rent in East Lake-Orient Park, FL in 2022: $1,472
Housing units in East Lake-Orient Park with a mortgage: 3,494 (283 second mortgage, 26 home equity loan, 138 both second mortgage and home equity loan )Houses without a mortgage: 98
Median household income for houses/condos with a mortgage: $68,890
Median household income for apartments without a mortgage: $52,734
Median monthly housing costs: $1,248
Data:
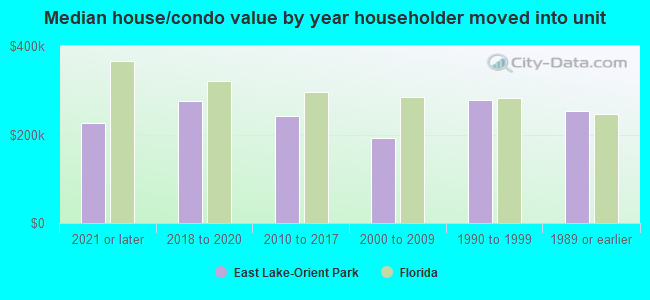
Median house or condo value ($)
Median house or condo value ($ change since 2000)
Median house or condo value ($) - White
Median house or condo value ($) - Black or African American
Median house or condo value ($) - Asian
Median house or condo value ($) - Hispanic or Latino
Median house or condo value ($) - American Indian and Alaska Native
Median house or condo value ($) - Multirace
Median house or condo value ($) - Other Race
Median price asked for mobile homes ($)
Household density (households per square mile)
Mean house or condo value by units in structure - 1, detached ($)
Mean house or condo value by units in structure - 1, attached ($)
Mean house or condo value by units in structure - 2 ($)
Mean house or condo value by units in structure by units in structure - 3 or 4 ($)
Mean house or condo value by units in structure - 5 or more ($)
Mean house or condo value by units in structure - Boat, RV, van, etc. ($)
Mean house or condo value by units in structure - Mobile home ($)
Median contract rent ($)
Median contract rent - Lower quartile ($)
Median contract rent - Upper quartile ($)
Median gross rent ($)
Urban houses (%)
Rural houses (%)
Houses occupied (%)
Houses occupied (% change since 2000)
Houses owner occupied (%)
Houses owner occupied (% change since 2000)
Houses renter occupied (%)
Houses renter occupied (% change since 2000)
Vacant housing units - For rent (%)
Vacant housing units - For rent (% change since 2000)
Vacant housing units - For sale only (%)
Vacant housing units - For sale only (% change since 2000)
Vacant housing units - Rented or sold, not occupied (%)
Vacant housing units - Rented or sold, not occupied (% change since 2000)
Vacant housing units - For seasonal, recreational, or occasional use (%)
Vacant housing units - For seasonal, recreational, or occasional use (% change since 2000)
Vacant housing units - For migrant workers (%)
Vacant housing units - For migrant workers (% change since 2000)
Vacant housing units - Other vacant (%)
Vacant housing units - Other vacant (% change since 2000)
Median monthly housing costs ($)
Median household income for houses/condos with a mortgage ($)
Median household income for houses/condos without a mortgage ($)
Median household income ($)
Median household income ($) - White
Median household income ($) - Black or African American
Median household income ($) - Asian
Median household income ($) - Hispanic or Latino
Median household income ($) - American Indian and Alaska Native
Median household income ($) - Multirace
Median household income ($) - Other Race
Mortgage status - with mortgage (%)
Mortgage status - with second mortgage (%)
Mortgage status - with home equity loan (%)
Mortgage status - with both second mortgage and home equity loan (%)
Mortgage status - without a mortgage (%)
Median year house/condo built
Median year apartment built
Household type by relationship - Male householder living alone (%)
Household type by relationship - Male householder not living alone (%)
Household type by relationship - Female householder living alone (%)
Household type by relationship - Female householder not living alone (%)
Household type by relationship - Opposite-Sex spouse (%)
Household type by relationship - Same-Sex spouse (%)
Household type by relationship - Opposite-Sex unmarried partner (%)
Household type by relationship - Same-Sex unmarried partner (%)
Household type by relationship - In group quarters (%)
Size of family households - 2-person household (%)
Size of family households - 3-person household (%)
Size of family households - 4-person household (%)
Size of family households - 5-person household (%)
Size of family households - 6-person household (%)
Size of family households - 7-or-more-person household (%)
Size of nonfamily households - 1-person household (%)
Size of nonfamily households - 2-person household (%)
Size of nonfamily households - 3-person household (%)
Size of nonfamily households - 4-person household (%)
Size of nonfamily households - 5-person household (%)
Size of nonfamily households - 6-person household (%)
Size of nonfamily households - 7-or-moreperson household (%)
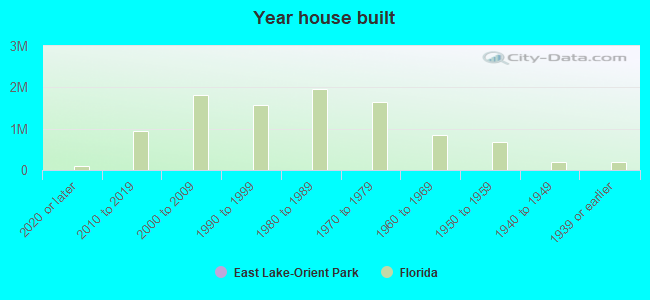
Year house built - Built 2010 or later (%)
Year house built - Built 2000 to 2009 (%)
Year house built - Built 1990 to 1999 (%)
Year house built - Built 1980 to 1989 (%)
Year house built - Built 1970 to 1979 (%)
Year house built - Built 1960 to 1969 (%)
Year house built - Built 1950 to 1959 (%)
Year house built - Built 1940 to 1949 (%)
Year house built - Built 1939 or earlier (%)
Median number of rooms in houses and condos
Median number of rooms in apartments
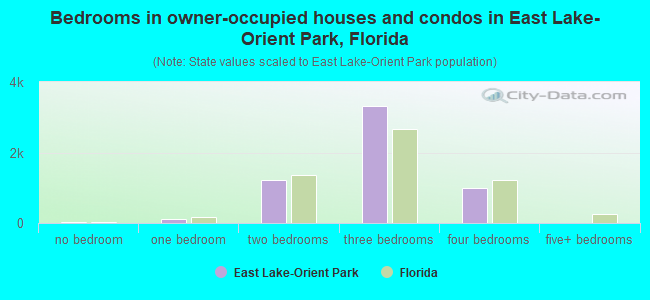
Median number of bedrooms in owner occupied houses
Mean number of bedrooms in owner occupied houses
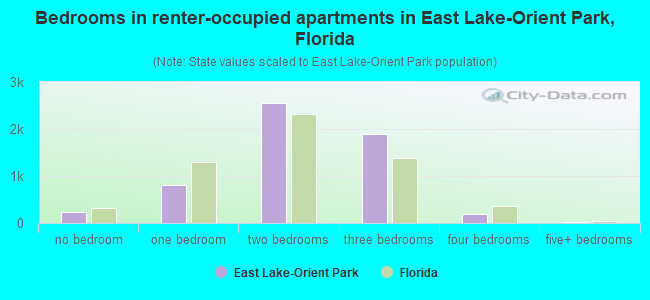
Median number of bedrooms in renter occupied houses
Mean number of bedrooms in renter occupied houses
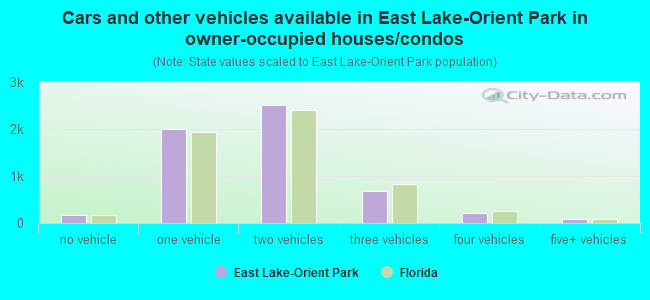
Median number of vehichles in owner occupied houses
Mean number of vehichles in owner occupied houses
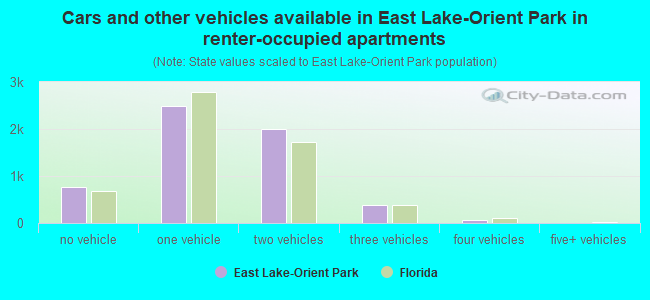
Median number of vehichles in renter occupied houses
Mean number of vehichles in renter occupied houses
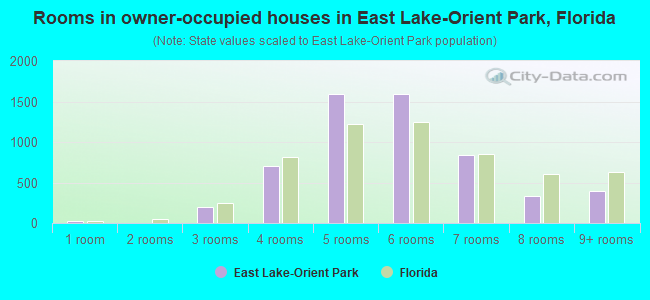
Rooms in owner-occupied houses - 1 room (%)
Rooms in owner-occupied houses - 2 rooms (%)
Rooms in owner-occupied houses - 3 rooms (%)
Rooms in owner-occupied houses - 4 rooms (%)
Rooms in owner-occupied houses - 5 rooms (%)
Rooms in owner-occupied houses - 6 rooms (%)
Rooms in owner-occupied houses - 7 rooms (%)
Rooms in owner-occupied houses - 8 rooms (%)
Rooms in owner-occupied houses - 9+ rooms (%)
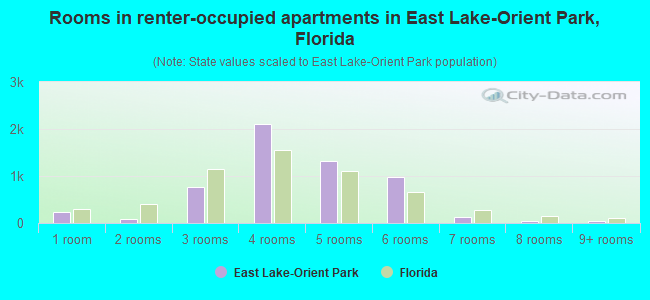
Rooms in renter-occupied houses - 1 room (%)
Rooms in renter-occupied houses - 2 rooms (%)
Rooms in renter-occupied houses - 3 rooms (%)
Rooms in renter-occupied houses - 4 rooms (%)
Rooms in renter-occupied houses - 5 rooms (%)
Rooms in renter-occupied houses - 6 rooms (%)
Rooms in renter-occupied houses - 7 rooms (%)
Rooms in renter-occupied houses - 8 rooms (%)
Rooms in renter-occupied houses - 9+ rooms (%)
Bedrooms in owner-occupied houses - no bedrooms (%)
Bedrooms in owner-occupied houses - 1 bedroom (%)
Bedrooms in owner-occupied houses - 2 bedrooms (%)
Bedrooms in owner-occupied houses - 3 bedrooms (%)
Bedrooms in owner-occupied houses - 4 bedrooms (%)
Bedrooms in owner-occupied houses - 5+ bedrooms (%)
Bedrooms in renter-occupied houses - no bedrooms (%)
Bedrooms in renter-occupied houses - 1 bedroom (%)
Bedrooms in renter-occupied houses - 2 bedrooms (%)
Bedrooms in renter-occupied houses - 3 bedrooms (%)
Bedrooms in renter-occupied houses - 4 bedrooms (%)
Bedrooms in renter-occupied houses - 5+ bedrooms (%)
Vehicles available in owner-occupied houses - no vehicle available (%)
Vehicles available in owner-occupied houses - 1 vehicle available(%)
Vehicles available in owner-occupied houses - 2 Vehicles available (%)
Vehicles available in owner-occupied houses - 3 Vehicles available (%)
Vehicles available in owner-occupied houses - 4 Vehicles available (%)
Vehicles available in owner-occupied houses - 5+ Vehicles available (%)
Vehicles available in renter-occupied houses - no vehicle available (%)
Vehicles available in renter-occupied houses - 1 vehicle available (%)
Vehicles available in renter-occupied houses - 2 Vehicles available (%)
Vehicles available in renter-occupied houses - 3 Vehicles available (%)
Vehicles available in renter-occupied houses - 4 Vehicles available (%)
Vehicles available in renter-occupied houses - 5+ Vehicles available (%)
Housing units in structures - 1, detached (%)
Housing units in structures - 1, attached (%)
Housing units in structures - 2 (%)
Housing units in structures - 3 or 4 (%)
Housing units in structures - 5 to 9 (%)
Housing units in structures - 10 to 19 (%)
Housing units in structures - 20 to 49 (%)
Housing units in structures - 50 or more (%)
Housing units in structures - Mobile home (%)
Housing units in structures - Boat, RV, van, etc. (%)
Housing units in structures - Owners - 1, detached (%)
Housing units in structures - Owners - 1, attached (%)
Housing units in structures - Owners - 2 (%)
Housing units in structures - Owners - 3 or 4 (%)
Housing units in structures - Owners - 5 to 9 (%)
Housing units in structures - Owners - 10 to 19 (%)
Housing units in structures - Owners - 20 to 49 (%)
Housing units in structures - Owners - 50 or more (%)
Housing units in structures - Owners - Mobile home (%)
Housing units in structures - Owners - Boat, RV, van, etc. (%)
Housing units in structures - Renters - 1, detached (%)
Housing units in structures - Renters - 1, attached (%)
Housing units in structures - Renters - 2 (%)
Housing units in structures - Renters - 3 or 4 (%)
Housing units in structures - Renters - 5 to 9 (%)
Housing units in structures - Renters - 10 to 19 (%)
Housing units in structures - Renters - 20 to 49 (%)
Housing units in structures - Renters - 50 or more (%)
Housing units in structures - Renters - Mobile home (%)
Housing units in structures - Renters - Boat, RV, van, etc. (%)
House/condo owner moved in on average (years ago)
Renter moved in on average (years ago)
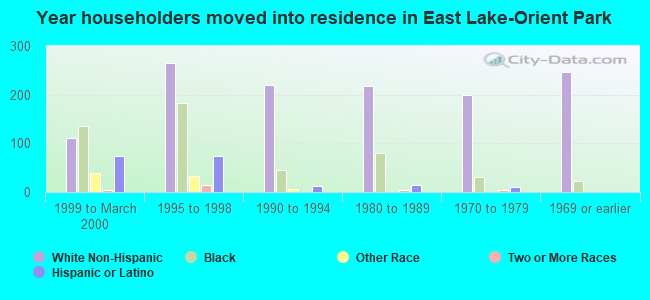
Year householder moved into unit - Moved in 1999 to March 2000 (%)
Year householder moved into unit - Moved in 1999 to March 2000 (%) - White
Year householder moved into unit - Moved in 1999 to March 2000 (%) - Black or African American
Year householder moved into unit - Moved in 1999 to March 2000 (%) - Asian
Year householder moved into unit - Moved in 1999 to March 2000 (%) - Hispanic or Latino
Year householder moved into unit - Moved in 1999 to March 2000 (%) - American Indian and Alaska Native
Year householder moved into unit - Moved in 1999 to March 2000 (%) - Multirace
Year householder moved into unit - Moved in 1999 to March 2000 (%) - Other Race
Year householder moved into unit - Moved in 1995 to 1998 (%)
Year householder moved into unit - Moved in 1995 to 1998 (%) - White
Year householder moved into unit - Moved in 1995 to 1998 (%) - Black or African American
Year householder moved into unit - Moved in 1995 to 1998 (%) - Asian
Year householder moved into unit - Moved in 1995 to 1998 (%) - Hispanic or Latino
Year householder moved into unit - Moved in 1995 to 1998 (%) - American Indian and Alaska Native
Year householder moved into unit - Moved in 1995 to 1998 (%) - Multirace
Year householder moved into unit - Moved in 1995 to 1998 (%) - Other Race
Year householder moved into unit - Moved in 1990 to 1994 (%)
Year householder moved into unit - Moved in 1990 to 1994 (%) - White
Year householder moved into unit - Moved in 1990 to 1994 (%) - Black or African American
Year householder moved into unit - Moved in 1990 to 1994 (%) - Asian
Year householder moved into unit - Moved in 1990 to 1994 (%) - Hispanic or Latino
Year householder moved into unit - Moved in 1990 to 1994 (%) - American Indian and Alaska Native
Year householder moved into unit - Moved in 1990 to 1994 (%) - Multirace
Year householder moved into unit - Moved in 1990 to 1994 (%) - Other Race
Year householder moved into unit - Moved in 1980 to 1989 (%)
Year householder moved into unit - Moved in 1980 to 1989 (%) - White
Year householder moved into unit - Moved in 1980 to 1989 (%) - Black or African American
Year householder moved into unit - Moved in 1980 to 1989 (%) - Asian
Year householder moved into unit - Moved in 1980 to 1989 (%) - Hispanic or Latino
Year householder moved into unit - Moved in 1980 to 1989 (%) - American Indian and Alaska Native
Year householder moved into unit - Moved in 1980 to 1989 (%) - Multirace
Year householder moved into unit - Moved in 1980 to 1989 (%) - Other Race
Year householder moved into unit - Moved in 1970 to 1979 (%)
Year householder moved into unit - Moved in 1970 to 1979 (%) - White
Year householder moved into unit - Moved in 1970 to 1979 (%) - Black or African American
Year householder moved into unit - Moved in 1970 to 1979 (%) - Asian
Year householder moved into unit - Moved in 1970 to 1979 (%) - Hispanic or Latino
Year householder moved into unit - Moved in 1970 to 1979 (%) - American Indian and Alaska Native
Year householder moved into unit - Moved in 1970 to 1979 (%) - Multirace
Year householder moved into unit - Moved in 1970 to 1979 (%) - Other Race
Year householder moved into unit - Moved in 1969 or earlier (%)
Year householder moved into unit - Moved in 1969 or earlier (%) - White
Year householder moved into unit - Moved in 1969 or earlier (%) - Black or African American
Year householder moved into unit - Moved in 1969 or earlier (%) - Asian
Year householder moved into unit - Moved in 1969 or earlier (%) - Hispanic or Latino
Year householder moved into unit - Moved in 1969 or earlier (%) - American Indian and Alaska Native
Year householder moved into unit - Moved in 1969 or earlier (%) - Multirace
Year householder moved into unit - Moved in 1969 or earlier (%) - Other Race
Housing units lacking complete plumbing facilities (%)
Housing units lacking complete kitchen facilities (%)
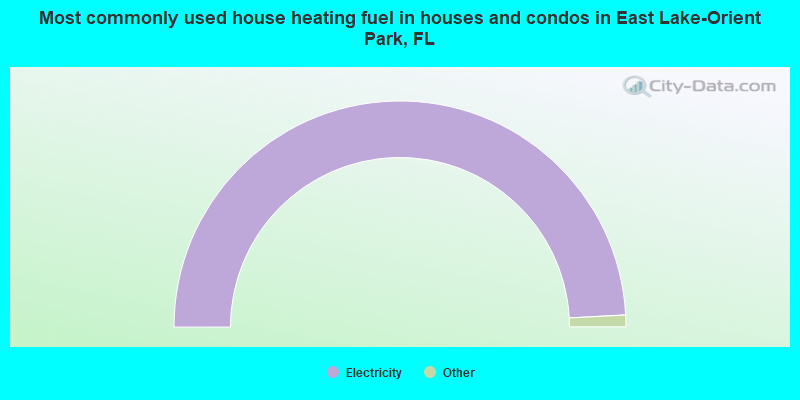
House heating fuel used in houses and condos - Utility gas (%)
House heating fuel used in houses and condos - Bottled, tank, or LP gas (%)
House heating fuel used in houses and condos - Electricity (%)
House heating fuel used in houses and condos - Fuel oil, kerosene, etc. (%)
House heating fuel used in houses and condos - Coal or coke (%)
House heating fuel used in houses and condos - Wood (%)
House heating fuel used in houses and condos - Solar energy (%)
House heating fuel used in houses and condos - Other fuel (%)
House heating fuel used in houses and condos - No fuel used (%)
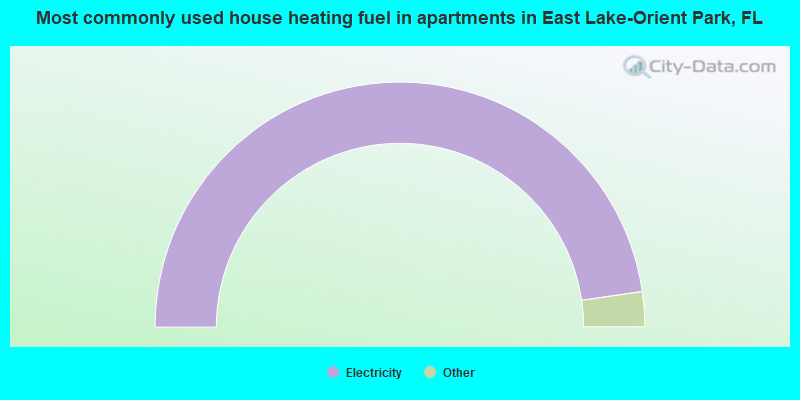
House heating fuel used in apartments - Utility gas (%)
House heating fuel used in apartments - Bottled, tank, or LP gas (%)
House heating fuel used in apartments - Electricity (%)
House heating fuel used in apartments - Fuel oil, kerosene, etc. (%)
House heating fuel used in apartments - Coal or coke (%)
House heating fuel used in apartments - Wood (%)
House heating fuel used in apartments - Solar energy (%)
House heating fuel used in apartments - Other fuel (%)
House heating fuel used in apartments - No fuel used (%)
Median year house/condo built: 1974Median year apartment built: 1987Household type by relationship:
Households: 30,133
Male householders: 4,639 (1,371 living alone ), Female householders: 6,634 (1,954 living alone )3,129 spouses (3,082 opposite-sex spouses ), 786 unmarried partners , (711 opposite-sex unmarried partners ), 9,691 children (8,854 natural , 303 adopted , 532 stepchildren ), 535 grandchildren , 713 brothers or sisters , 646 parents , 130 foster children , 1,605 other relatives , 1,534 non-relatives In group quarters: 87
Size of family households: 2,285 2-persons , 2,260 3-persons , 1,229 4-persons , 579 5-persons , 254 6-persons , 246 7-or-more-persons .
Size of nonfamily households: 3,199 1-person , 1,077 2-persons , 239 3-persons .
2,702 married couples with children. single-parent households (349 men , 2,933 women ).
72.1% of residents of East Lake-Orient Park speak English at home. of residents speak Spanish at home (66% speak English very well , 11% speak English well , 12% speak English not well , 10% don't speak English at all ).of residents speak other Indo-European language at home (38% speak English very well , 41% speak English well , 22% speak English not well ).of residents speak Asian or Pacific Island language at home (60% speak English very well , 23% speak English well , 16% speak English not well , 1% don't speak English at all ).of residents speak other language at home (87% speak English very well , 11% speak English well , 2% speak English not well ).
Foreign born population: 5,883 (19.5%)of them are naturalized citizens )
Median number of rooms in houses and condos:
Median number of rooms in apartments
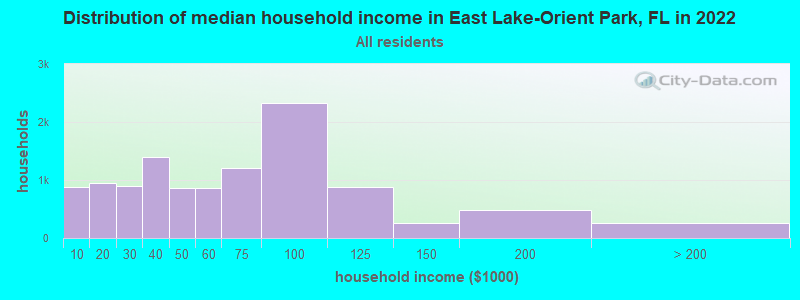
East Lake-Orient Park, FL household income distribution 883 Less than $10,000951 $10,000 to $19,999905 $20,000 to $29,9991,403 $30,000 to $39,999868 $40,000 to $49,999864 $50,000 to $59,9991,212 $60,000 to $74,9992,334 $75,000 to $99,999883 $100,000 to $124,999260 $125,000 to $149,999475 $150,000 to $199,999261 $200,000 or more
Home value of owner - occupied houses in 2022 in East Lake-Orient Park, FL 18 Less than $10,00024 $10,000 to $14,99962 $15,000 to $19,9995 $20,000 to $24,99963 $25,000 to $29,999164 $30,000 to $34,9998 $35,000 to $39,999103 $40,000 to $49,99933 $50,000 to $59,99935 $60,000 to $69,999268 $70,000 to $79,999230 $80,000 to $89,999132 $90,000 to $99,999216 $100,000 to $124,999221 $125,000 to $149,999206 $150,000 to $174,999265 $175,000 to $199,999966 $200,000 to $249,999625 $250,000 to $299,999372 $300,000 to $399,999308 $400,000 to $499,99978 $500,000 to $749,99926 $2,000,000 or moreRent paid by renters in 2022 in East Lake-Orient Park, FL 37 $100 to $14943 $200 to $24930 $300 to $34952 $400 to $44947 $450 to $4999 $500 to $54979 $550 to $5995 $600 to $64921 $650 to $69950 $700 to $74965 $750 to $799237 $800 to $899307 $900 to $9991,746 $1,000 to $1,2491,113 $1,250 to $1,4991,024 $1,500 to $1,999122 $2,000 to $2,49957 No cash rent
Percentage of workers working in this county: 88.4%Number of people working at home: 2,662 (17.5% of all workers )
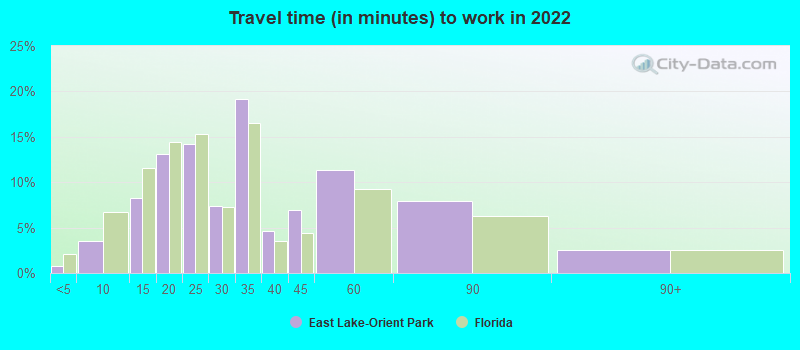
Travel time to work (commute)
Less than 5 minutes: 2795 to 9 minutes: 95010 to 14 minutes: 1,61115 to 19 minutes: 2,27420 to 24 minutes: 1,81125 to 29 minutes: 51030 to 34 minutes: 1,83035 to 39 minutes: 66940 to 44 minutes: 81145 to 59 minutes: 66960 to 89 minutes: 78590 or more minutes: 224
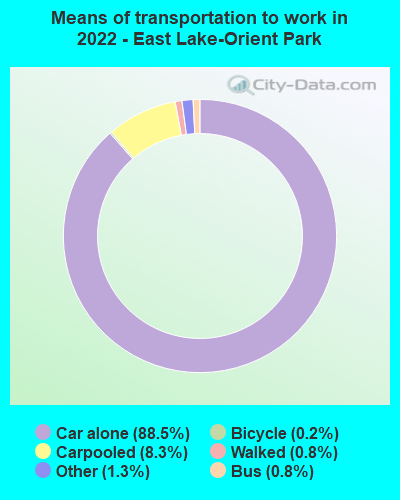
Means of transportation to work:
Drove a car alone: 27,216 (77.3%)Carpooled: 2,914 (8.3%)Bus : 181 (0.5%)Taxi: 478 (1.4%)Bicycle: 85 (0.2%)Walked: 219 (0.6%)Worked at home: 2,662 (7.6%)
Unemployment by race in 2022
Unemployment rate for White non-Hispanic residents 1.7% Males4.7% FemalesUnemployment rate for Black residents 7.5% Males7.3% FemalesUnemployment rate for American Indian and Alaska Native residents 100.0% FemalesUnemployment rate for other race residents 2.8% MalesUnemployment rate for two or more race residents 14.0% Males3.6% FemalesUnemployment rate for Hispanic or Latino residents 10.2% Males5.2% Females
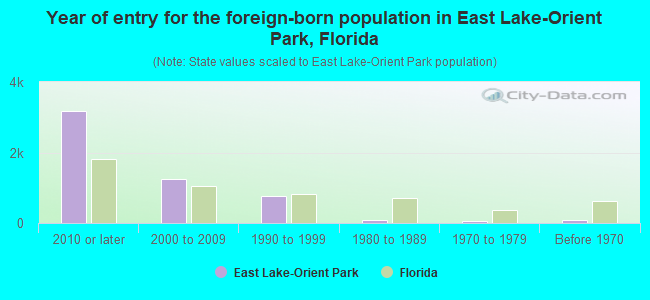
Year of entry for the foreign-born population in East Lake-Orient Park, Florida
3,173 2010 or later 1,245 2000 to 2009 775 1990 to 1999 76 1980 to 1989 48 1970 to 1979 87 Before 1970
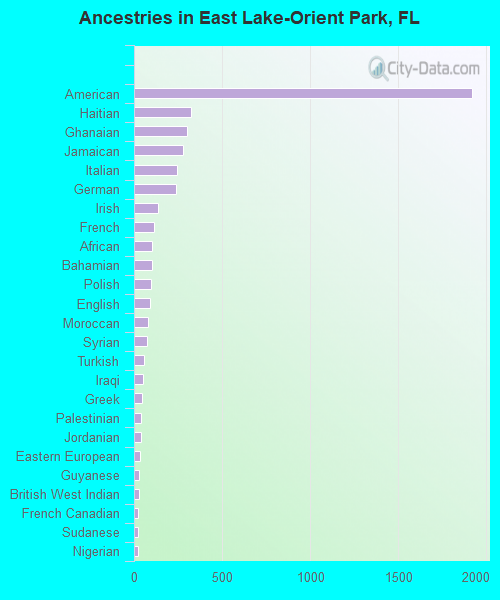
First ancestries reported:
American: 1,920 (9.2%)
Haitian: 326 (1.6%)
Ghanaian: 299 (1.4%)
Jamaican: 279 (1.3%)
Italian: 247 (1.2%)
German: 238 (1.1%)
Irish: 139 (0.7%)
French: 114 (0.5%)
African: 102 (0.5%)
Bahamian: 100 (0.5%)
Polish: 95 (0.5%)
English: 93 (0.4%)
Moroccan: 82 (0.4%)
Syrian: 73 (0.3%)
Turkish: 54 (0.3%)
Iraqi: 50 (0.2%)
Greek: 45 (0.2%)
Palestinian: 42 (0.2%)
Jordanian: 39 (0.2%)
Eastern European: 35 (0.2%)
Guyanese: 27 (0.1%)
British West Indian: 26 (0.1%)
French Canadian: 24 (0.1%)
Sudanese: 24 (0.1%)
Nigerian: 21 (0.1%)
Albanian: 14 (0.07%)
Scottish: 13 (0.06%)
Danish: 13 (0.06%)
Norwegian: 11 (0.05%)
Pennsylvania German: 11 (0.05%)
Celtic: 11 (0.05%)
Czechoslovakian: 10 (0.05%)
Scotch-Irish: 9 (0.04%)
Lithuanian: 8 (0.04%)
Dutch: 8 (0.04%)
Canadian: 6 (0.03%)
European: 3 (0.01%) Most common places of birth for foreign-born residents (%): Cuba East Lake-Orient Park:
19.7% (1,110)Florida:
22.0% (1,006,576)
India East Lake-Orient Park:
15.7% (886)Florida:
2.1% (94,349)
Haiti East Lake-Orient Park:
9.1% (513)Florida:
7.5% (342,375)
Philippines East Lake-Orient Park:
8.6% (483)Florida:
1.8% (84,403)
Bangladesh East Lake-Orient Park:
5.6% (315)Florida:
0.3% (13,053)
Dominican Republic East Lake-Orient Park:
4.1% (234)Florida:
3.0% (137,727)
Vietnam East Lake-Orient Park:
4.0% (227)Florida:
1.3% (60,604)
Guatemala East Lake-Orient Park:
4.0% (227)Florida:
2.1% (97,632)
Colombia East Lake-Orient Park:
3.2% (178)Florida:
6.5% (298,669)
Venezuela East Lake-Orient Park:
2.6% (148)Florida:
5.7% (262,042)
Jamaica East Lake-Orient Park:
2.6% (145)Florida:
5.0% (227,319)
Bahamas East Lake-Orient Park:
2.4% (133)Florida:
0.4% (17,749)
Ghana East Lake-Orient Park:
2.1% (121)Florida:
0.1% (2,904)
Place of birth for U.S.-born residents:
This state: 15,786Other state: 7,019Northeast: 2,553Midwest: 1,090South: 2,649West: 774 80.1% of East Lake-Orient Park residents lived in the same house 1 years ago.
Out of people who lived in different houses, 42.3% lived in this county.
Out of people who lived in different counties, 67.4% lived in Florida.
East Lake-Orient Park:
80.1%State average:
86.3%
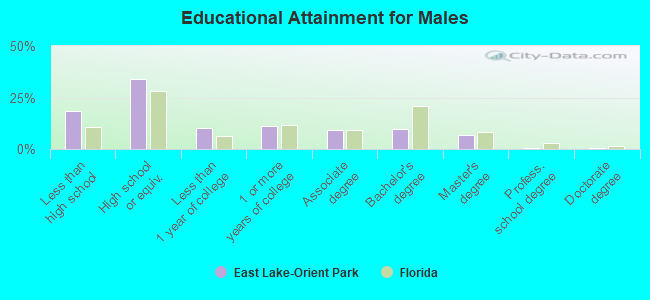
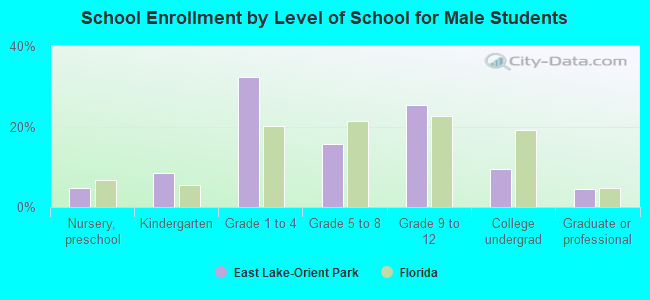
Education attainment for males 25 years and older:
No schooling: 197Nursery to 4th grade: 215th and 6th grade: 107th and 8th grade: 479th grade: 31710th grade: 34511th grade: 23512th grade, no diploma: 529High school graduate (or equivalency): 3,143Less than 1 year of college: 950Some college more than 1 year, no degree: 1,044Associate degree: 832Bachelor's degree: 878Master's degree: 618Professional school degree: 29Doctorate degree: 27
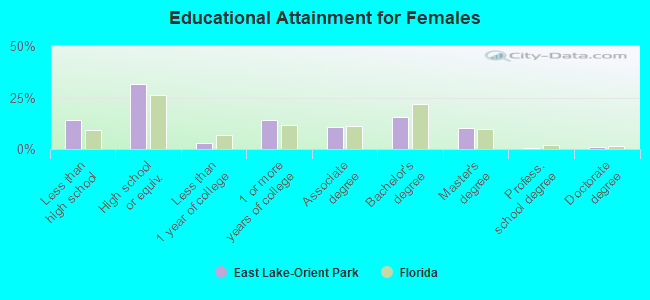
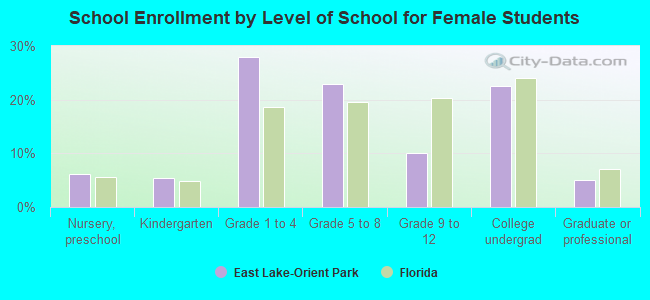
Education attainment for females 25 years and older:
No schooling: 166Nursery to 4th grade: 05th and 6th grade: 637th and 8th grade: 1189th grade: 10510th grade: 51611th grade: 26012th grade, no diploma: 194High school graduate (or equivalency): 3,243Less than 1 year of college: 291Some college more than 1 year, no degree: 1,444Associate degree: 1,078Bachelor's degree: 1,602Master's degree: 1,031Professional school degree: 43Doctorate degree: 98
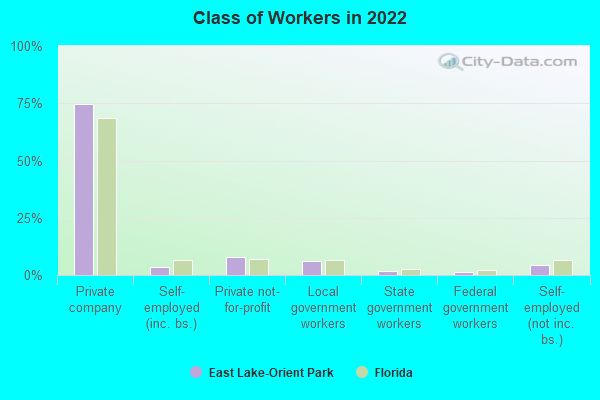
Housing units in structures:
One, detached: 6,069One, attached: 897Two: 1463 or 4: 9955 to 9: 69010 to 19: 78620 to 49: 87450 or more: 673Mobile homes: 1,090Boats, RVs, vans, etc.: 6Median worth of mobile homes: $86,532
Housing units lacking complete plumbing facilities in 2022: 1.2%Housing units lacking complete kitchen facilities in 2022: 2.2%House/condo owner moved in on average 14 years ago
Renter moved in on average 4 years ago
Private vs. public school enrollment:
Students in private schools in grades 1 to 8 (elementary and middle school): 740 Students in private schools in grades 9 to 12 (high school): 66 Students in private undergraduate colleges: 122