East Los Angeles, CA (California) Houses and Residents
Estimated median house or condo value in 2022: $650,200 (it was $157,000 in 2000 )
East Los Angeles:
$650,200California:
$715,900
Lower value quartile - upper value quartile: $535,300 - $789,100Mean price in 2022: Detached houses: $614,745 Here:
$614,745State:
$988,808
Townhouses or other attached units: $618,923 Here:
$618,923State:
$838,546
In 2-unit structures: $464,946 Here:
$464,946State:
$1,138,100
In 3-to-4-unit structures: $607,031 Here:
$607,031State:
$824,253
In 5-or-more-unit structures: $615,372 Here:
$615,372State:
$730,996
Mobile homes: $441,856 Here:
$441,856State:
$184,506
Occupied boats, RVs, vans, etc.: $313,747 Here:
$313,747State:
$204,957
Total population: 126,496 (Urban population: 124,366, Rural population: 0)
Houses: 32,620 (30,861 occupied: 10,534 owner occupied, 20,327 renter occupied )
% of renters here:
66%State:
44%
Housing density: 4,383 houses/condos per square mile
Median price asked for vacant for-sale houses and condos in 2022: $741,536.
Median contract rent in 2022: $1,245 (lower quartile is $953, upper quartile is $1,647)
Median rent asked for vacant for-rent units in 2022: $1,155
Median gross rent in East Los Angeles, CA in 2022: $1,393
Housing units in East Los Angeles with a mortgage: 6,679 (511 second mortgage, 118 home equity loan, 214 both second mortgage and home equity loan )Houses without a mortgage: 108
Median household income for houses/condos with a mortgage: $97,438
Median household income for apartments without a mortgage: $70,255
Median monthly housing costs: $1,413
Data:
Median house or condo value ($)
Median house or condo value ($ change since 2000)
Median house or condo value ($) - White
Median house or condo value ($) - Black or African American
Median house or condo value ($) - Asian
Median house or condo value ($) - Hispanic or Latino
Median house or condo value ($) - American Indian and Alaska Native
Median house or condo value ($) - Multirace
Median house or condo value ($) - Other Race
Median price asked for mobile homes ($)
Household density (households per square mile)
Mean house or condo value by units in structure - 1, detached ($)
Mean house or condo value by units in structure - 1, attached ($)
Mean house or condo value by units in structure - 2 ($)
Mean house or condo value by units in structure by units in structure - 3 or 4 ($)
Mean house or condo value by units in structure - 5 or more ($)
Mean house or condo value by units in structure - Boat, RV, van, etc. ($)
Mean house or condo value by units in structure - Mobile home ($)
Median contract rent ($)
Median contract rent - Lower quartile ($)
Median contract rent - Upper quartile ($)
Median gross rent ($)
Urban houses (%)
Rural houses (%)
Houses occupied (%)
Houses occupied (% change since 2000)
Houses owner occupied (%)
Houses owner occupied (% change since 2000)
Houses renter occupied (%)
Houses renter occupied (% change since 2000)
Vacant housing units - For rent (%)
Vacant housing units - For rent (% change since 2000)
Vacant housing units - For sale only (%)
Vacant housing units - For sale only (% change since 2000)
Vacant housing units - Rented or sold, not occupied (%)
Vacant housing units - Rented or sold, not occupied (% change since 2000)
Vacant housing units - For seasonal, recreational, or occasional use (%)
Vacant housing units - For seasonal, recreational, or occasional use (% change since 2000)
Vacant housing units - For migrant workers (%)
Vacant housing units - For migrant workers (% change since 2000)
Vacant housing units - Other vacant (%)
Vacant housing units - Other vacant (% change since 2000)
Median monthly housing costs ($)
Median household income for houses/condos with a mortgage ($)
Median household income for houses/condos without a mortgage ($)
Median household income ($)
Median household income ($) - White
Median household income ($) - Black or African American
Median household income ($) - Asian
Median household income ($) - Hispanic or Latino
Median household income ($) - American Indian and Alaska Native
Median household income ($) - Multirace
Median household income ($) - Other Race
Mortgage status - with mortgage (%)
Mortgage status - with second mortgage (%)
Mortgage status - with home equity loan (%)
Mortgage status - with both second mortgage and home equity loan (%)
Mortgage status - without a mortgage (%)
Median year house/condo built
Median year apartment built
Household type by relationship - Male householder living alone (%)
Household type by relationship - Male householder not living alone (%)
Household type by relationship - Female householder living alone (%)
Household type by relationship - Female householder not living alone (%)
Household type by relationship - Opposite-Sex spouse (%)
Household type by relationship - Same-Sex spouse (%)
Household type by relationship - Opposite-Sex unmarried partner (%)
Household type by relationship - Same-Sex unmarried partner (%)
Household type by relationship - In group quarters (%)
Size of family households - 2-person household (%)
Size of family households - 3-person household (%)
Size of family households - 4-person household (%)
Size of family households - 5-person household (%)
Size of family households - 6-person household (%)
Size of family households - 7-or-more-person household (%)
Size of nonfamily households - 1-person household (%)
Size of nonfamily households - 2-person household (%)
Size of nonfamily households - 3-person household (%)
Size of nonfamily households - 4-person household (%)
Size of nonfamily households - 5-person household (%)
Size of nonfamily households - 6-person household (%)
Size of nonfamily households - 7-or-moreperson household (%)
Year house built - Built 2010 or later (%)
Year house built - Built 2000 to 2009 (%)
Year house built - Built 1990 to 1999 (%)
Year house built - Built 1980 to 1989 (%)
Year house built - Built 1970 to 1979 (%)
Year house built - Built 1960 to 1969 (%)
Year house built - Built 1950 to 1959 (%)
Year house built - Built 1940 to 1949 (%)
Year house built - Built 1939 or earlier (%)
Median number of rooms in houses and condos
Median number of rooms in apartments
Median number of bedrooms in owner occupied houses
Mean number of bedrooms in owner occupied houses
Median number of bedrooms in renter occupied houses
Mean number of bedrooms in renter occupied houses
Median number of vehichles in owner occupied houses
Mean number of vehichles in owner occupied houses
Median number of vehichles in renter occupied houses
Mean number of vehichles in renter occupied houses
Rooms in owner-occupied houses - 1 room (%)
Rooms in owner-occupied houses - 2 rooms (%)
Rooms in owner-occupied houses - 3 rooms (%)
Rooms in owner-occupied houses - 4 rooms (%)
Rooms in owner-occupied houses - 5 rooms (%)
Rooms in owner-occupied houses - 6 rooms (%)
Rooms in owner-occupied houses - 7 rooms (%)
Rooms in owner-occupied houses - 8 rooms (%)
Rooms in owner-occupied houses - 9+ rooms (%)
Rooms in renter-occupied houses - 1 room (%)
Rooms in renter-occupied houses - 2 rooms (%)
Rooms in renter-occupied houses - 3 rooms (%)
Rooms in renter-occupied houses - 4 rooms (%)
Rooms in renter-occupied houses - 5 rooms (%)
Rooms in renter-occupied houses - 6 rooms (%)
Rooms in renter-occupied houses - 7 rooms (%)
Rooms in renter-occupied houses - 8 rooms (%)
Rooms in renter-occupied houses - 9+ rooms (%)
Bedrooms in owner-occupied houses - no bedrooms (%)
Bedrooms in owner-occupied houses - 1 bedroom (%)
Bedrooms in owner-occupied houses - 2 bedrooms (%)
Bedrooms in owner-occupied houses - 3 bedrooms (%)
Bedrooms in owner-occupied houses - 4 bedrooms (%)
Bedrooms in owner-occupied houses - 5+ bedrooms (%)
Bedrooms in renter-occupied houses - no bedrooms (%)
Bedrooms in renter-occupied houses - 1 bedroom (%)
Bedrooms in renter-occupied houses - 2 bedrooms (%)
Bedrooms in renter-occupied houses - 3 bedrooms (%)
Bedrooms in renter-occupied houses - 4 bedrooms (%)
Bedrooms in renter-occupied houses - 5+ bedrooms (%)
Vehicles available in owner-occupied houses - no vehicle available (%)
Vehicles available in owner-occupied houses - 1 vehicle available(%)
Vehicles available in owner-occupied houses - 2 Vehicles available (%)
Vehicles available in owner-occupied houses - 3 Vehicles available (%)
Vehicles available in owner-occupied houses - 4 Vehicles available (%)
Vehicles available in owner-occupied houses - 5+ Vehicles available (%)
Vehicles available in renter-occupied houses - no vehicle available (%)
Vehicles available in renter-occupied houses - 1 vehicle available (%)
Vehicles available in renter-occupied houses - 2 Vehicles available (%)
Vehicles available in renter-occupied houses - 3 Vehicles available (%)
Vehicles available in renter-occupied houses - 4 Vehicles available (%)
Vehicles available in renter-occupied houses - 5+ Vehicles available (%)
Housing units in structures - 1, detached (%)
Housing units in structures - 1, attached (%)
Housing units in structures - 2 (%)
Housing units in structures - 3 or 4 (%)
Housing units in structures - 5 to 9 (%)
Housing units in structures - 10 to 19 (%)
Housing units in structures - 20 to 49 (%)
Housing units in structures - 50 or more (%)
Housing units in structures - Mobile home (%)
Housing units in structures - Boat, RV, van, etc. (%)
Housing units in structures - Owners - 1, detached (%)
Housing units in structures - Owners - 1, attached (%)
Housing units in structures - Owners - 2 (%)
Housing units in structures - Owners - 3 or 4 (%)
Housing units in structures - Owners - 5 to 9 (%)
Housing units in structures - Owners - 10 to 19 (%)
Housing units in structures - Owners - 20 to 49 (%)
Housing units in structures - Owners - 50 or more (%)
Housing units in structures - Owners - Mobile home (%)
Housing units in structures - Owners - Boat, RV, van, etc. (%)
Housing units in structures - Renters - 1, detached (%)
Housing units in structures - Renters - 1, attached (%)
Housing units in structures - Renters - 2 (%)
Housing units in structures - Renters - 3 or 4 (%)
Housing units in structures - Renters - 5 to 9 (%)
Housing units in structures - Renters - 10 to 19 (%)
Housing units in structures - Renters - 20 to 49 (%)
Housing units in structures - Renters - 50 or more (%)
Housing units in structures - Renters - Mobile home (%)
Housing units in structures - Renters - Boat, RV, van, etc. (%)
House/condo owner moved in on average (years ago)
Renter moved in on average (years ago)
Year householder moved into unit - Moved in 1999 to March 2000 (%)
Year householder moved into unit - Moved in 1999 to March 2000 (%) - White
Year householder moved into unit - Moved in 1999 to March 2000 (%) - Black or African American
Year householder moved into unit - Moved in 1999 to March 2000 (%) - Asian
Year householder moved into unit - Moved in 1999 to March 2000 (%) - Hispanic or Latino
Year householder moved into unit - Moved in 1999 to March 2000 (%) - American Indian and Alaska Native
Year householder moved into unit - Moved in 1999 to March 2000 (%) - Multirace
Year householder moved into unit - Moved in 1999 to March 2000 (%) - Other Race
Year householder moved into unit - Moved in 1995 to 1998 (%)
Year householder moved into unit - Moved in 1995 to 1998 (%) - White
Year householder moved into unit - Moved in 1995 to 1998 (%) - Black or African American
Year householder moved into unit - Moved in 1995 to 1998 (%) - Asian
Year householder moved into unit - Moved in 1995 to 1998 (%) - Hispanic or Latino
Year householder moved into unit - Moved in 1995 to 1998 (%) - American Indian and Alaska Native
Year householder moved into unit - Moved in 1995 to 1998 (%) - Multirace
Year householder moved into unit - Moved in 1995 to 1998 (%) - Other Race
Year householder moved into unit - Moved in 1990 to 1994 (%)
Year householder moved into unit - Moved in 1990 to 1994 (%) - White
Year householder moved into unit - Moved in 1990 to 1994 (%) - Black or African American
Year householder moved into unit - Moved in 1990 to 1994 (%) - Asian
Year householder moved into unit - Moved in 1990 to 1994 (%) - Hispanic or Latino
Year householder moved into unit - Moved in 1990 to 1994 (%) - American Indian and Alaska Native
Year householder moved into unit - Moved in 1990 to 1994 (%) - Multirace
Year householder moved into unit - Moved in 1990 to 1994 (%) - Other Race
Year householder moved into unit - Moved in 1980 to 1989 (%)
Year householder moved into unit - Moved in 1980 to 1989 (%) - White
Year householder moved into unit - Moved in 1980 to 1989 (%) - Black or African American
Year householder moved into unit - Moved in 1980 to 1989 (%) - Asian
Year householder moved into unit - Moved in 1980 to 1989 (%) - Hispanic or Latino
Year householder moved into unit - Moved in 1980 to 1989 (%) - American Indian and Alaska Native
Year householder moved into unit - Moved in 1980 to 1989 (%) - Multirace
Year householder moved into unit - Moved in 1980 to 1989 (%) - Other Race
Year householder moved into unit - Moved in 1970 to 1979 (%)
Year householder moved into unit - Moved in 1970 to 1979 (%) - White
Year householder moved into unit - Moved in 1970 to 1979 (%) - Black or African American
Year householder moved into unit - Moved in 1970 to 1979 (%) - Asian
Year householder moved into unit - Moved in 1970 to 1979 (%) - Hispanic or Latino
Year householder moved into unit - Moved in 1970 to 1979 (%) - American Indian and Alaska Native
Year householder moved into unit - Moved in 1970 to 1979 (%) - Multirace
Year householder moved into unit - Moved in 1970 to 1979 (%) - Other Race
Year householder moved into unit - Moved in 1969 or earlier (%)
Year householder moved into unit - Moved in 1969 or earlier (%) - White
Year householder moved into unit - Moved in 1969 or earlier (%) - Black or African American
Year householder moved into unit - Moved in 1969 or earlier (%) - Asian
Year householder moved into unit - Moved in 1969 or earlier (%) - Hispanic or Latino
Year householder moved into unit - Moved in 1969 or earlier (%) - American Indian and Alaska Native
Year householder moved into unit - Moved in 1969 or earlier (%) - Multirace
Year householder moved into unit - Moved in 1969 or earlier (%) - Other Race
Housing units lacking complete plumbing facilities (%)
Housing units lacking complete kitchen facilities (%)
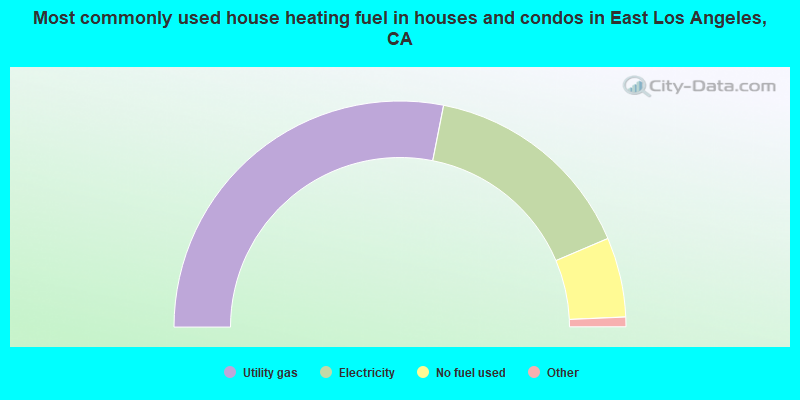
House heating fuel used in houses and condos - Utility gas (%)
House heating fuel used in houses and condos - Bottled, tank, or LP gas (%)
House heating fuel used in houses and condos - Electricity (%)
House heating fuel used in houses and condos - Fuel oil, kerosene, etc. (%)
House heating fuel used in houses and condos - Coal or coke (%)
House heating fuel used in houses and condos - Wood (%)
House heating fuel used in houses and condos - Solar energy (%)
House heating fuel used in houses and condos - Other fuel (%)
House heating fuel used in houses and condos - No fuel used (%)
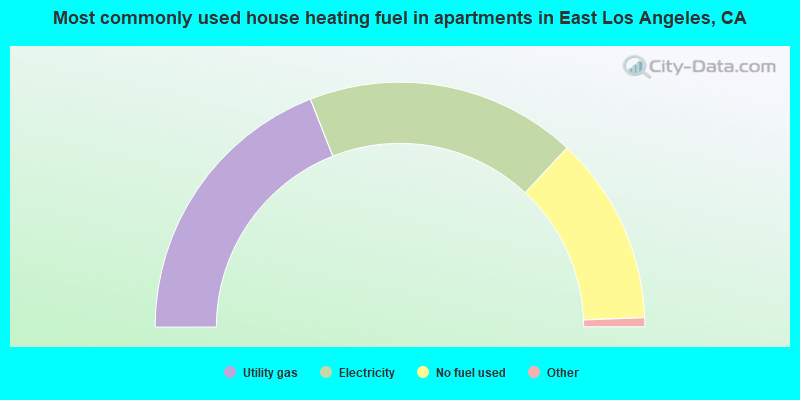
House heating fuel used in apartments - Utility gas (%)
House heating fuel used in apartments - Bottled, tank, or LP gas (%)
House heating fuel used in apartments - Electricity (%)
House heating fuel used in apartments - Fuel oil, kerosene, etc. (%)
House heating fuel used in apartments - Coal or coke (%)
House heating fuel used in apartments - Wood (%)
House heating fuel used in apartments - Solar energy (%)
House heating fuel used in apartments - Other fuel (%)
House heating fuel used in apartments - No fuel used (%)
Median year house/condo built: 1944Median year apartment built: 1952Household type by relationship:
Households: 112,965
Male householders: 16,833 (1,490 living alone ), Female householders: 14,028 (2,098 living alone )13,430 spouses (13,352 opposite-sex spouses ), 3,537 unmarried partners , (3,389 opposite-sex unmarried partners ), 41,283 children (39,839 natural , 127 adopted , 1,317 stepchildren ), 5,723 grandchildren , 3,339 brothers or sisters , 4,184 parents , 0 foster children , 5,746 other relatives , 4,632 non-relatives In group quarters: 230
Size of family households: 4,477 2-persons , 5,251 3-persons , 6,595 4-persons , 3,688 5-persons , 2,589 6-persons , 1,879 7-or-more-persons .
Size of nonfamily households: 3,588 1-person , 1,905 2-persons , 622 3-persons , 267 4-persons .
9,839 married couples with children. single-parent households (4,506 men , 4,918 women ).
15.8% of residents of East Los Angeles speak English at home. of residents speak Spanish at home (54% speak English very well , 16% speak English well , 19% speak English not well , 11% don't speak English at all ).of residents speak other Indo-European language at home (77% speak English very well , 8% speak English well , 15% speak English not well ).of residents speak Asian or Pacific Island language at home (34% speak English very well , 32% speak English well , 17% speak English not well , 17% don't speak English at all ).of residents speak other language at home (51% speak English very well , 13% speak English well , 36% don't speak English at all ).
Foreign born population: 45,307 (40.1%)of them are naturalized citizens )
Median number of rooms in houses and condos:
Median number of rooms in apartments
Owner-occupied Renter-occupied
Bedrooms in owner-occupied houses and condos in East Los Angeles, California
94 no bedroom 235 1 bedroom 3,631 2 bedrooms 5,204 3 bedrooms 1,151 4 bedrooms 219 5+ bedrooms
Bedrooms in renter-occupied apartments in East Los Angeles, California
1,827 no bedroom 5,349 1 bedroom 7,912 2 bedrooms 4,231 3 bedrooms 1,008 4 bedrooms 0 5+ bedrooms
Owner-occupied Renter-occupied
Rooms in owner-occupied houses in East Los Angeles, California
64 1 room 35 2 rooms 568 3 rooms 2,562 4 rooms 3,693 5 rooms 2,020 6 rooms 583 7 rooms 576 8 rooms 433 9+ rooms
Rooms in renter-occupied apartments in East Los Angeles, California
1,720 1 room 674 2 rooms 5,273 3 rooms 6,734 4 rooms 3,404 5 rooms 1,456 6 rooms 558 7 rooms 464 8 rooms 44 9+ rooms
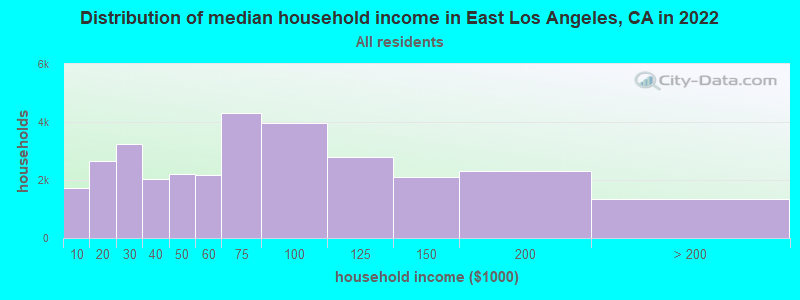
East Los Angeles, CA household income distribution 1,732 Less than $10,0002,670 $10,000 to $19,9993,234 $20,000 to $29,9992,022 $30,000 to $39,9992,198 $40,000 to $49,9992,163 $50,000 to $59,9994,302 $60,000 to $74,9993,957 $75,000 to $99,9992,807 $100,000 to $124,9992,115 $125,000 to $149,9992,321 $150,000 to $199,9991,340 $200,000 or more
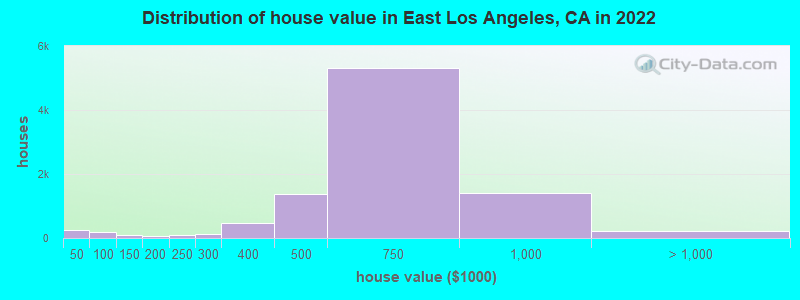
Home value of owner - occupied houses in 2022 in East Los Angeles, CA 129 Less than $10,00027 $25,000 to $29,99980 $30,000 to $34,9993 $35,000 to $39,9998 $40,000 to $49,99938 $50,000 to $59,99947 $60,000 to $69,99923 $70,000 to $79,99928 $80,000 to $89,99926 $90,000 to $99,99953 $100,000 to $124,99939 $125,000 to $149,99950 $150,000 to $174,9998 $175,000 to $199,99988 $200,000 to $249,999112 $250,000 to $299,999467 $300,000 to $399,9991,377 $400,000 to $499,9995,326 $500,000 to $749,9991,421 $750,000 to $999,999149 $1,000,000 to $1,499,99911 $1,500,000 to $1,999,99967 $2,000,000 or moreRent paid by renters in 2022 in East Los Angeles, CA 39 $100 to $149282 $200 to $249219 $250 to $299150 $300 to $34942 $350 to $39954 $450 to $499560 $500 to $54969 $550 to $599276 $600 to $649993 $700 to $749191 $750 to $7991,180 $800 to $8991,640 $900 to $9994,225 $1,000 to $1,2493,610 $1,250 to $1,4994,207 $1,500 to $1,9991,249 $2,000 to $2,499526 $2,500 to $2,999141 $3,000 to $3,49934 $3,500 or more640 No cash rent
Percentage of workers working in this county: 96.1%Number of people working at home: 3,812 (7.0% of all workers )
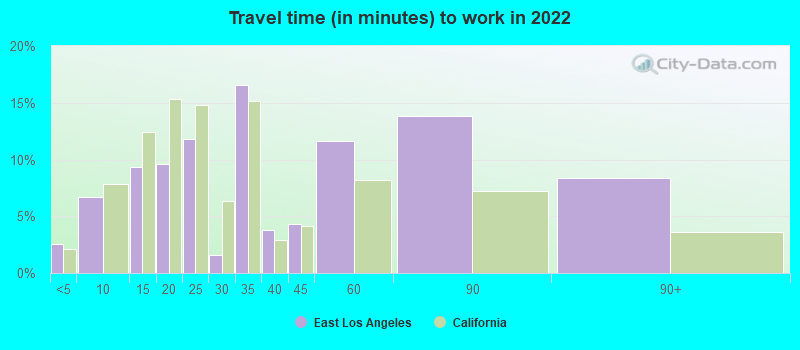
Travel time to work (commute)
Less than 5 minutes: 7945 to 9 minutes: 1,57810 to 14 minutes: 5,40215 to 19 minutes: 7,71920 to 24 minutes: 8,30025 to 29 minutes: 3,79830 to 34 minutes: 9,23835 to 39 minutes: 1,46940 to 44 minutes: 2,54245 to 59 minutes: 5,25160 to 89 minutes: 3,45490 or more minutes: 1,208
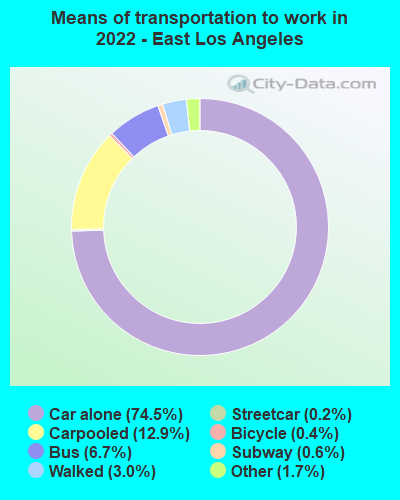
Means of transportation to work:
Drove a car alone: 23,277 (66.4%)Carpooled: 4,019 (11.5%)Bus : 2,105 (6.0%)Subway or elevated rail : 52 (0.1%)Long-distance train or commuter rail : 202 (0.6%)Taxi: 523 (1.5%)Bicycle: 130 (0.4%)Walked: 947 (2.7%)Worked at home: 3,812 (10.9%)
Unemployment by race in 2022
Unemployment rate for White non-Hispanic residents 11.1% Males12.6% FemalesUnemployment rate for Black residents 7.4% Males16.4% FemalesUnemployment rate for American Indian and Alaska Native residents 3.1% Males12.2% FemalesUnemployment rate for Asian residents 3.3% Males7.4% FemalesUnemployment rate for other race residents 4.3% Males5.3% FemalesUnemployment rate for two or more race residents 2.7% Males7.2% FemalesUnemployment rate for Hispanic or Latino residents 4.5% Males6.2% Females
Year of entry for the foreign-born population in East Los Angeles, California
4,340 2010 or later 8,253 2000 to 2009 9,912 1990 to 1999 17,278 1980 to 1989 13,510 1970 to 1979 8,728 Before 1970
First ancestries reported:
American: 740 (0.8%)
German: 199 (0.2%)
Irish: 126 (0.1%)
Italian: 126 (0.1%)
English: 120 (0.1%)
African: 90 (0.10%)
Polish: 52 (0.06%)
Russian: 52 (0.06%)
French: 29 (0.03%)
European: 27 (0.03%)
West Indian: 27 (0.03%)
Lithuanian: 18 (0.02%)
Nigerian: 18 (0.02%)
Ukrainian: 17 (0.02%)
Armenian: 12 (0.01%)
Brazilian: 12 (0.01%)
Scotch-Irish: 12 (0.01%)
Syrian: 11 (0.01%)
Canadian: 11 (0.01%)
Egyptian: 8 (0.01%)
Danish: 8 (0.01%)
Swiss: 8 (0.01%)
Iranian: 6 (0.01%)
British: 5 (0.01%)
Dutch: 5 (0.01%) Most common places of birth for foreign-born residents (%): Mexico East Los Angeles:
82.7% (36,672)California:
37.2% (3,881,193)
Guatemala East Los Angeles:
4.9% (2,154)California:
2.8% (290,436)
El Salvador East Los Angeles:
4.6% (2,022)California:
4.2% (440,287)
Place of birth for U.S.-born residents:
This state: 64,813Other state: 2,373Northeast: 578Midwest: 421South: 795West: 579 95.4% of East Los Angeles residents lived in the same house 1 years ago.
Out of people who lived in different houses, 45.5% lived in this county.
Out of people who lived in different counties, 53.9% lived in California.
East Los Angeles:
95.4%State average:
88.9%
Education attainment for males 25 years and older:
No schooling: 4,545Nursery to 4th grade: 1,3415th and 6th grade: 3,9987th and 8th grade: 1,1149th grade: 2,59510th grade: 33011th grade: 94512th grade, no diploma: 2,462High school graduate (or equivalency): 9,473Less than 1 year of college: 1,289Some college more than 1 year, no degree: 4,846Associate degree: 1,472Bachelor's degree: 3,071Master's degree: 846Professional school degree: 124Doctorate degree: 36
Education attainment for females 25 years and older:
No schooling: 3,644Nursery to 4th grade: 2,0905th and 6th grade: 4,8257th and 8th grade: 7579th grade: 2,66610th grade: 51811th grade: 86612th grade, no diploma: 1,680High school graduate (or equivalency): 7,312Less than 1 year of college: 2,018Some college more than 1 year, no degree: 3,323Associate degree: 1,013Bachelor's degree: 3,206Master's degree: 1,059Professional school degree: 177Doctorate degree: 0
Housing units in structures:
One, detached: 19,534One, attached: 5,387Two: 1,8733 or 4: 1,9615 to 9: 1,82110 to 19: 71020 to 49: 58050 or more: 561Mobile homes: 138Boats, RVs, vans, etc.: 55Housing units lacking complete plumbing facilities in 2022: 3.4%Housing units lacking complete kitchen facilities in 2022: 6.5%House/condo owner moved in on average 23 years ago
Renter moved in on average 8 years ago
Private vs. public school enrollment:
Students in private schools in grades 1 to 8 (elementary and middle school): 323 Here:
2.6%California:
10.5%
Students in private schools in grades 9 to 12 (high school): 406 Students in private undergraduate colleges: 586 Here:
8.7%California:
15.9%