East Love, OK (Oklahoma) Houses and Residents
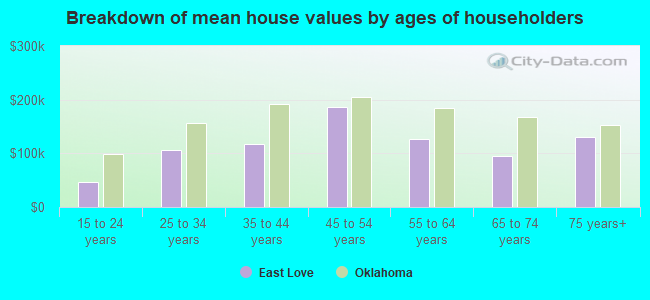
| East Love: | $169,043 |
| Oklahoma: | $191,700 |
Total population: 7,157 (Urban population: 0, Rural population: 6,972 (263 farm, 6,709 nonfarm))
Houses: 3,076 (2,671 occupied: 2,131 owner occupied, 540 renter occupied)
| % of renters here: | 20% |
| State: | 35% |
Housing density: 11 houses/condos per square mile
Median price asked for vacant for-sale houses and condos in 2022 in this county: $148,571.
Median contract rent in 2022: $676 (lower quartile is $522, upper quartile is $806)
Median rent asked for vacant for-rent units in 2022: $719
Median gross rent in East Love, OK in 2022: $825
Housing units in East Love with a mortgage: 675 (36 second mortgage, 31 home equity loan, 0 both second mortgage and home equity loan)
Houses without a mortgage: 556


Household type by relationship:
Households: 9,335- In family households: 8,115 (1,975 male householders, 680 female householders)
2,048 spouses, 2,601 children (2,357 natural, 79 adopted, 165 stepchildren), 274 grandchildren, 58 brothers or sisters, 84 parents, foster children, 119 other relatives, 218 non-relatives
- In nonfamily households: 1,220 (530 male householders (451 living alone)), 528 female householders (466 living alone)), 162 nonrelatives
- In group quarters: 88 (68 institutionalized population)
1,572 married couples with children.
450 single-parent households (128 men, 322 women).
92.1% of residents of East Love speak English at home.
7.4% of residents speak Spanish at home (52% speak English very well, 26% speak English well, 20% speak English not well, 3% don't speak English at all).
0.2% of residents speak other Indo-European language at home (100% speak English very well).
0.1% of residents speak Asian or Pacific Island language at home (100% speak English very well).
0.3% of residents speak other language at home (100% speak English very well).
Foreign born population: 545 (6.6%)
(37.4% of them are naturalized citizens)
| Here: | 6.1 |
| State: | 6.1 |
| Here: | 4.9 |
| State: | 4.5 |
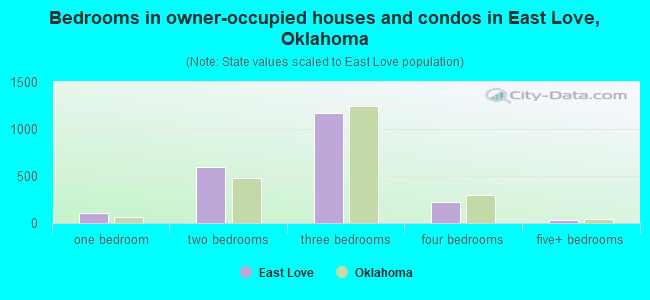
- Bedrooms in owner-occupied houses and condos in East Love, Oklahoma
- 5no bedroom
- 1041 bedroom
- 5992 bedrooms
- 1,1663 bedrooms
- 2264 bedrooms
- 315+ bedrooms
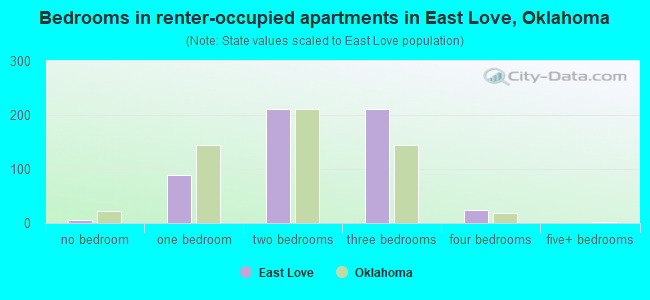
- Bedrooms in renter-occupied apartments in East Love, Oklahoma
- 5no bedroom
- 881 bedroom
- 2112 bedrooms
- 2113 bedrooms
- 254 bedrooms
- 05+ bedrooms
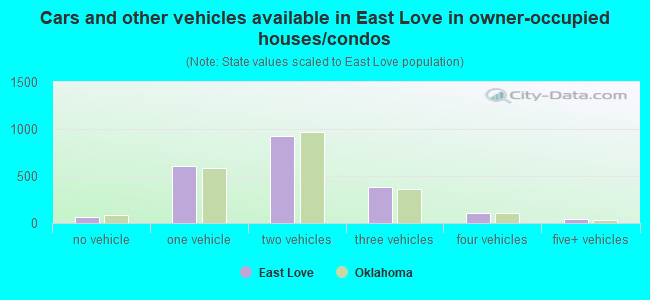
- Cars and other vehicles available in East Love in owner-occupied houses/condos
- 69no vehicle
- 6021 vehicle
- 9212 vehicles
- 3863 vehicles
- 1114 vehicles
- 425+ vehicles
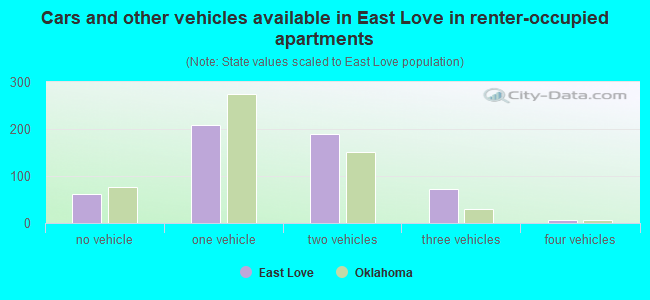
- Cars and other vehicles available in East Love in renter-occupied apartments
- 61no vehicle
- 2091 vehicle
- 1902 vehicles
- 733 vehicles
- 74 vehicles
- 05+ vehicles
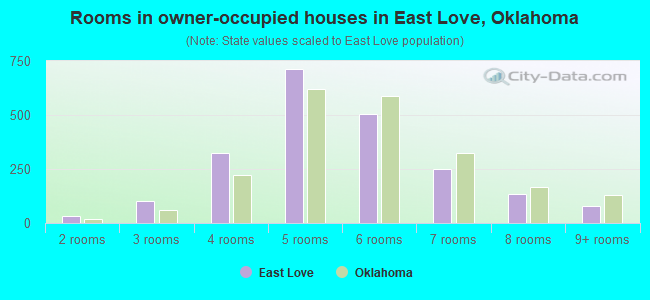
- Rooms in owner-occupied houses in East Love, Oklahoma
- 01 room
- 312 rooms
- 1003 rooms
- 3234 rooms
- 7135 rooms
- 5066 rooms
- 2487 rooms
- 1338 rooms
- 779+ rooms
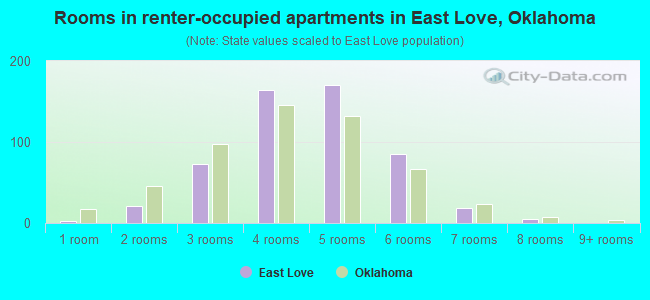
- Rooms in renter-occupied apartments in East Love, Oklahoma
- 31 room
- 212 rooms
- 733 rooms
- 1644 rooms
- 1705 rooms
- 856 rooms
- 197 rooms
- 58 rooms
- 09+ rooms
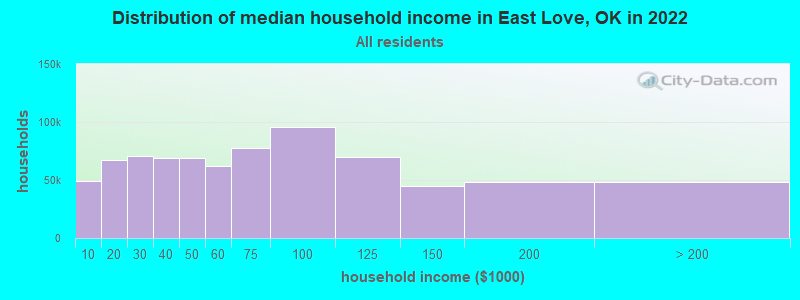
East Love, OK household income distribution

- 29,859Less than $10,000
- 47,342$10,000 to $19,999
- 46,511$20,000 to $29,999
- 45,750$30,000 to $39,999
- 42,248$40,000 to $49,999
- 42,294$50,000 to $59,999
- 55,653$60,000 to $74,999
- 68,336$75,000 to $99,999
- 51,106$100,000 to $124,999
- 30,931$125,000 to $149,999
- 33,460$150,000 to $199,999
- 31,994$200,000 or more
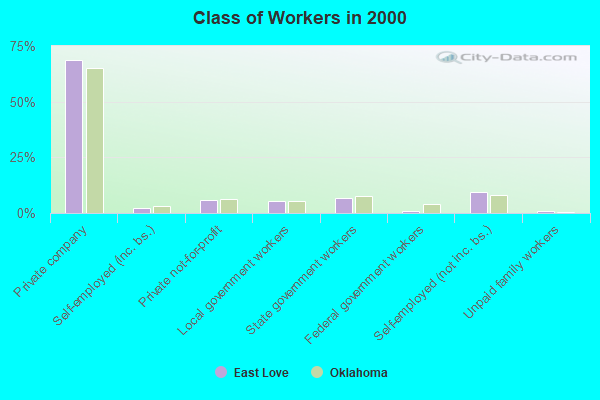
Percentage of workers working in this county: 51.3%
Number of people working at home: 299 (8.5% of all workers)
Travel time to work (commute)
- Less than 5 minutes: 221
- 5 to 9 minutes: 466
- 10 to 14 minutes: 384
- 15 to 19 minutes: 502
- 20 to 24 minutes: 378
- 25 to 29 minutes: 147
- 30 to 34 minutes: 385
- 35 to 39 minutes: 62
- 40 to 44 minutes: 47
- 45 to 59 minutes: 129
- 60 to 89 minutes: 162
- 90 or more minutes: 145
Means of transportation to work:
- Drove a car alone: 2,484 (80.4%)
- Carpooled: 427 (13.8%)
- Bus or trolley bus: 7 (0.2%)
- Motorcycle: 1 (0.0%)
- Walked: 61 (2.0%)
- Other means: 48 (1.6%)
- Worked at home: 61 (2.0%)
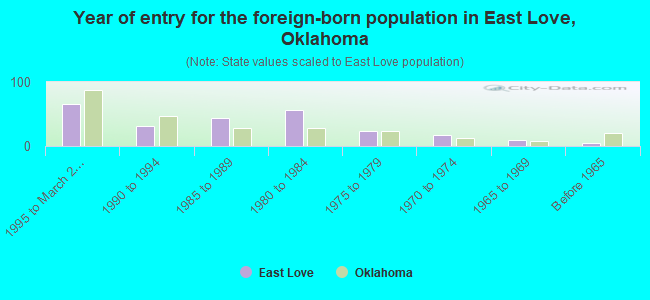
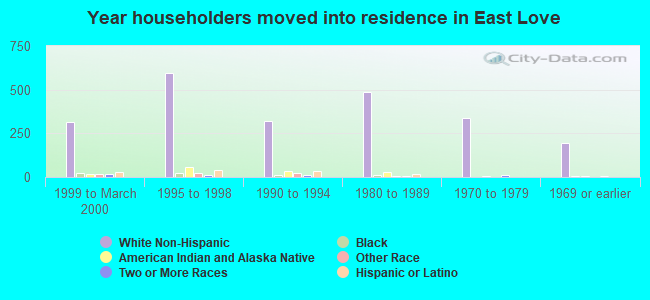
- Year of entry for the foreign-born population in East Love, Oklahoma
- 651995 to March 2000
- 321990 to 1994
- 431985 to 1989
- 571980 to 1984
- 241975 to 1979
- 171970 to 1974
- 101965 to 1969
- 4Before 1965
Most common places of birth for foreign-born residents (%):
| East Love: | 92.5% (233) |
| Oklahoma: | 42.5% (55,971) |
| East Love: | 2.8% (7) |
| Oklahoma: | 1.2% (1,635) |
| East Love: | 2.4% (6) |
| Oklahoma: | 2.4% (3,221) |
Place of birth for U.S.-born residents:
- This state: 4,229
- Other state: 2,465
- Northeast: 68
- Midwest: 230
- South: 1,671
- West: 496
62% of East Love residents lived in the same house 5 years ago.
Out of people who lived in different houses, 50% lived in this county.
Out of people who lived in different counties, 43% lived in Oklahoma.
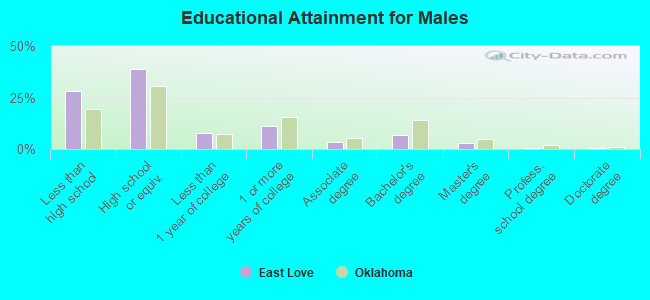
Education attainment for males 25 years and older:
- No schooling: 27
- Nursery to 4th grade: 24
- 5th and 6th grade: 26
- 7th and 8th grade: 141
- 9th grade: 95
- 10th grade: 92
- 11th grade: 96
- 12th grade, no diploma: 116
- High school graduate (or equivalency): 847
- Less than 1 year of college: 173
- Some college more than 1 year, no degree: 244
- Associate degree: 71
- Bachelor's degree: 146
- Master's degree: 62
- Professional school degree: 12
- Doctorate degree: 9
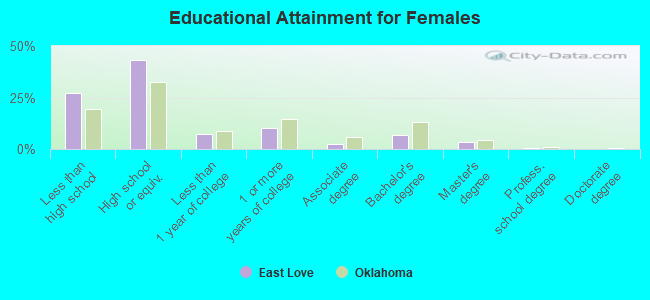
Education attainment for females 25 years and older:
- No schooling: 40
- Nursery to 4th grade: 15
- 5th and 6th grade: 31
- 7th and 8th grade: 164
- 9th grade: 90
- 10th grade: 126
- 11th grade: 88
- 12th grade, no diploma: 101
- High school graduate (or equivalency): 1,039
- Less than 1 year of college: 173
- Some college more than 1 year, no degree: 242
- Associate degree: 54
- Bachelor's degree: 162
- Master's degree: 79
- Professional school degree: 12
- Doctorate degree: 0
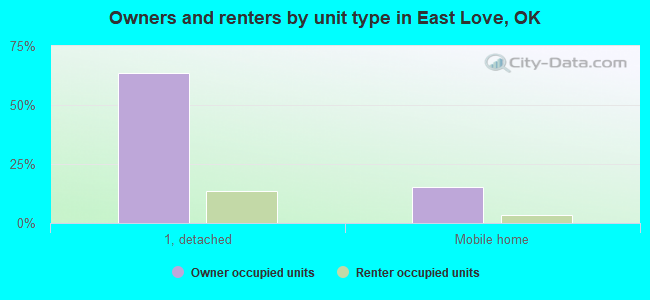
Housing units in structures:
- One, detached: 2,292
- One, attached: 52
- Two: 5
- 3 or 4: 24
- 5 to 9: 27
- 10 to 19: 4
- 20 to 49: 22
- 50 or more: 4
- Mobile homes: 625
- Boats, RVs, vans, etc.: 21
Median worth of mobile homes: $59,618
Housing units lacking complete kitchen facilities: 2.2%
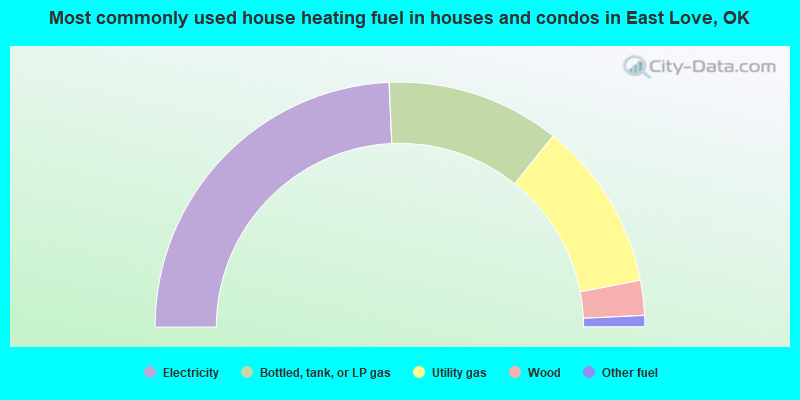
- 48.6%Electricity
- 22.9%Bottled, tank, or LP gas
- 22.4%Utility gas
- 4.6%Wood
- 1.5%Other fuel
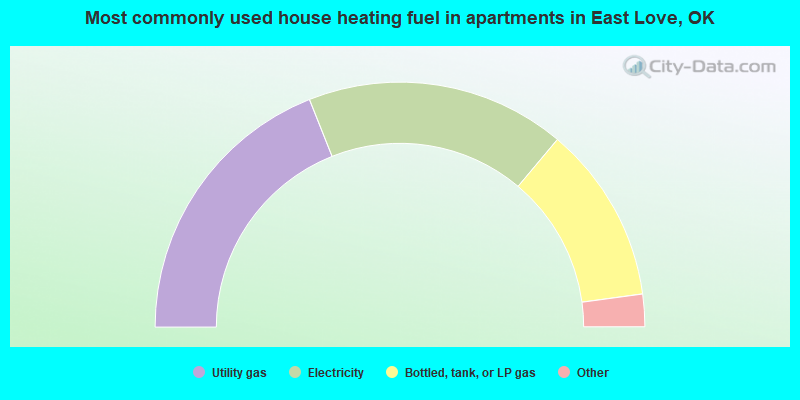
- 38.0%Utility gas
- 34.3%Electricity
- 23.5%Bottled, tank, or LP gas
- 2.4%Wood
- 1.9%Other fuel
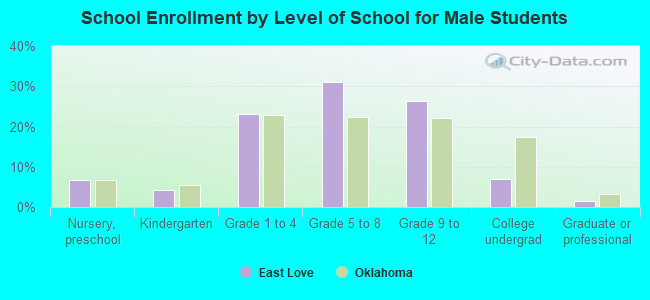
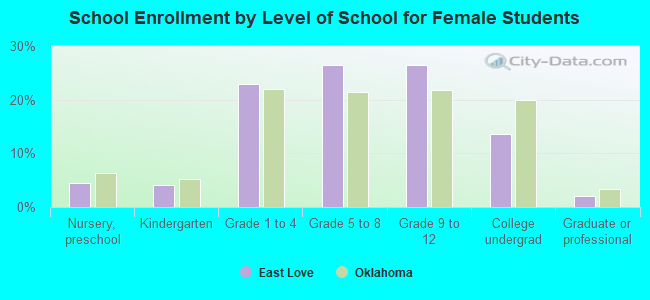
Private vs. public school enrollment:
| Here: | 4.2% |
| Oklahoma: | 6.4% |
| Here: | 2.7% |
| Oklahoma: | 6.2% |
| Here: | 5.7% |
| Oklahoma: | 16.6% |