East Massapequa, NY (New York) Houses and Residents
Estimated median house or condo value in 2022: $587,880 (it was $224,900 in 2000 )
East Massapequa:
$587,880New York:
$400,400
Lower value quartile - upper value quartile: $469,040 - $712,051Mean price in 2022: Detached houses: $647,003 Here:
$647,003State:
$476,719
Townhouses or other attached units: $553,650 Here:
$553,650State:
$699,270
In 2-unit structures: $443,039 Here:
$443,039State:
$713,077
In 5-or-more-unit structures: $405,502 Here:
$405,502State:
$912,009
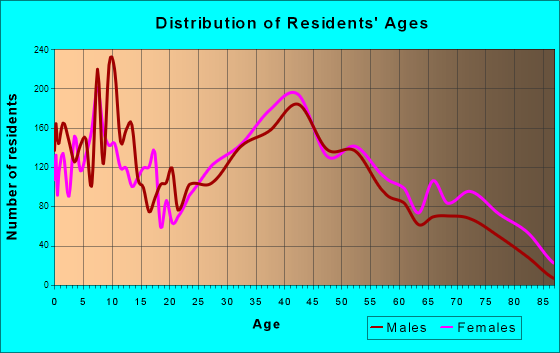
Total population: 19,069 (All urban)
Houses: 7,261 (7,093 occupied: 6,388 owner occupied, 693 renter occupied )
% of renters here:
10%State:
46%
Housing density: 2,076 houses/condos per square mile
Median price asked for vacant for-sale houses and condos in 2022: $412,730.
Median contract rent in 2022: $1,671
Median rent asked for vacant for-rent units in 2022: $327
Median gross rent in East Massapequa, NY in 2022: $1,867
Housing units in East Massapequa with a mortgage: 3,556 (427 second mortgage, 14 home equity loan, 332 both second mortgage and home equity loan )Houses without a mortgage: 220
Median household income for houses/condos with a mortgage: $177,255
Median household income for apartments without a mortgage: $95,120
Median monthly housing costs: $2,371
Data:
Median house or condo value ($)
Median house or condo value ($ change since 2000)
Median house or condo value ($) - White
Median house or condo value ($) - Black or African American
Median house or condo value ($) - Asian
Median house or condo value ($) - Hispanic or Latino
Median house or condo value ($) - American Indian and Alaska Native
Median house or condo value ($) - Multirace
Median house or condo value ($) - Other Race
Median price asked for mobile homes ($)
Household density (households per square mile)
Mean house or condo value by units in structure - 1, detached ($)
Mean house or condo value by units in structure - 1, attached ($)
Mean house or condo value by units in structure - 2 ($)
Mean house or condo value by units in structure by units in structure - 3 or 4 ($)
Mean house or condo value by units in structure - 5 or more ($)
Mean house or condo value by units in structure - Boat, RV, van, etc. ($)
Mean house or condo value by units in structure - Mobile home ($)
Median contract rent ($)
Median contract rent - Lower quartile ($)
Median contract rent - Upper quartile ($)
Median gross rent ($)
Urban houses (%)
Rural houses (%)
Houses occupied (%)
Houses occupied (% change since 2000)
Houses owner occupied (%)
Houses owner occupied (% change since 2000)
Houses renter occupied (%)
Houses renter occupied (% change since 2000)
Vacant housing units - For rent (%)
Vacant housing units - For rent (% change since 2000)
Vacant housing units - For sale only (%)
Vacant housing units - For sale only (% change since 2000)
Vacant housing units - Rented or sold, not occupied (%)
Vacant housing units - Rented or sold, not occupied (% change since 2000)
Vacant housing units - For seasonal, recreational, or occasional use (%)
Vacant housing units - For seasonal, recreational, or occasional use (% change since 2000)
Vacant housing units - For migrant workers (%)
Vacant housing units - For migrant workers (% change since 2000)
Vacant housing units - Other vacant (%)
Vacant housing units - Other vacant (% change since 2000)
Median monthly housing costs ($)
Median household income for houses/condos with a mortgage ($)
Median household income for houses/condos without a mortgage ($)
Median household income ($)
Median household income ($) - White
Median household income ($) - Black or African American
Median household income ($) - Asian
Median household income ($) - Hispanic or Latino
Median household income ($) - American Indian and Alaska Native
Median household income ($) - Multirace
Median household income ($) - Other Race
Mortgage status - with mortgage (%)
Mortgage status - with second mortgage (%)
Mortgage status - with home equity loan (%)
Mortgage status - with both second mortgage and home equity loan (%)
Mortgage status - without a mortgage (%)
Median year house/condo built
Median year apartment built
Household type by relationship - Male householder living alone (%)
Household type by relationship - Male householder not living alone (%)
Household type by relationship - Female householder living alone (%)
Household type by relationship - Female householder not living alone (%)
Household type by relationship - Opposite-Sex spouse (%)
Household type by relationship - Same-Sex spouse (%)
Household type by relationship - Opposite-Sex unmarried partner (%)
Household type by relationship - Same-Sex unmarried partner (%)
Household type by relationship - In group quarters (%)
Size of family households - 2-person household (%)
Size of family households - 3-person household (%)
Size of family households - 4-person household (%)
Size of family households - 5-person household (%)
Size of family households - 6-person household (%)
Size of family households - 7-or-more-person household (%)
Size of nonfamily households - 1-person household (%)
Size of nonfamily households - 2-person household (%)
Size of nonfamily households - 3-person household (%)
Size of nonfamily households - 4-person household (%)
Size of nonfamily households - 5-person household (%)
Size of nonfamily households - 6-person household (%)
Size of nonfamily households - 7-or-moreperson household (%)
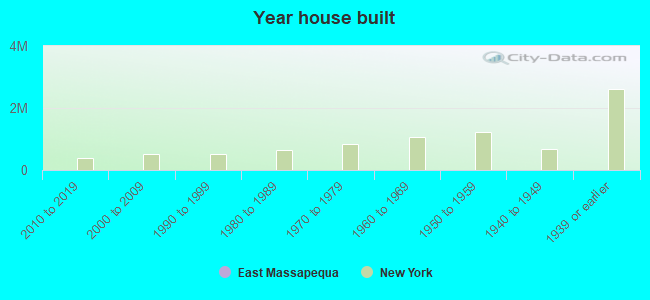
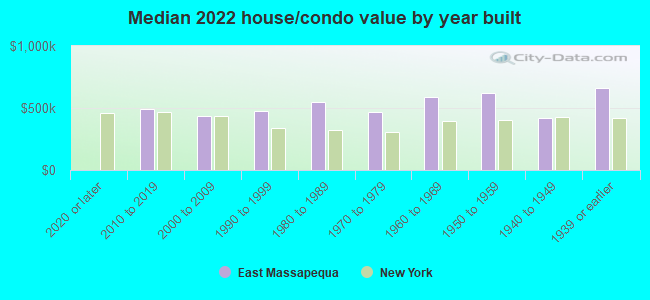
Year house built - Built 2010 or later (%)
Year house built - Built 2000 to 2009 (%)
Year house built - Built 1990 to 1999 (%)
Year house built - Built 1980 to 1989 (%)
Year house built - Built 1970 to 1979 (%)
Year house built - Built 1960 to 1969 (%)
Year house built - Built 1950 to 1959 (%)
Year house built - Built 1940 to 1949 (%)
Year house built - Built 1939 or earlier (%)
Median number of rooms in houses and condos
Median number of rooms in apartments
Median number of bedrooms in owner occupied houses
Mean number of bedrooms in owner occupied houses
Median number of bedrooms in renter occupied houses
Mean number of bedrooms in renter occupied houses
Median number of vehichles in owner occupied houses
Mean number of vehichles in owner occupied houses
Median number of vehichles in renter occupied houses
Mean number of vehichles in renter occupied houses
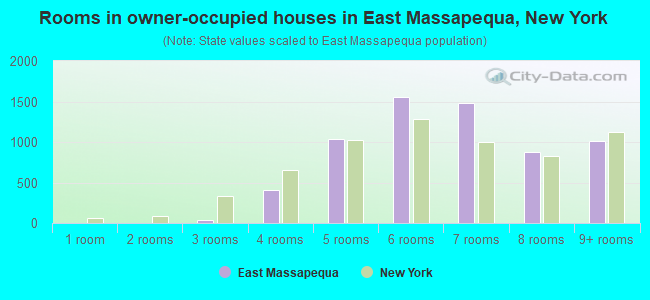
Rooms in owner-occupied houses - 1 room (%)
Rooms in owner-occupied houses - 2 rooms (%)
Rooms in owner-occupied houses - 3 rooms (%)
Rooms in owner-occupied houses - 4 rooms (%)
Rooms in owner-occupied houses - 5 rooms (%)
Rooms in owner-occupied houses - 6 rooms (%)
Rooms in owner-occupied houses - 7 rooms (%)
Rooms in owner-occupied houses - 8 rooms (%)
Rooms in owner-occupied houses - 9+ rooms (%)
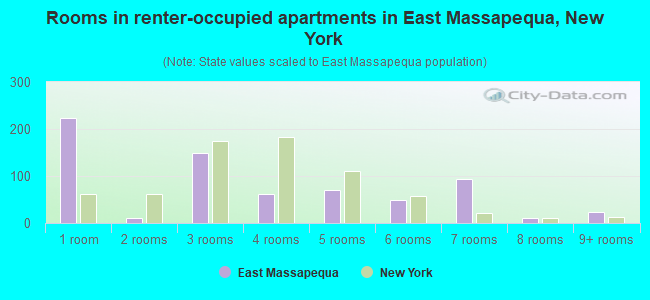
Rooms in renter-occupied houses - 1 room (%)
Rooms in renter-occupied houses - 2 rooms (%)
Rooms in renter-occupied houses - 3 rooms (%)
Rooms in renter-occupied houses - 4 rooms (%)
Rooms in renter-occupied houses - 5 rooms (%)
Rooms in renter-occupied houses - 6 rooms (%)
Rooms in renter-occupied houses - 7 rooms (%)
Rooms in renter-occupied houses - 8 rooms (%)
Rooms in renter-occupied houses - 9+ rooms (%)
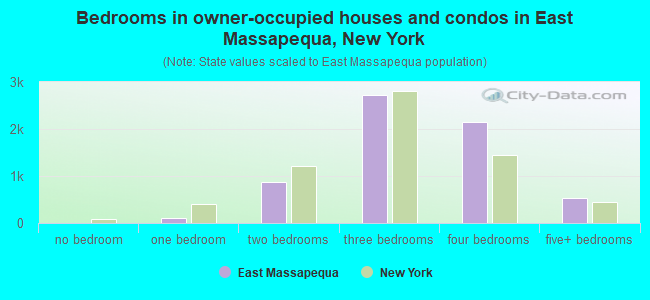
Bedrooms in owner-occupied houses - no bedrooms (%)
Bedrooms in owner-occupied houses - 1 bedroom (%)
Bedrooms in owner-occupied houses - 2 bedrooms (%)
Bedrooms in owner-occupied houses - 3 bedrooms (%)
Bedrooms in owner-occupied houses - 4 bedrooms (%)
Bedrooms in owner-occupied houses - 5+ bedrooms (%)
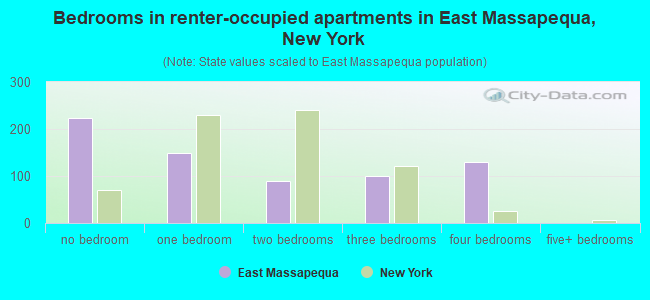
Bedrooms in renter-occupied houses - no bedrooms (%)
Bedrooms in renter-occupied houses - 1 bedroom (%)
Bedrooms in renter-occupied houses - 2 bedrooms (%)
Bedrooms in renter-occupied houses - 3 bedrooms (%)
Bedrooms in renter-occupied houses - 4 bedrooms (%)
Bedrooms in renter-occupied houses - 5+ bedrooms (%)
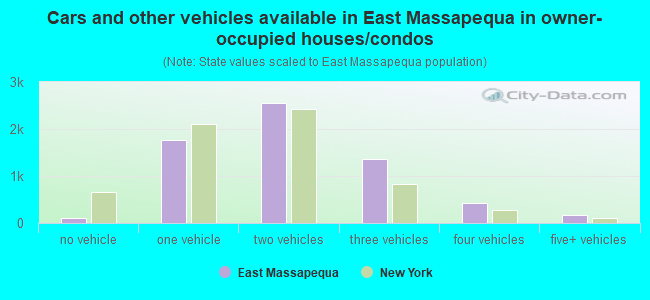
Vehicles available in owner-occupied houses - no vehicle available (%)
Vehicles available in owner-occupied houses - 1 vehicle available(%)
Vehicles available in owner-occupied houses - 2 Vehicles available (%)
Vehicles available in owner-occupied houses - 3 Vehicles available (%)
Vehicles available in owner-occupied houses - 4 Vehicles available (%)
Vehicles available in owner-occupied houses - 5+ Vehicles available (%)
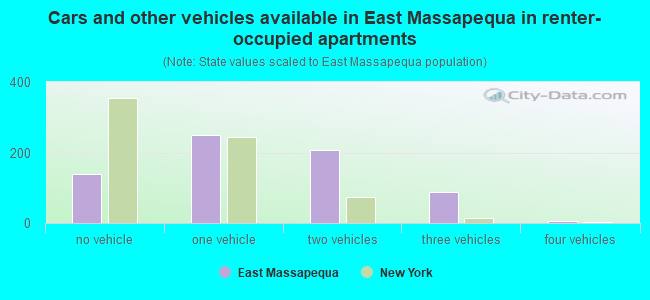
Vehicles available in renter-occupied houses - no vehicle available (%)
Vehicles available in renter-occupied houses - 1 vehicle available (%)
Vehicles available in renter-occupied houses - 2 Vehicles available (%)
Vehicles available in renter-occupied houses - 3 Vehicles available (%)
Vehicles available in renter-occupied houses - 4 Vehicles available (%)
Vehicles available in renter-occupied houses - 5+ Vehicles available (%)
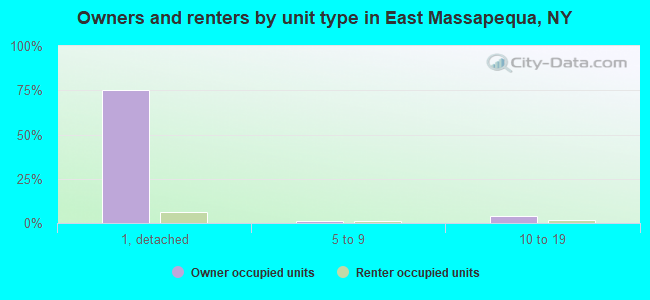
Housing units in structures - 1, detached (%)
Housing units in structures - 1, attached (%)
Housing units in structures - 2 (%)
Housing units in structures - 3 or 4 (%)
Housing units in structures - 5 to 9 (%)
Housing units in structures - 10 to 19 (%)
Housing units in structures - 20 to 49 (%)
Housing units in structures - 50 or more (%)
Housing units in structures - Mobile home (%)
Housing units in structures - Boat, RV, van, etc. (%)
Housing units in structures - Owners - 1, detached (%)
Housing units in structures - Owners - 1, attached (%)
Housing units in structures - Owners - 2 (%)
Housing units in structures - Owners - 3 or 4 (%)
Housing units in structures - Owners - 5 to 9 (%)
Housing units in structures - Owners - 10 to 19 (%)
Housing units in structures - Owners - 20 to 49 (%)
Housing units in structures - Owners - 50 or more (%)
Housing units in structures - Owners - Mobile home (%)
Housing units in structures - Owners - Boat, RV, van, etc. (%)
Housing units in structures - Renters - 1, detached (%)
Housing units in structures - Renters - 1, attached (%)
Housing units in structures - Renters - 2 (%)
Housing units in structures - Renters - 3 or 4 (%)
Housing units in structures - Renters - 5 to 9 (%)
Housing units in structures - Renters - 10 to 19 (%)
Housing units in structures - Renters - 20 to 49 (%)
Housing units in structures - Renters - 50 or more (%)
Housing units in structures - Renters - Mobile home (%)
Housing units in structures - Renters - Boat, RV, van, etc. (%)
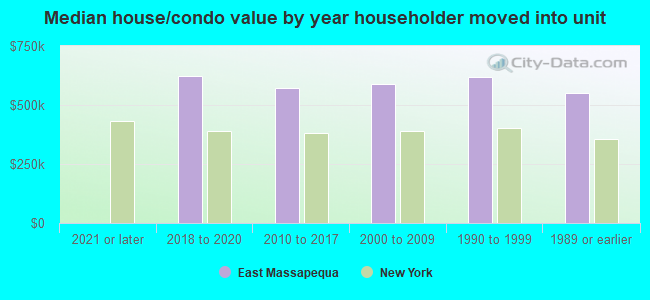
House/condo owner moved in on average (years ago)
Renter moved in on average (years ago)
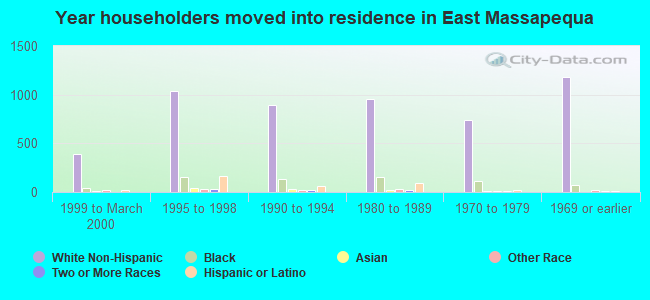
Year householder moved into unit - Moved in 1999 to March 2000 (%)
Year householder moved into unit - Moved in 1999 to March 2000 (%) - White
Year householder moved into unit - Moved in 1999 to March 2000 (%) - Black or African American
Year householder moved into unit - Moved in 1999 to March 2000 (%) - Asian
Year householder moved into unit - Moved in 1999 to March 2000 (%) - Hispanic or Latino
Year householder moved into unit - Moved in 1999 to March 2000 (%) - American Indian and Alaska Native
Year householder moved into unit - Moved in 1999 to March 2000 (%) - Multirace
Year householder moved into unit - Moved in 1999 to March 2000 (%) - Other Race
Year householder moved into unit - Moved in 1995 to 1998 (%)
Year householder moved into unit - Moved in 1995 to 1998 (%) - White
Year householder moved into unit - Moved in 1995 to 1998 (%) - Black or African American
Year householder moved into unit - Moved in 1995 to 1998 (%) - Asian
Year householder moved into unit - Moved in 1995 to 1998 (%) - Hispanic or Latino
Year householder moved into unit - Moved in 1995 to 1998 (%) - American Indian and Alaska Native
Year householder moved into unit - Moved in 1995 to 1998 (%) - Multirace
Year householder moved into unit - Moved in 1995 to 1998 (%) - Other Race
Year householder moved into unit - Moved in 1990 to 1994 (%)
Year householder moved into unit - Moved in 1990 to 1994 (%) - White
Year householder moved into unit - Moved in 1990 to 1994 (%) - Black or African American
Year householder moved into unit - Moved in 1990 to 1994 (%) - Asian
Year householder moved into unit - Moved in 1990 to 1994 (%) - Hispanic or Latino
Year householder moved into unit - Moved in 1990 to 1994 (%) - American Indian and Alaska Native
Year householder moved into unit - Moved in 1990 to 1994 (%) - Multirace
Year householder moved into unit - Moved in 1990 to 1994 (%) - Other Race
Year householder moved into unit - Moved in 1980 to 1989 (%)
Year householder moved into unit - Moved in 1980 to 1989 (%) - White
Year householder moved into unit - Moved in 1980 to 1989 (%) - Black or African American
Year householder moved into unit - Moved in 1980 to 1989 (%) - Asian
Year householder moved into unit - Moved in 1980 to 1989 (%) - Hispanic or Latino
Year householder moved into unit - Moved in 1980 to 1989 (%) - American Indian and Alaska Native
Year householder moved into unit - Moved in 1980 to 1989 (%) - Multirace
Year householder moved into unit - Moved in 1980 to 1989 (%) - Other Race
Year householder moved into unit - Moved in 1970 to 1979 (%)
Year householder moved into unit - Moved in 1970 to 1979 (%) - White
Year householder moved into unit - Moved in 1970 to 1979 (%) - Black or African American
Year householder moved into unit - Moved in 1970 to 1979 (%) - Asian
Year householder moved into unit - Moved in 1970 to 1979 (%) - Hispanic or Latino
Year householder moved into unit - Moved in 1970 to 1979 (%) - American Indian and Alaska Native
Year householder moved into unit - Moved in 1970 to 1979 (%) - Multirace
Year householder moved into unit - Moved in 1970 to 1979 (%) - Other Race
Year householder moved into unit - Moved in 1969 or earlier (%)
Year householder moved into unit - Moved in 1969 or earlier (%) - White
Year householder moved into unit - Moved in 1969 or earlier (%) - Black or African American
Year householder moved into unit - Moved in 1969 or earlier (%) - Asian
Year householder moved into unit - Moved in 1969 or earlier (%) - Hispanic or Latino
Year householder moved into unit - Moved in 1969 or earlier (%) - American Indian and Alaska Native
Year householder moved into unit - Moved in 1969 or earlier (%) - Multirace
Year householder moved into unit - Moved in 1969 or earlier (%) - Other Race
Housing units lacking complete plumbing facilities (%)
Housing units lacking complete kitchen facilities (%)
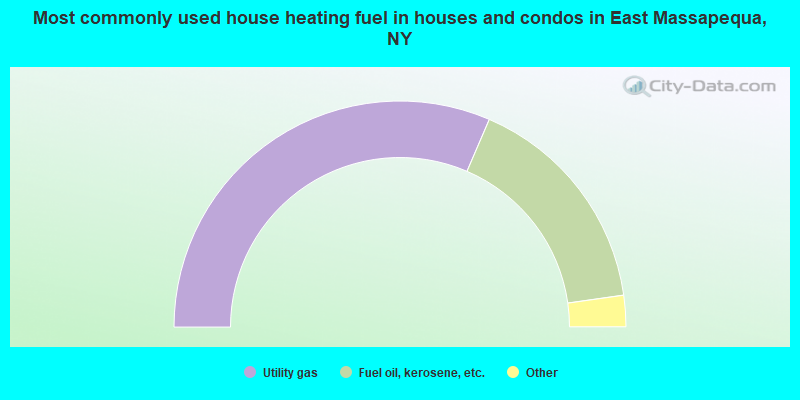
House heating fuel used in houses and condos - Utility gas (%)
House heating fuel used in houses and condos - Bottled, tank, or LP gas (%)
House heating fuel used in houses and condos - Electricity (%)
House heating fuel used in houses and condos - Fuel oil, kerosene, etc. (%)
House heating fuel used in houses and condos - Coal or coke (%)
House heating fuel used in houses and condos - Wood (%)
House heating fuel used in houses and condos - Solar energy (%)
House heating fuel used in houses and condos - Other fuel (%)
House heating fuel used in houses and condos - No fuel used (%)
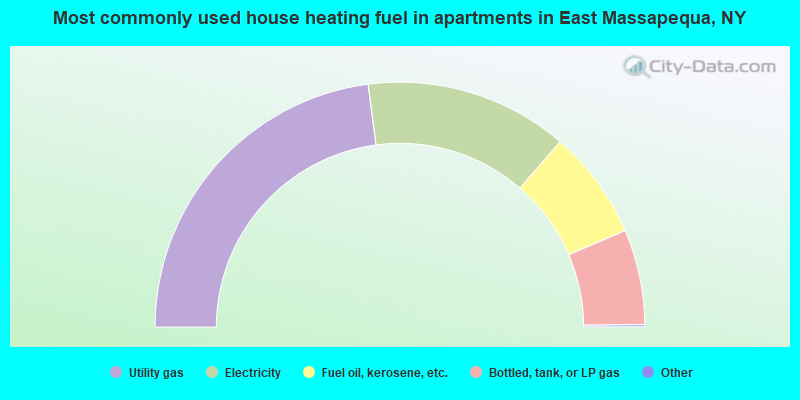
House heating fuel used in apartments - Utility gas (%)
House heating fuel used in apartments - Bottled, tank, or LP gas (%)
House heating fuel used in apartments - Electricity (%)
House heating fuel used in apartments - Fuel oil, kerosene, etc. (%)
House heating fuel used in apartments - Coal or coke (%)
House heating fuel used in apartments - Wood (%)
House heating fuel used in apartments - Solar energy (%)
House heating fuel used in apartments - Other fuel (%)
House heating fuel used in apartments - No fuel used (%)
Median year house/condo built: 1959Median year apartment built: 1973Household type by relationship:
Households: 19,431
Male householders: 3,345 (646 living alone ), Female householders: 3,686 (1,013 living alone )4,185 spouses (4,180 opposite-sex spouses ), 220 unmarried partners , (200 opposite-sex unmarried partners ), 5,968 children (5,662 natural , 91 adopted , 214 stepchildren ), 372 grandchildren , 251 brothers or sisters , 292 parents , 0 foster children , 718 other relatives , 192 non-relatives In group quarters: 198
Size of family households: 2,154 2-persons , 1,082 3-persons , 1,168 4-persons , 628 5-persons , 89 6-persons , 96 7-or-more-persons .
Size of nonfamily households: 1,730 1-person , 120 2-persons , 30 3-persons , 10 4-persons .
2,725 married couples with children. single-parent households (43 men , 268 women ).
87.2% of residents of East Massapequa speak English at home. of residents speak Spanish at home (75% speak English very well , 20% speak English well , 6% speak English not well ).of residents speak other Indo-European language at home (78% speak English very well , 14% speak English well , 8% speak English not well ).of residents speak Asian or Pacific Island language at home (100% speak English very well ).of residents speak other language at home (82% speak English very well , 18% speak English not well ).
Foreign born population: 2,069 (10.6%)of them are naturalized citizens )
Median number of rooms in houses and condos:
Median number of rooms in apartments
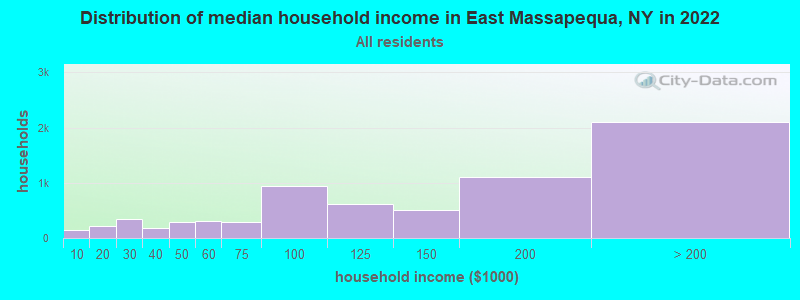
East Massapequa, NY household income distribution 142 Less than $10,000220 $10,000 to $19,999353 $20,000 to $29,999185 $30,000 to $39,999292 $40,000 to $49,999302 $50,000 to $59,999293 $60,000 to $74,999936 $75,000 to $99,999621 $100,000 to $124,999507 $125,000 to $149,9991,112 $150,000 to $199,9992,100 $200,000 or more
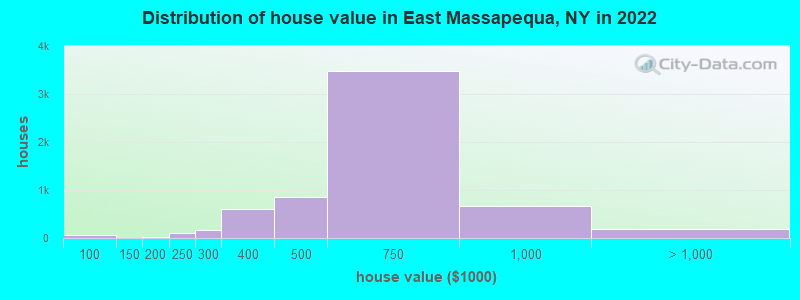
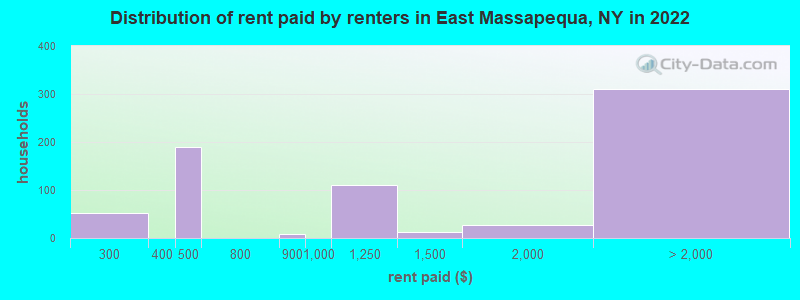
Home value of owner - occupied houses in 2022 in East Massapequa, NY 11 $35,000 to $39,99939 $60,000 to $69,99914 $70,000 to $79,9992 $125,000 to $149,99914 $175,000 to $199,99996 $200,000 to $249,999173 $250,000 to $299,999599 $300,000 to $399,999850 $400,000 to $499,9993,482 $500,000 to $749,999667 $750,000 to $999,999132 $1,000,000 to $1,499,99936 $1,500,000 to $1,999,99922 $2,000,000 or moreRent paid by renters in 2022 in East Massapequa, NY 53 $250 to $299168 $400 to $44920 $450 to $4998 $800 to $899110 $1,000 to $1,24911 $1,250 to $1,49926 $1,500 to $1,999145 $2,000 to $2,49992 $2,500 to $2,99940 $3,000 to $3,4999 $3,500 or more22 No cash rent
Percentage of workers working in this county: 57.1%Number of people working at home: 1,173 (11.9% of all workers )
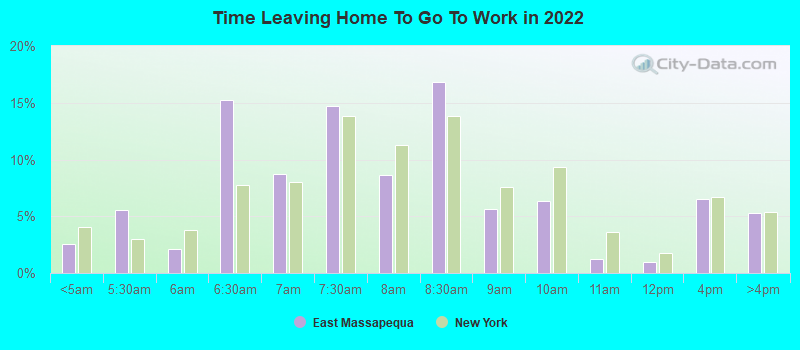
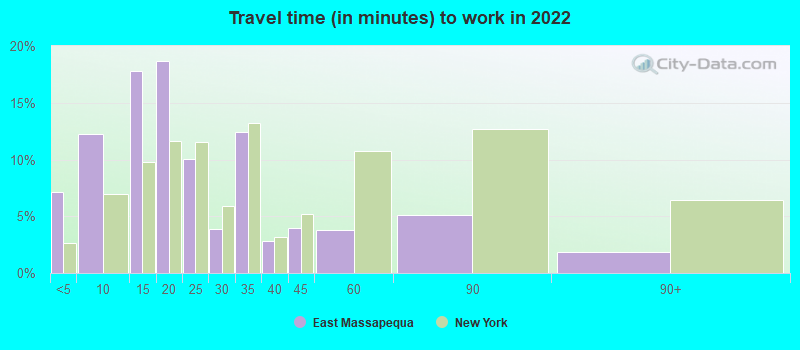
Travel time to work (commute)
Less than 5 minutes: 2695 to 9 minutes: 54710 to 14 minutes: 45615 to 19 minutes: 72120 to 24 minutes: 86825 to 29 minutes: 59730 to 34 minutes: 1,35935 to 39 minutes: 31440 to 44 minutes: 43445 to 59 minutes: 85360 to 89 minutes: 1,47990 or more minutes: 748
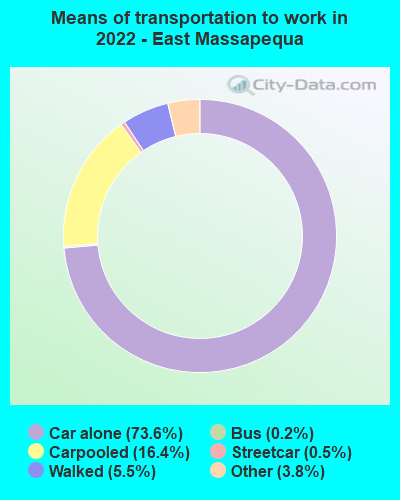
Means of transportation to work:
Drove a car alone: 2,801 (56.8%)Carpooled: 604 (12.2%)Bus : 8 (0.2%)Subway or elevated rail : 16 (0.3%)Taxi: 208 (4.2%)Walked: 225 (4.6%)Worked at home: 1,173 (23.8%)
Unemployment by race in 2022
Unemployment rate for White non-Hispanic residents 4.5% Males2.5% FemalesUnemployment rate for Black residents 10.1% FemalesUnemployment rate for other race residents 7.1% MalesUnemployment rate for two or more race residents 6.2% Males1.7% FemalesUnemployment rate for Hispanic or Latino residents 7.0% Males2.0% Females
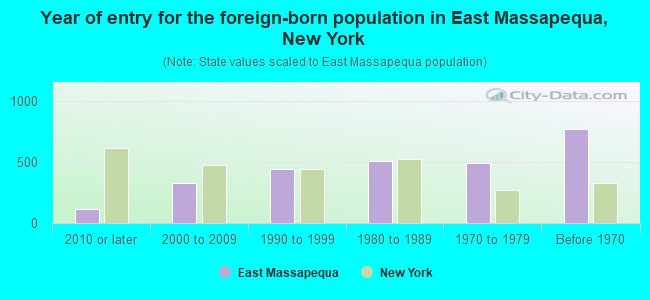
Year of entry for the foreign-born population in East Massapequa, New York
112 2010 or later 332 2000 to 2009 445 1990 to 1999 512 1980 to 1989 495 1970 to 1979 772 Before 1970
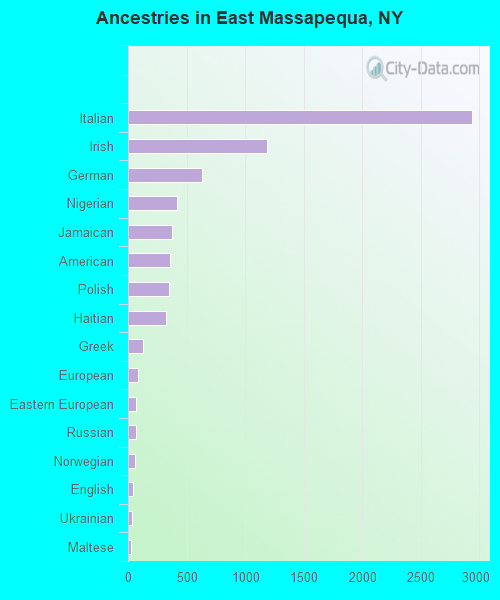
First ancestries reported:
Italian: 2,937 (31.6%)
Irish: 1,186 (12.8%)
German: 636 (6.9%)
Nigerian: 422 (4.5%)
Jamaican: 373 (4.0%)
American: 359 (3.9%)
Polish: 347 (3.7%)
Haitian: 328 (3.5%)
Greek: 128 (1.4%)
European: 87 (0.9%)
Eastern European: 70 (0.8%)
Russian: 65 (0.7%)
Norwegian: 60 (0.6%)
English: 40 (0.4%)
Ukrainian: 37 (0.4%)
Maltese: 28 (0.3%)
Romanian: 26 (0.3%)
Scottish: 23 (0.2%)
West Indian: 23 (0.2%)
Lebanese: 21 (0.2%)
Hungarian: 20 (0.2%)
Iranian: 16 (0.2%)
Armenian: 14 (0.2%)
Czechoslovakian: 14 (0.2%)
Israeli: 12 (0.1%)
French Canadian: 10 (0.1%)
Yugoslavian: 7 (0.08%)
Dutch: 6 (0.06%)
French: 6 (0.06%)
Luxembourger: 6 (0.06%)
Austrian: 5 (0.05%)
Croatian: 5 (0.05%) Most common places of birth for foreign-born residents (%): Jamaica East Massapequa:
15.6% (313)New York:
5.0% (227,557)
Haiti East Massapequa:
9.4% (188)New York:
2.8% (126,936)
Trinidad and Tobago East Massapequa:
9.1% (182)New York:
2.0% (91,428)
Guyana East Massapequa:
7.9% (159)New York:
3.8% (172,129)
Poland East Massapequa:
5.3% (106)New York:
1.4% (65,102)
Guatemala East Massapequa:
5.2% (105)New York:
1.4% (61,245)
Dominican Republic East Massapequa:
5.1% (103)New York:
11.1% (501,040)
Nigeria East Massapequa:
4.7% (94)New York:
0.7% (33,746)
Ecuador East Massapequa:
3.3% (66)New York:
3.9% (177,448)
Israel East Massapequa:
3.2% (65)New York:
0.7% (29,743)
Ireland East Massapequa:
2.7% (54)New York:
0.6% (26,772)
Other Eastern Europe East Massapequa:
2.7% (54)New York:
0.7% (30,173)
Italy East Massapequa:
2.4% (49)New York:
1.8% (81,374)
Venezuela East Massapequa:
2.3% (46)New York:
0.4% (19,652)
El Salvador East Massapequa:
1.9% (39)New York:
2.4% (108,067)
Place of birth for U.S.-born residents:
This state: 15,963Other state: 1,139Northeast: 383Midwest: 102South: 466West: 181 92.2% of East Massapequa residents lived in the same house 1 years ago.
Out of people who lived in different houses, 40.0% lived in this county.
Out of people who lived in different counties, 62.2% lived in New York.
East Massapequa:
92.2%State average:
89.6%
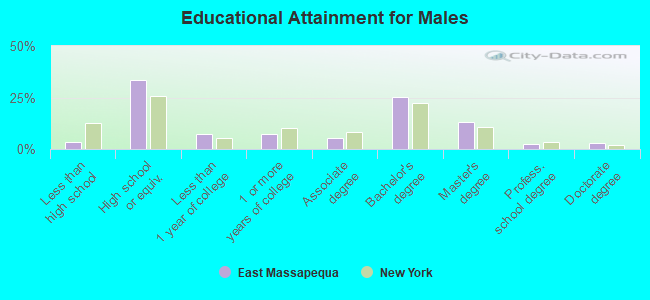
Education attainment for males 25 years and older:
No schooling: 85Nursery to 4th grade: 05th and 6th grade: 07th and 8th grade: 219th grade: 010th grade: 011th grade: 6112th grade, no diploma: 65High school graduate (or equivalency): 2,430Less than 1 year of college: 515Some college more than 1 year, no degree: 534Associate degree: 385Bachelor's degree: 1,847Master's degree: 944Professional school degree: 184Doctorate degree: 208
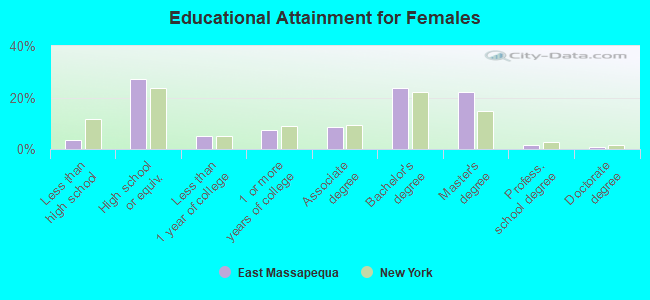
Education attainment for females 25 years and older:
No schooling: 167Nursery to 4th grade: 395th and 6th grade: 07th and 8th grade: 09th grade: 010th grade: 2311th grade: 012th grade, no diploma: 39High school graduate (or equivalency): 1,985Less than 1 year of college: 368Some college more than 1 year, no degree: 540Associate degree: 636Bachelor's degree: 1,724Master's degree: 1,619Professional school degree: 101Doctorate degree: 45
Housing units in structures:
One, detached: 5,981One, attached: 386Two: 2313 or 4: 815 to 9: 25010 to 19: 19920 to 49: 5150 or more: 56Mobile homes: 23Housing units lacking complete kitchen facilities in 2022: 1.4%House/condo owner moved in on average 16 years ago
Renter moved in on average 1 years ago
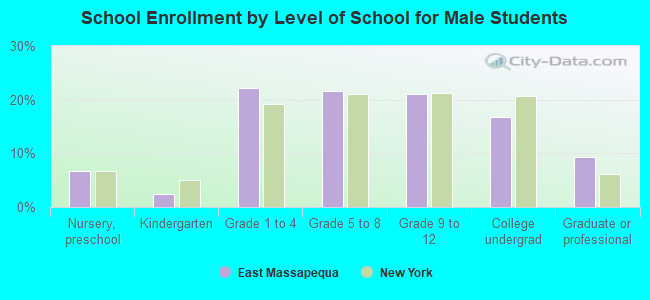
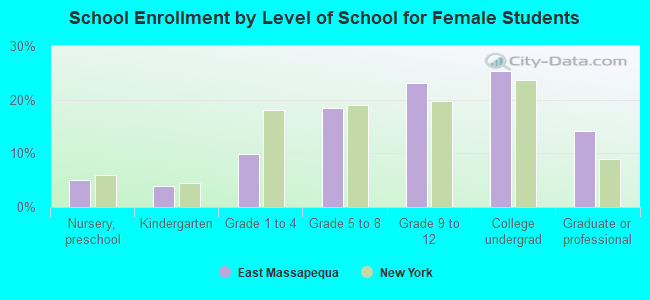
Private vs. public school enrollment:
Students in private schools in grades 1 to 8 (elementary and middle school): 263 Students in private schools in grades 9 to 12 (high school): 177 Students in private undergraduate colleges: 419