East Norwich, NY (New York) Houses and Residents
| East Norwich: | $770,895 |
| New York: | $400,400 |
Mean price in 2022:
Detached houses: $884,443
Here: $884,443 State: $476,719
Total population: 2,709 (Urban population: 2,675, Rural population: 0)
Houses: 975 (956 occupied: 924 owner occupied, 30 renter occupied)
| % of renters here: | 3% |
| State: | 46% |
Housing density: 931 houses/condos per square mile
Median price asked for vacant for-sale houses and condos in 2022 in this county: $728,543.
Median contract rent in 2022: over $2,000 (lower quartile is $1,769, upper quartile is over $2,000)
Median gross rent in East Norwich, NY in 2022: over $2,000
Housing units in East Norwich with a mortgage: 602 (58 second mortgage, 0 home equity loan, 46 both second mortgage and home equity loan)
Houses without a mortgage: 32
Median household income for houses/condos with a mortgage: $247,725
Median household income for apartments without a mortgage: $116,345
Median monthly housing costs: $3,049
Compare current foreclosures near East Norwich, NY:
| Photo | Address | Area | Beds / Baths | Price | Details |
|---|---|---|---|---|---|

|
#1
Pen Mor Dr
East Norwich, NY 11732
|
6,775 sq. feet
|
6 baths - beds |
show details | |

|
#2
Pine Hollow Rd Apt 6
East Norwich, NY 11732
|
- sq. feet
|
- baths - beds |
show details | |

|
#3
E Marshall St
Hempstead, NY 11550
|
1,210 sq. feet
|
2 baths 4 beds |
$479,900
|
show details |

|
#4
Ruxton St
Uniondale, NY 11553
|
1,176 sq. feet
|
1 baths 3 beds |
$450,000
|
show details |

|
#5
Oceanside Pkwy
Oceanside, NY 11572
|
1,650 sq. feet
|
2 baths 2 beds |
$545,000
|
show details |

|
#6
Francis Lewis Blvd
Queens Village, NY 11429
|
844 sq. feet
|
1 baths 2 beds |
$589,900
|
show details |

|
#7
17th Ave 1st Floor
Whitestone, NY 11357
|
610 sq. feet
|
1 baths 1 beds |
$229,900
|
show details |

|
#8
Belmont Pkwy
Hempstead, NY 11550
|
1,348 sq. feet
|
1 baths 3 beds |
$659,900
|
show details |

|
#9
Timber Ridge Dr
Commack, NY 11725
|
2,564 sq. feet
|
2 baths 4 beds |
$884,000
|
show details |

|
#10
Sylvan Knoll Rd
Stamford, CT 06902
|
1,100 sq. feet
|
1 baths 2 beds |
$339,900
|
show details |
| Photo | Address | Area | Beds / Baths | Price | Details |
|---|---|---|---|---|---|

|
#11
177th St
Jamaica, NY 11433
|
1,156 sq. feet
|
1 baths 3 beds |
$450,000
|
show details |

|
#12
Edcris Ln
Huntington, NY 11743
|
1,450 sq. feet
|
2 baths 3 beds |
$550,000
|
show details |

|
#13
Limerick St
Stamford, CT 06902
|
1,382 sq. feet
|
4 baths 5 beds |
$919,900
|
show details |

|
#14
Jillit Dr
Smithtown, NY 11787
|
1,480 sq. feet
|
1 baths 3 beds |
$775,000
|
show details |

|
#15
Fairway Rd
Oceanside, NY 11572
|
2,250 sq. feet
|
2 baths 3 beds |
$509,900
|
show details |

|
#16
Franklin St
Elmont, NY 11003
|
1,116 sq. feet
|
2 baths 2 beds |
$679,900
|
show details |

|
#17
Ford Dr N
Massapequa, NY 11758
|
2,000 sq. feet
|
2 baths 5 beds |
$799,900
|
show details |

|
#18
Riverdale Ave
Port Chester, NY 10573
|
1,616 sq. feet
|
1 baths 3 beds |
$639,900
|
show details |

|
#19
Davenport Ave Apt 1b
New Rochelle, NY 10805
|
750 sq. feet
|
1 baths 1 beds |
$159,900
|
show details |

|
#20
72nd Avenue
Bellerose, NY 11426
|
850 sq. feet
|
1 baths 1 beds |
$259,900
|
show details |
| Photo | Address | Area | Beds / Baths | Price | Details |
|---|---|---|---|---|---|

|
#21
6th Ave Apt A
Huntington Station, NY 11746
|
3,300 sq. feet
|
4 baths 7 beds |
$999,900
|
show details |

|
#22
Dartmouth St
Westbury, NY 11590
|
1,772 sq. feet
|
1 baths 4 beds |
$499,200
|
show details |

|
#23
Harbor Rd
Hewlett, NY 11557
|
4,549 sq. feet
|
4 baths 5 beds |
$1,155,000
|
show details |

|
#24
W Sidney Ave
Mount Vernon, NY 10550
|
2,800 sq. feet
|
3 baths 8 beds |
$454,900
|
show details |

|
#25
Bellport Ave
Wantagh, NY 11793
|
1,785 sq. feet
|
3 baths 5 beds |
$700,000
|
show details |

|
#26
Evans Ave
Elmont, NY 11003
|
1,352 sq. feet
|
2 baths 3 beds |
$699,900
|
show details |

|
#27
Fox Island Rd
Port Chester, NY 10573
|
- sq. feet
|
6 baths 6 beds |
$910,000
|
show details |

|
#28
Merle Ave
Oceanside, NY 11572
|
885 sq. feet
|
1 baths 2 beds |
$450,000
|
show details |

|
#29
Tulip Ave # Gl2
Floral Park, NY 11001
|
1,200 sq. feet
|
1 baths 2 beds |
$409,900
|
show details |

|
#30
Sandy Hill Rd
Oyster Bay, NY 11771
|
9,672 sq. feet
|
6 baths 9 beds |
$1,394,900
|
show details |
| Photo | Address | Area | Beds / Baths | Price | Details |
|---|---|---|---|---|---|

|
#31
Swinton Ave
Bronx, NY 10465
|
1,938 sq. feet
|
2 baths 3 beds |
$789,900
|
show details |

|
#32
3rd St
Brentwood, NY 11717
|
- sq. feet
|
1 baths 3 beds |
$379,980
|
show details |

|
#33
Lincoln Blvd
Bay Shore, NY 11706
|
- sq. feet
|
2 baths 3 beds |
$490,000
|
show details |

|
#34
11th Ave
Huntington Station, NY 11746
|
- sq. feet
|
2 baths 4 beds |
$399,000
|
show details |

|
#35
Hayfield Ct
Commack, NY 11725
|
- sq. feet
|
1 baths 3 beds |
$603,250
|
show details |

|
#36
Buena Vista Blvd
Lindenhurst, NY 11757
|
- sq. feet
|
2 baths 4 beds |
$441,750
|
show details |

|
#37
203rd St
Saint Albans, NY 11412
|
- sq. feet
|
1 baths 4 beds |
$421,000
|
show details |

|
#38
Tuttle St
Stamford, CT 06902
|
- sq. feet
|
1 baths 3 beds |
$262,500
|
show details |

|
#39
16 Johnson Ave
Elmont, NY 11003
|
- sq. feet
|
2 baths 3 beds |
$569,900
|
show details |

|
#40
Wall St
Farmingdale, NY 11735
|
- sq. feet
|
1 baths 3 beds |
$442,000
|
show details |
| Photo | Address | Area | Beds / Baths | Price | Details |
|---|---|---|---|---|---|

|
#41
Brentwood Pkwy
Brentwood, NY 11717
|
- sq. feet
|
4 baths 5 beds |
$468,000
|
show details |

|
#42
Monroe Ave
Brentwood, NY 11717
|
- sq. feet
|
2 baths 3 beds |
$389,900
|
show details |

|
#43
Washington Ave
New Rochelle, NY 10801
|
2,445 sq. feet
|
3 baths 8 beds |
show details | |

|
#44
Frederick Ave
Floral Park, NY 11001
|
2,785 sq. feet
|
3 baths 5 beds |
show details | |

|
#45
Lafayette St
Copiague, NY 11726
|
1,628 sq. feet
|
2 baths 5 beds |
show details | |

|
#46
Rosedale Rd
Valley Stream, NY 11581
|
2,814 sq. feet
|
2 baths 4 beds |
show details | |

|
#47
Pinebrook Ct
West Hempstead, NY 11552
|
1,560 sq. feet
|
1 baths 5 beds |
show details | |

|
#48
Madison Ave
Bellmore, NY 11710
|
2,764 sq. feet
|
3 baths 6 beds |
show details | |

|
#49
N 7th St
Lindenhurst, NY 11757
|
1,971 sq. feet
|
3 baths 5 beds |
show details | |

|
Check over 1 million property listings on Foreclosure.com!
|
browse all offers | |||


 | Up to $850K in Nassau.... (263 replies) |
| Searching for homes in LI (51 replies) |
| Oyster Bay SD and Illegal Housing (7 replies) |
| Looking for Apartments on Long Island (21 replies) |
| Which area has excellent school with affordable house price and property tax? (25 replies) |
| Steakhouse in Suffolk - Suggestions? (41 replies) |

Median year apartment built: 1956
Household type by relationship:
Households: 2,817- Male householders: 490 (50 living alone), Female householders: 458 (128 living alone)
690 spouses (690 opposite-sex spouses), 137 unmarried partners, (137 opposite-sex unmarried partners), 894 children (816 natural, 36 adopted, 40 stepchildren), 10 grandchildren, 8 brothers or sisters, 29 parents, 28 foster children, 18 other relatives, 23 non-relatives
- In group quarters: 25
Size of family households: 244 2-persons, 155 3-persons, 237 4-persons, 85 5-persons, 3 6-persons, 5 7-or-more-persons.
Size of nonfamily households: 186 1-person, 25 2-persons, 10 3-persons.
671 married couples with children.
0 single-parent households (0 men, 0 women).
87.2% of residents of East Norwich speak English at home.
6.9% of residents speak Spanish at home (82% speak English very well, 17% speak English well, 1% speak English not well).
3.4% of residents speak other Indo-European language at home (95% speak English very well, 5% speak English well).
0.9% of residents speak Asian or Pacific Island language at home (71% speak English very well, 29% speak English not well).
0.4% of residents speak other language at home (100% speak English very well).
Foreign born population: 150 (5.3%)
(58.7% of them are naturalized citizens)
| Here: | 7.3 |
| State: | 6.3 |
| Here: | 5.9 |
| State: | 3.8 |

- Bedrooms in owner-occupied houses and condos in East Norwich, New York
- 18no bedroom
- 01 bedroom
- 322 bedrooms
- 3443 bedrooms
- 3674 bedrooms
- 1635+ bedrooms

- Bedrooms in renter-occupied apartments in East Norwich, New York
- 0no bedroom
- 01 bedroom
- 92 bedrooms
- 213 bedrooms
- 04 bedrooms
- 05+ bedrooms

- Cars and other vehicles available in East Norwich in owner-occupied houses/condos
- 23no vehicle
- 1941 vehicle
- 3842 vehicles
- 2033 vehicles
- 1154 vehicles
- 65+ vehicles

- Cars and other vehicles available in East Norwich in renter-occupied apartments
- 0no vehicle
- 141 vehicle
- 112 vehicles
- 53 vehicles
- 04 vehicles
- 05+ vehicles

- Rooms in owner-occupied houses in East Norwich, New York
- 181 room
- 02 rooms
- 03 rooms
- 04 rooms
- 365 rooms
- 1756 rooms
- 2687 rooms
- 2708 rooms
- 1589+ rooms

- Rooms in renter-occupied apartments in East Norwich, New York
- 01 room
- 02 rooms
- 03 rooms
- 04 rooms
- 55 rooms
- 206 rooms
- 07 rooms
- 58 rooms
- 09+ rooms


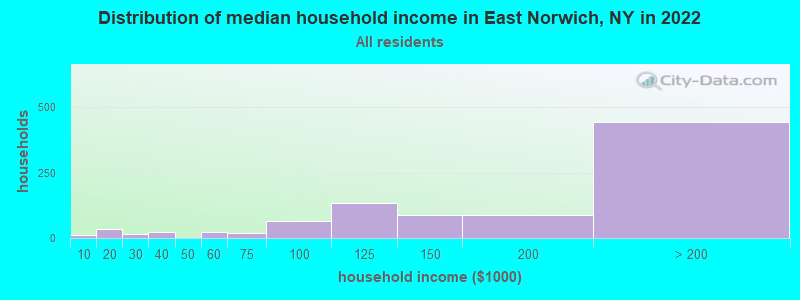
East Norwich, NY household income distribution

- 13Less than $10,000
- 35$10,000 to $19,999
- 16$20,000 to $29,999
- 24$30,000 to $39,999
- 23$50,000 to $59,999
- 20$60,000 to $74,999
- 64$75,000 to $99,999
- 134$100,000 to $124,999
- 89$125,000 to $149,999
- 87$150,000 to $199,999
- 444$200,000 or more
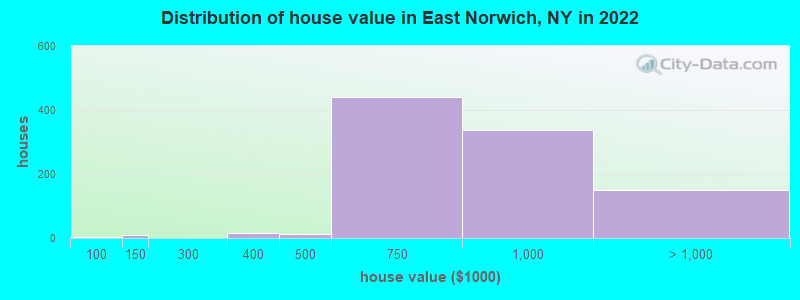
Home value of owner - occupied houses in 2022 in East Norwich, NY
-
- 4$80,000 to $89,999
- 9$100,000 to $124,999
- 15$300,000 to $399,999
- 11$400,000 to $499,999
- 439$500,000 to $749,999
- 339$750,000 to $999,999
- 125$1,000,000 to $1,499,999
- 13$1,500,000 to $1,999,999
- 11$2,000,000 or more
Rent paid by renters in 2022 in East Norwich, NY
-
- 9$1,500 to $1,999
- 3$2,000 to $2,499
- 6$2,500 to $2,999
- 9$3,000 to $3,499


Percentage of workers working in this county: 60.4%
Number of people working at home: 232 (15.9% of all workers)
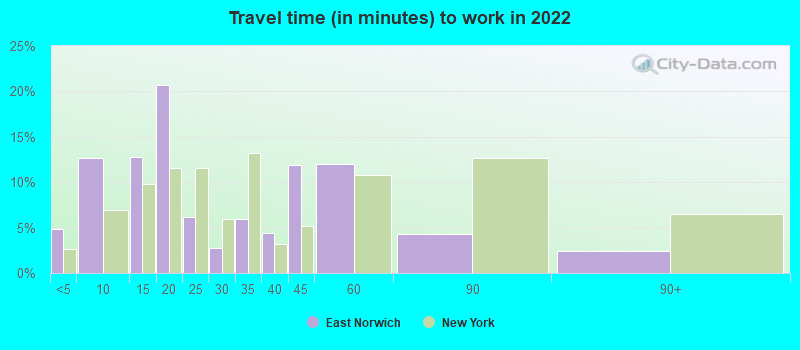
Travel time to work (commute)
- Less than 5 minutes: 53
- 5 to 9 minutes: 43
- 10 to 14 minutes: 153
- 15 to 19 minutes: 137
- 20 to 24 minutes: 47
- 25 to 29 minutes: 109
- 30 to 34 minutes: 213
- 35 to 39 minutes: 16
- 40 to 44 minutes: 15
- 45 to 59 minutes: 120
- 60 to 89 minutes: 197
- 90 or more minutes: 134
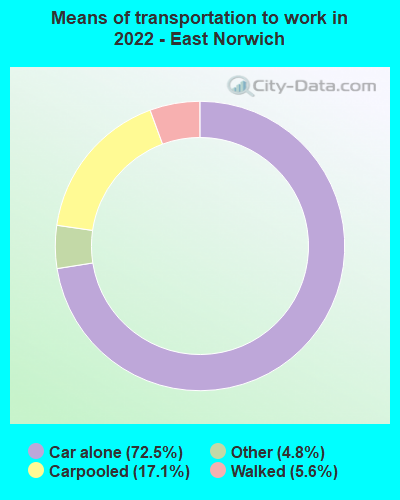
Means of transportation to work:
- Drove a car alone: 522 (55.4%)
- Carpooled: 119 (12.6%)
- Taxi: 50 (5.3%)
- Walked: 43 (4.6%)
- Worked at home: 232 (24.6%)

- Unemployment by race in 2022
- Unemployment rate for White non-Hispanic residents
- 2.4%Males
- 1.9%Females

- Year of entry for the foreign-born population in East Norwich, New York
- 582010 or later
- 92000 to 2009
- 101990 to 1999
- 741980 to 1989
- 541970 to 1979
- 96Before 1970

First ancestries reported:
- Italian: 518 (41.4%)
- Irish: 93 (7.4%)
- American: 87 (6.9%)
- German: 59 (4.7%)
- Greek: 56 (4.5%)
- Polish: 44 (3.5%)
- English: 32 (2.6%)
- Eastern European: 29 (2.3%)
- Austrian: 20 (1.6%)
- Russian: 14 (1.1%)
- Scotch-Irish: 8 (0.6%)
- Albanian: 7 (0.6%)
- Czech: 7 (0.6%)
- British: 6 (0.5%)
- Croatian: 6 (0.5%)
- European: 5 (0.4%)
- Czechoslovakian: 2 (0.2%)
Most common places of birth for foreign-born residents (%):
| East Norwich: | 38.6% (56) |
| New York: | 11.1% (501,040) |
| East Norwich: | 9.7% (14) |
| New York: | 0.9% (38,713) |
| East Norwich: | 9.0% (13) |
| New York: | 2.5% (111,920) |
| East Norwich: | 8.3% (12) |
| New York: | 2.8% (126,936) |
| East Norwich: | 5.5% (8) |
| New York: | 0.6% (28,604) |
| East Norwich: | 4.8% (7) |
| New York: | 0.6% (25,362) |
| East Norwich: | 4.1% (6) |
| New York: | 0.7% (29,743) |
| East Norwich: | 3.4% (5) |
| New York: | 1.8% (81,374) |
| East Norwich: | 3.4% (5) |
| New York: | 0.9% (42,220) |
| East Norwich: | 2.8% (4) |
| New York: | 0.3% (12,762) |
| East Norwich: | 2.8% (4) |
| New York: | 0.5% (23,242) |
Place of birth for U.S.-born residents:
- This state: 2,332
- Other state: 301
- Northeast: 180
- Midwest: 14
- South: 50
- West: 50
90.6% of East Norwich residents lived in the same house 1 years ago.
Out of people who lived in different houses, 35.1% lived in this county.
Out of people who lived in different counties, 66.7% lived in New York.
| East Norwich: | 90.6% |
| State average: | 89.6% |
Education attainment for males 25 years and older:
- No schooling: 10
- Nursery to 4th grade: 0
- 5th and 6th grade: 0
- 7th and 8th grade: 0
- 9th grade: 0
- 10th grade: 0
- 11th grade: 6
- 12th grade, no diploma: 0
- High school graduate (or equivalency): 95
- Less than 1 year of college: 87
- Some college more than 1 year, no degree: 55
- Associate degree: 29
- Bachelor's degree: 284
- Master's degree: 204
- Professional school degree: 118
- Doctorate degree: 0

Education attainment for females 25 years and older:
- No schooling: 17
- Nursery to 4th grade: 0
- 5th and 6th grade: 0
- 7th and 8th grade: 0
- 9th grade: 0
- 10th grade: 0
- 11th grade: 0
- 12th grade, no diploma: 0
- High school graduate (or equivalency): 214
- Less than 1 year of college: 45
- Some college more than 1 year, no degree: 61
- Associate degree: 52
- Bachelor's degree: 425
- Master's degree: 192
- Professional school degree: 45
- Doctorate degree: 48


Housing units in structures:
- One, detached: 946
- Two: 21
- Mobile homes: 8
House/condo owner moved in on average 16 years ago
Renter moved in on average 1 years ago

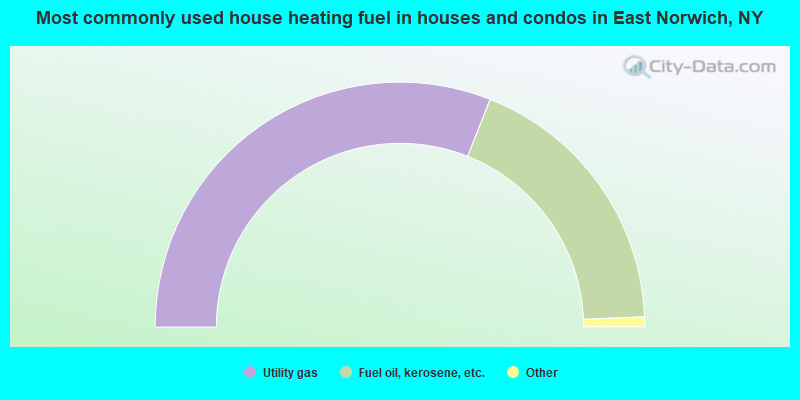
- 62.1%Utility gas
- 36.7%Fuel oil, kerosene, etc.
- 0.7%Other fuel
- 0.5%Bottled, tank, or LP gas
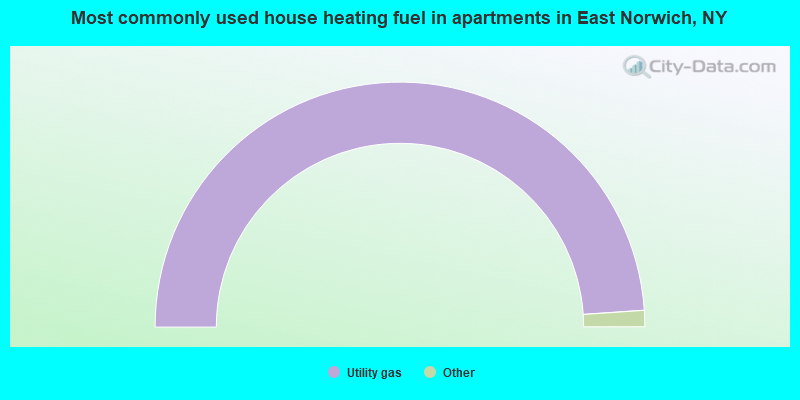
- 100.0%Utility gas
Private vs. public school enrollment:
| Here: | 10.2% |
| New York: | 15.6% |
| Here: | 5.4% |
| New York: | 15.0% |
| Here: | 43.6% |
| New York: | 39.2% |


