East Pittsburgh, PA (Pennsylvania) Houses and Residents
| East Pittsburgh: | $70,984 |
| Pennsylvania: | $245,500 |
Total population: 1,804 (All urban)
Houses: 1,053 (813 occupied: 230 owner occupied, 568 renter occupied)
| % of renters here: | 71% |
| State: | 31% |
Housing density: 2,696 houses/condos per square mile
Median price asked for vacant for-sale houses and condos in 2022: $90,731.
Median contract rent in 2022: $587 (lower quartile is $429, upper quartile is $724)
Median rent asked for vacant for-rent units in 2022: $763
Median gross rent in East Pittsburgh, PA in 2022: $810
Housing units in East Pittsburgh with a mortgage: 53 (0 second mortgage, 0 home equity loan, 0 both second mortgage and home equity loan)
Houses without a mortgage: 0
Median household income for houses/condos with a mortgage: $63,379
Median household income for apartments without a mortgage: $67,192
Median monthly housing costs: $679
Compare current foreclosures near East Pittsburgh, PA:
| Photo | Address | Area | Beds / Baths | Price | Details |
|---|---|---|---|---|---|

|
#1
Franklin St
East Pittsburgh, PA 15112
|
1,826 sq. feet
|
1 baths 3 beds |
show details | |

|
#2
Ridge Ave
East Pittsburgh, PA 15112
|
1,320 sq. feet
|
1 baths 3 beds |
show details | |

|
#3
Punta Gorda St
East Mc Keesport, PA 15035
|
1,200 sq. feet
|
1 baths 3 beds |
$171,500
|
show details |

|
#4
Semicir St
Pittsburgh, PA 15214
|
537 sq. feet
|
1 baths 1 beds |
$21,000
|
show details |

|
#5
Leslie St
East Mc Keesport, PA 15035
|
1,144 sq. feet
|
1 baths 2 beds |
$64,900
|
show details |

|
#6
Collins St
Mckeesport, PA 15132
|
1,176 sq. feet
|
1 baths 3 beds |
$43,700
|
show details |

|
#7
9th Ave
Elizabeth, PA 15037
|
1,554 sq. feet
|
1 baths 3 beds |
$180,000
|
show details |

|
#8
Triana St
Pittsburgh, PA 15210
|
1,184 sq. feet
|
1 baths 3 beds |
$157,500
|
show details |

|
#9
Venetia Rd
Venetia, PA 15367
|
1,098 sq. feet
|
2 baths 3 beds |
$236,500
|
show details |

|
#10
Muirfield Dr
Presto, PA 15142
|
4,801 sq. feet
|
4 baths 5 beds |
$709,500
|
show details |
| Photo | Address | Area | Beds / Baths | Price | Details |
|---|---|---|---|---|---|

|
#11
S 4th St
West Newton, PA 15089
|
1,850 sq. feet
|
1 baths 4 beds |
$197,900
|
show details |

|
#12
Pittsburgh St
West Newton, PA 15089
|
1,193 sq. feet
|
1 baths 3 beds |
$187,500
|
show details |

|
#13
Brinwood Ave
Pittsburgh, PA 15227
|
1,000 sq. feet
|
2 baths 3 beds |
$229,900
|
show details |

|
#14
Grant St
Carnegie, PA 15106
|
1,345 sq. feet
|
2 baths 4 beds |
$225,500
|
show details |

|
#15
Kirk Ave
Pittsburgh, PA 15227
|
1,500 sq. feet
|
2 baths 3 beds |
$197,500
|
show details |

|
#16
Dorothy Dr
Pittsburgh, PA 15235
|
956 sq. feet
|
1 baths 3 beds |
$66,500
|
show details |

|
#17
Madison Ave
East Pittsburgh, PA 15112
|
- sq. feet
|
- baths - beds |
show details | |

|
#18
Adams Ave
West Mifflin, PA 15122
|
3,106 sq. feet
|
4 baths 5 beds |
show details | |

|
#19
Catherine St
Mc Kees Rocks, PA 15136
|
2,688 sq. feet
|
2 baths 4 beds |
show details | |

|
#20
Vesper St
Bridgeville, PA 15017
|
936 sq. feet
|
1 baths 3 beds |
show details |
| Photo | Address | Area | Beds / Baths | Price | Details |
|---|---|---|---|---|---|

|
#21
Arizona Dr
Allison Park, PA 15101
|
1,191 sq. feet
|
1 baths 3 beds |
show details | |

|
#22
Progress St
Mc Kees Rocks, PA 15136
|
1,477 sq. feet
|
2 baths 3 beds |
show details | |

|
#23
Chartiers Ave
Pittsburgh, PA 15204
|
1,531 sq. feet
|
1 baths 4 beds |
show details | |

|
#24
Oakleaf Rd
Pittsburgh, PA 15227
|
1,163 sq. feet
|
1 baths 3 beds |
show details | |

|
#25
Fawcett Ave
Mckeesport, PA 15131
|
2,339 sq. feet
|
2 baths 4 beds |
show details | |

|
#26
Dublin Rd
Bethel Park, PA 15102
|
1,184 sq. feet
|
1 baths 3 beds |
show details | |

|
#27
Good Ln
Pittsburgh, PA 15237
|
1,517 sq. feet
|
1 baths 3 beds |
show details | |

|
#28
Willow Dr
Monroeville, PA 15146
|
1,536 sq. feet
|
1 baths 3 beds |
show details | |

|
#29
Grover St
Mckeesport, PA 15132
|
1,661 sq. feet
|
1 baths 3 beds |
show details | |

|
#30
Oak Ave
Elizabeth, PA 15037
|
936 sq. feet
|
1 baths 3 beds |
show details |
| Photo | Address | Area | Beds / Baths | Price | Details |
|---|---|---|---|---|---|

|
#31
Davis Ave
Pittsburgh, PA 15202
|
1,260 sq. feet
|
2 baths 3 beds |
show details | |

|
#32
Camarta Dr
Pittsburgh, PA 15227
|
- sq. feet
|
2 baths 4 beds |
show details | |

|
#33
Fort Duquesne Blvd Apt 4a
Pittsburgh, PA 15222
|
1,032 sq. feet
|
1 baths 1 beds |
show details | |

|
#34
Wilson St
Pittsburgh, PA 15223
|
1,681 sq. feet
|
2 baths 3 beds |
show details | |

|
#35
Evanston St
Pittsburgh, PA 15204
|
1,120 sq. feet
|
1 baths 3 beds |
show details | |

|
#36
Sangree Rd
Pittsburgh, PA 15237
|
1,520 sq. feet
|
2 baths 3 beds |
show details | |

|
#37
Virginia Manor Dr
Pittsburgh, PA 15215
|
3,534 sq. feet
|
3 baths 5 beds |
show details | |

|
#38
Ellsworth Ave
Elizabeth, PA 15037
|
1,720 sq. feet
|
1 baths 3 beds |
show details | |

|
#39
Wayne Ave
Mc Kees Rocks, PA 15136
|
1,440 sq. feet
|
1 baths 3 beds |
show details | |

|
#40
Washington St
Pittsburgh, PA 15223
|
1,488 sq. feet
|
1 baths 4 beds |
show details |
| Photo | Address | Area | Beds / Baths | Price | Details |
|---|---|---|---|---|---|

|
#41
Stella Dr
Trafford, PA 15085
|
1,448 sq. feet
|
1 baths 3 beds |
show details | |

|
#42
Summit Dr
Verona, PA 15147
|
1,545 sq. feet
|
1 baths 3 beds |
show details | |

|
#43
Leechburg Rd
New Kensington, PA 15068
|
1,212 sq. feet
|
1 baths 3 beds |
show details | |

|
#44
13th St
Mc Kees Rocks, PA 15136
|
1,404 sq. feet
|
1 baths 3 beds |
show details | |

|
#45
Woodward Ave
Mc Kees Rocks, PA 15136
|
1,958 sq. feet
|
2 baths 6 beds |
show details | |

|
#46
Woodward Ave
Mc Kees Rocks, PA 15136
|
1,958 sq. feet
|
2 baths 4 beds |
show details | |

|
#47
Scenery Dr
Elizabeth, PA 15037
|
1,113 sq. feet
|
1 baths 3 beds |
show details | |

|
#48
9th St
Mc Kees Rocks, PA 15136
|
1,380 sq. feet
|
1 baths 2 beds |
show details | |

|
#49
Woodward Ave
Mc Kees Rocks, PA 15136
|
1,266 sq. feet
|
1 baths 2 beds |
show details | |

|
Check over 1 million property listings on Foreclosure.com!
|
browse all offers | |||


 | East Pittsburgh police shoot teen in back (783 replies) |
| Short term fully furnished apartments/house (13 replies) |
| PA races for senate and governor (1200 replies) |
| Editorial: Mayor Gainey needs new team to turn things around (148 replies) |
| Pittsburgh MSA municipal population data (2020) (125 replies) |
| How much house can you get for $50k? (134 replies) |

Median year apartment built: 1967
Household type by relationship:
Households: 1,847- Male householders: 317 (196 living alone), Female householders: 483 (115 living alone)
40 spouses (40 opposite-sex spouses), 25 unmarried partners, (25 opposite-sex unmarried partners), 685 children (666 natural, 0 adopted, 18 stepchildren), 85 grandchildren, 59 brothers or sisters, 47 parents, 26 foster children, 7 other relatives, 59 non-relatives
- In group quarters: 8
Size of family households: 267 2-persons, 112 3-persons, 37 4-persons, 39 5-persons, 7 6-persons.
Size of nonfamily households: 320 1-person, 5 2-persons, 5 3-persons.
0 married couples with children.
415 single-parent households (62 men, 353 women).
94.4% of residents of East Pittsburgh speak English at home.
0.9% of residents speak Spanish at home (100% speak English very well).
3.1% of residents speak other Indo-European language at home (87% speak English very well, 13% speak English well).
0.5% of residents speak other language at home (100% speak English very well).
Foreign born population: 21 (1.1%)
(104.8% of them are naturalized citizens)
| Here: | 5.9 |
| State: | 6.8 |
| Here: | 4.6 |
| State: | 4.3 |

- Bedrooms in owner-occupied houses and condos in East Pittsburgh, Pennsylvania
- 0no bedroom
- 151 bedroom
- 672 bedrooms
- 1293 bedrooms
- 84 bedrooms
- 115+ bedrooms

- Bedrooms in renter-occupied apartments in East Pittsburgh, Pennsylvania
- 17no bedroom
- 1231 bedroom
- 2442 bedrooms
- 1023 bedrooms
- 704 bedrooms
- 135+ bedrooms

- Cars and other vehicles available in East Pittsburgh in owner-occupied houses/condos
- 11no vehicle
- 1221 vehicle
- 492 vehicles
- 473 vehicles
- 04 vehicles
- 05+ vehicles

- Cars and other vehicles available in East Pittsburgh in renter-occupied apartments
- 262no vehicle
- 3071 vehicle
- 02 vehicles
- 03 vehicles
- 04 vehicles
- 05+ vehicles

- Rooms in owner-occupied houses in East Pittsburgh, Pennsylvania
- 01 room
- 02 rooms
- 03 rooms
- 474 rooms
- 335 rooms
- 876 rooms
- 537 rooms
- 58 rooms
- 59+ rooms

- Rooms in renter-occupied apartments in East Pittsburgh, Pennsylvania
- 171 room
- 92 rooms
- 1053 rooms
- 1454 rooms
- 965 rooms
- 1066 rooms
- 797 rooms
- 138 rooms
- 09+ rooms


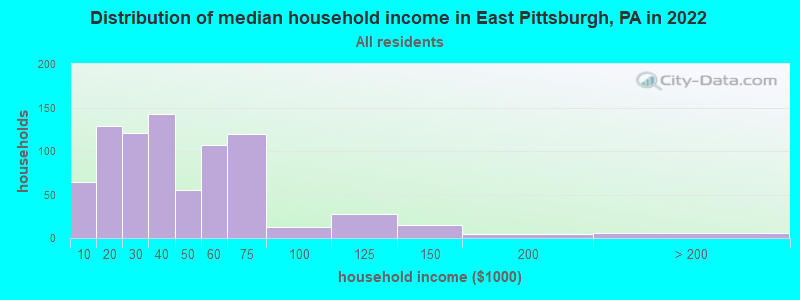
East Pittsburgh, PA household income distribution

- 64Less than $10,000
- 129$10,000 to $19,999
- 121$20,000 to $29,999
- 143$30,000 to $39,999
- 55$40,000 to $49,999
- 107$50,000 to $59,999
- 119$60,000 to $74,999
- 13$75,000 to $99,999
- 28$100,000 to $124,999
- 15$125,000 to $149,999
- 5$150,000 to $199,999
- 6$200,000 or more
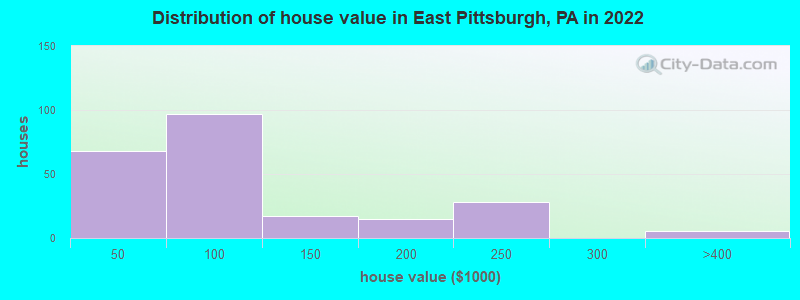
Home value of owner - occupied houses in 2022 in East Pittsburgh, PA
-
- 12$10,000 to $14,999
- 6$15,000 to $19,999
- 14$25,000 to $29,999
- 29$35,000 to $39,999
- 5$40,000 to $49,999
- 22$50,000 to $59,999
- 51$60,000 to $69,999
- 12$70,000 to $79,999
- 4$80,000 to $89,999
- 17$100,000 to $124,999
- 14$150,000 to $174,999
- 28$200,000 to $249,999
- 5$300,000 to $399,999
Rent paid by renters in 2022 in East Pittsburgh, PA
-
- 35$150 to $199
- 30$200 to $249
- 4$250 to $299
- 35$300 to $349
- 20$350 to $399
- 45$400 to $449
- 6$450 to $499
- 86$500 to $549
- 56$550 to $599
- 21$600 to $649
- 56$650 to $699
- 98$700 to $749
- 61$800 to $899
- 4$900 to $999


Percentage of workers working in this county: 90.6%
Number of people working at home: 177 (25.7% of all workers)
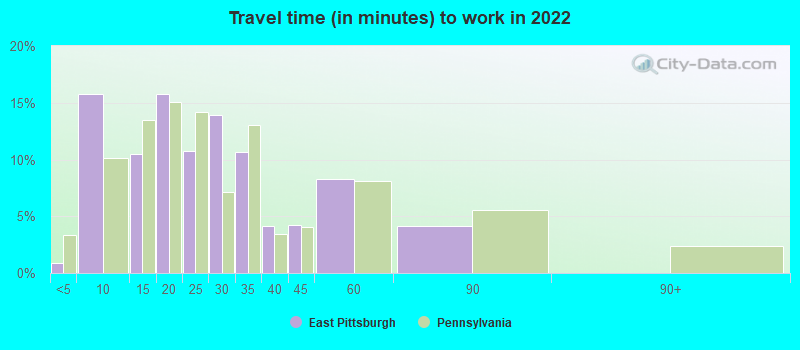
Travel time to work (commute)
- Less than 5 minutes: 6
- 5 to 9 minutes: 42
- 10 to 14 minutes: 123
- 15 to 19 minutes: 102
- 20 to 24 minutes: 84
- 25 to 29 minutes: 10
- 30 to 34 minutes: 116
- 35 to 39 minutes: 0
- 40 to 44 minutes: 13
- 45 to 59 minutes: 13
- 60 to 89 minutes: 12
- 90 or more minutes: 0
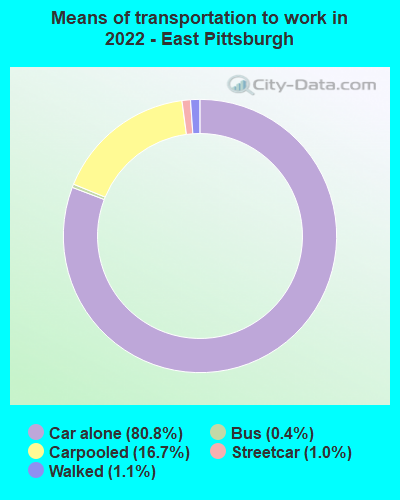
Means of transportation to work:
- Drove a car alone: 413 (62.1%)
- Carpooled: 82 (12.3%)
- Bus: 1 (0.2%)
- Subway or elevated rail: 2 (0.3%)
- Walked: 6 (0.9%)
- Worked at home: 177 (26.6%)

- Unemployment by race in 2022
- Unemployment rate for White non-Hispanic residents
- 11.1%Males
- Unemployment rate for Black residents
- 5.4%Males
- Unemployment rate for two or more race residents
- 51.3%Males

- Year of entry for the foreign-born population in East Pittsburgh, Pennsylvania
- 02010 or later
- 02000 to 2009
- 71990 to 1999
- 31980 to 1989
- 41970 to 1979
- 19Before 1970

First ancestries reported:
- Irish: 97 (12.3%)
- African: 91 (11.5%)
- Polish: 74 (9.4%)
- English: 57 (7.2%)
- Croatian: 44 (5.6%)
- Italian: 37 (4.7%)
- German: 12 (1.5%)
- Slavic: 10 (1.3%)
- Slovak: 7 (0.9%)
Most common places of birth for foreign-born residents (%):
| East Pittsburgh: | 47.8% (11) |
| Pennsylvania: | 1.8% (16,884) |
| East Pittsburgh: | 17.4% (4) |
| Pennsylvania: | 0.1% (645) |
Place of birth for U.S.-born residents:
- This state: 1,623
- Other state: 196
- Northeast: 19
- Midwest: 4
- South: 106
- West: 62
90.4% of East Pittsburgh residents lived in the same house 1 years ago.
Out of people who lived in different houses, 35.7% lived in this county.
Out of people who lived in different counties, 73.0% lived in Pennsylvania.
| East Pittsburgh: | 90.4% |
| State average: | 89.3% |
Education attainment for males 25 years and older:
- No schooling: 17
- Nursery to 4th grade: 0
- 5th and 6th grade: 0
- 7th and 8th grade: 0
- 9th grade: 0
- 10th grade: 0
- 11th grade: 0
- 12th grade, no diploma: 0
- High school graduate (or equivalency): 214
- Less than 1 year of college: 11
- Some college more than 1 year, no degree: 210
- Associate degree: 4
- Bachelor's degree: 50
- Master's degree: 31
- Professional school degree: 0
- Doctorate degree: 0

Education attainment for females 25 years and older:
- No schooling: 0
- Nursery to 4th grade: 0
- 5th and 6th grade: 0
- 7th and 8th grade: 0
- 9th grade: 0
- 10th grade: 0
- 11th grade: 0
- 12th grade, no diploma: 0
- High school graduate (or equivalency): 259
- Less than 1 year of college: 44
- Some college more than 1 year, no degree: 118
- Associate degree: 54
- Bachelor's degree: 178
- Master's degree: 5
- Professional school degree: 0
- Doctorate degree: 0


Housing units in structures:
- One, detached: 388
- One, attached: 183
- Two: 52
- 3 or 4: 203
- 5 to 9: 101
- 10 to 19: 73
- 20 to 49: 52
Housing units lacking complete kitchen facilities in 2022: 8.4%
House/condo owner moved in on average 22 years ago
Renter moved in on average 7 years ago

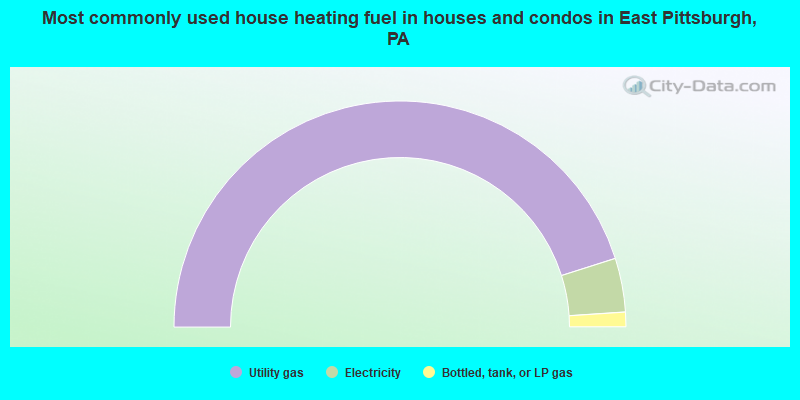
- 90.1%Utility gas
- 7.7%Electricity
- 2.1%Bottled, tank, or LP gas
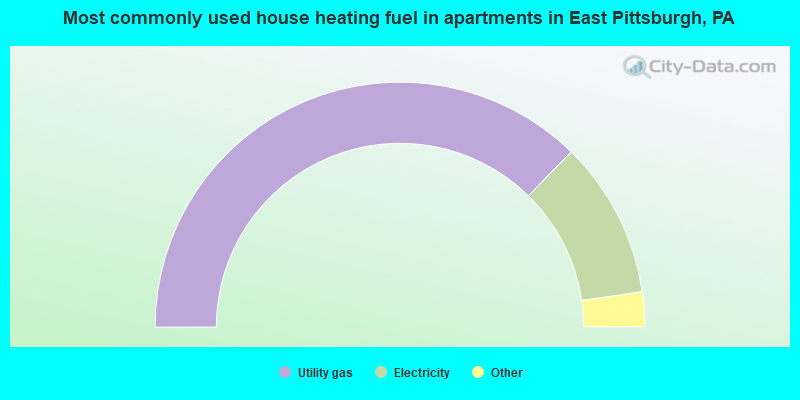
- 74.8%Utility gas
- 20.8%Electricity
- 3.5%Bottled, tank, or LP gas
- 0.9%No fuel used
Private vs. public school enrollment:
| Here: | 0.0% |
| Pennsylvania: | 15.7% |
| Here: | 0.0% |
| Pennsylvania: | 13.4% |
| Here: | 4.5% |
| Pennsylvania: | 39.8% |


