Housing density: 2,673 houses/condos per square mile
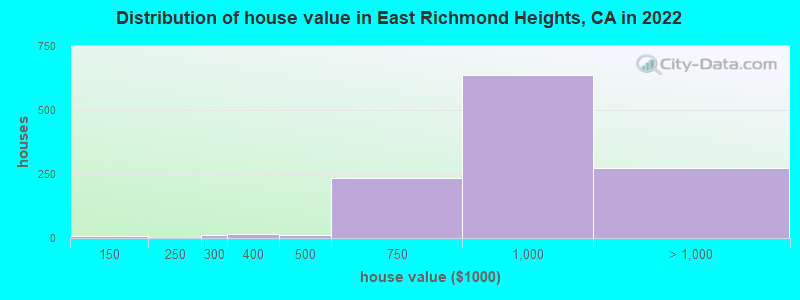
Median price asked for vacant for-sale houses and condos in 2022 in this county: $378,161.
Median contract rent in 2022: $1,728 (lower quartile is $1,460, upper quartile is over $2,000)
Median gross rent in East Richmond Heights, CA in 2022: $1,961
Housing units in East Richmond Heights with a mortgage: 732 (120 second mortgage, 0 home equity loan, 81 both second mortgage and home equity loan) Houses without a mortgage: 36
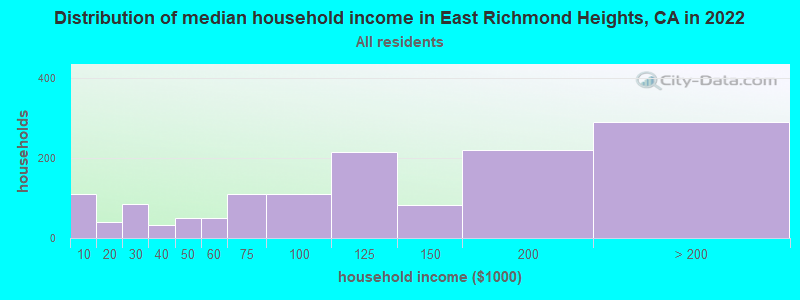
Median household income for houses/condos with a mortgage: $135,021
Median household income for apartments without a mortgage: $103,539
Median monthly housing costs: $1,913
Compare current foreclosures near East Richmond Heights, CA:
302 married couples with children.
50 single-parent households (12 men, 38 women).
77.8% of residents of East Richmond Heights speak English at home.
6.1% of residents speak Spanish at home (96% speak English very well, 4% speak English well).
4.9% of residents speak other Indo-European language at home (74% speak English very well, 26% speak English well).
9.3% of residents speak Asian or Pacific Island language at home (36% speak English very well, 26% speak English well, 34% speak English not well, 4% don't speak English at all).
0.8% of residents speak other language at home (100% speak English very well).
Foreign born population: 474 (14.5%)
(76.4% of them are naturalized citizens)
Percentage of workers working in this county: 58.3% Number of people working at home: 481 (26.9% of all workers)
Travel time to work (commute)
Less than 5 minutes: 33
5 to 9 minutes: 18
10 to 14 minutes: 74
15 to 19 minutes: 221
20 to 24 minutes: 177
25 to 29 minutes: 31
30 to 34 minutes: 113
35 to 39 minutes: 78
40 to 44 minutes: 93
45 to 59 minutes: 314
60 to 89 minutes: 166
90 or more minutes: 16
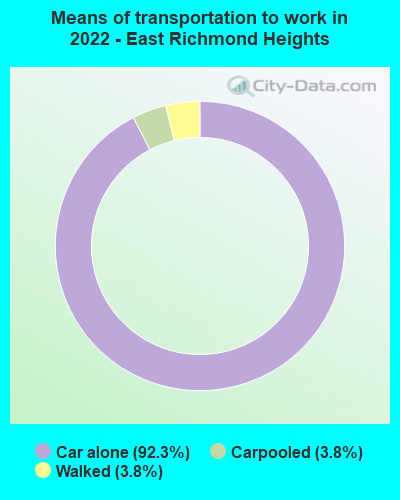
Means of transportation to work:
Drove a car alone: 186 (29.6%)
Carpooled: 8 (1.3%)
Walked: 11 (1.8%)
Worked at home: 481 (76.6%)
Unemployment by race in 2022
Unemployment rate for White non-Hispanic residents
9.8%Males
5.8%Females
Unemployment rate for other race residents
19.0%Males
Unemployment rate for two or more race residents
14.1%Males
Unemployment rate for Hispanic or Latino residents
8.0%Males
Year of entry for the foreign-born population in East Richmond Heights, California
522010 or later
642000 to 2009
161990 to 1999
2131980 to 1989
611970 to 1979
103Before 1970
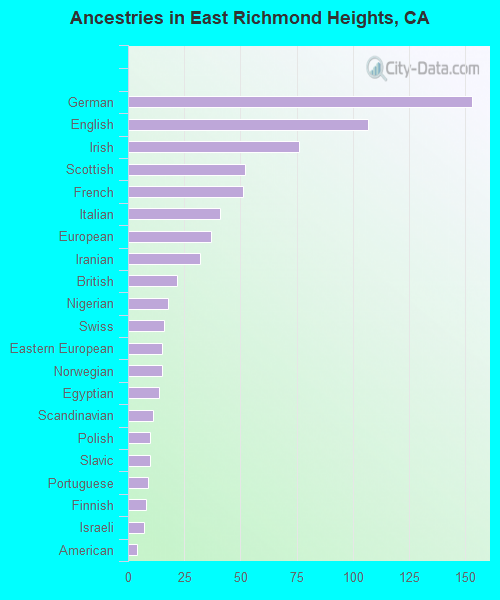
First ancestries reported:
German: 153 (10.1%)
English: 107 (7.1%)
Irish: 76 (5.0%)
Scottish: 52 (3.4%)
French: 51 (3.4%)
Italian: 41 (2.7%)
European: 37 (2.4%)
Iranian: 32 (2.1%)
British: 22 (1.5%)
Nigerian: 18 (1.2%)
Swiss: 16 (1.1%)
Eastern European: 15 (1.0%)
Norwegian: 15 (1.0%)
Egyptian: 14 (0.9%)
Scandinavian: 11 (0.7%)
Polish: 10 (0.7%)
Slavic: 10 (0.7%)
Portuguese: 9 (0.6%)
Finnish: 8 (0.5%)
Israeli: 7 (0.5%)
American: 4 (0.3%)
Most common places of birth for foreign-born residents (%):
Korea
East Richmond Heights:
22.5% (101)
California:
3.0% (315,248)
Japan
East Richmond Heights:
10.7% (48)
California:
1.0% (103,575)
Taiwan
East Richmond Heights:
8.7% (39)
California:
1.7% (176,274)
Mexico
East Richmond Heights:
7.8% (35)
California:
37.2% (3,881,193)
China, excluding Hong Kong and Taiwan
East Richmond Heights:
7.4% (33)
California:
6.6% (684,672)
India
East Richmond Heights:
5.6% (25)
California:
5.2% (539,184)
Germany
East Richmond Heights:
5.6% (25)
California:
0.7% (73,304)
El Salvador
East Richmond Heights:
4.7% (21)
California:
4.2% (440,287)
Vietnam
East Richmond Heights:
3.8% (17)
California:
4.9% (512,335)
Nigeria
East Richmond Heights:
3.3% (15)
California:
0.3% (35,557)
Hong Kong
East Richmond Heights:
2.5% (11)
California:
1.0% (105,215)
Brazil
East Richmond Heights:
2.5% (11)
California:
0.5% (53,222)
France
East Richmond Heights:
2.2% (10)
California:
0.4% (40,224)
Canada
East Richmond Heights:
2.2% (10)
California:
1.2% (127,477)
Sweden
East Richmond Heights:
1.6% (7)
California:
0.1% (12,221)
Philippines
East Richmond Heights:
1.6% (7)
California:
7.8% (818,297)
Place of birth for U.S.-born residents:
This state: 1,899
Other state: 817
Northeast: 209
Midwest: 317
South: 143
West: 148
97.4% of East Richmond Heights residents lived in the same house 1 years ago. Out of people who lived in different houses, 27.5% lived in this county. Out of people who lived in different counties, 75.6% lived in California.
East Richmond Heights:
97.4%
State average:
88.9%
Education attainment for males 25 years and older:
No schooling: 16
Nursery to 4th grade: 0
5th and 6th grade: 0
7th and 8th grade: 0
9th grade: 33
10th grade: 0
11th grade: 0
12th grade, no diploma: 0
High school graduate (or equivalency): 133
Less than 1 year of college: 109
Some college more than 1 year, no degree: 164
Associate degree: 98
Bachelor's degree: 378
Master's degree: 238
Professional school degree: 27
Doctorate degree: 77
Education attainment for females 25 years and older:
No schooling: 13
Nursery to 4th grade: 0
5th and 6th grade: 0
7th and 8th grade: 5
9th grade: 47
10th grade: 0
11th grade: 8
12th grade, no diploma: 7
High school graduate (or equivalency): 99
Less than 1 year of college: 57
Some college more than 1 year, no degree: 118
Associate degree: 269
Bachelor's degree: 345
Master's degree: 316
Professional school degree: 39
Doctorate degree: 41
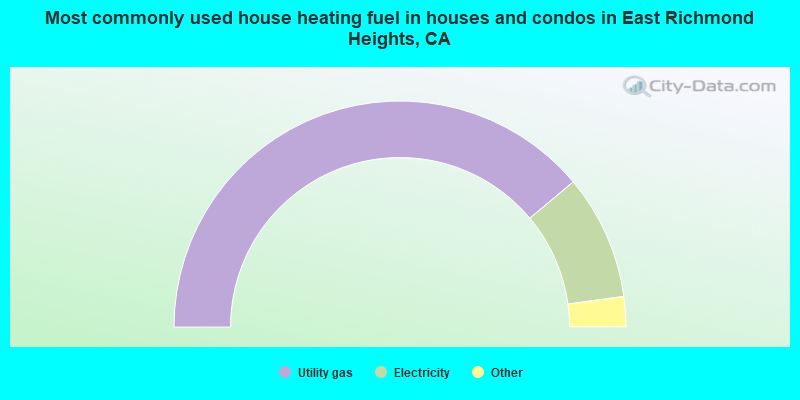
Housing units in structures:
One, detached: 1,420
One, attached: 52
Two: 39
Housing units lacking complete plumbing facilities in 2022: 0.4%
Housing units lacking complete kitchen facilities in 2022: 3.1%
House/condo owner moved in on average 20 years ago