Jump to a detailed profile or search site with Google Custom Search

East San Gabriel, CA (California) Houses and Residents

Estimated median house or condo value in 2022: $998,033 (it was $270,200 in 2000)
East San Gabriel:

$998,033
California:

$715,900
Lower value quartile - upper value quartile: $808,432 - $1,244,577

Total population: 14,874 (Urban population: 14,588, Rural population: 0)

Houses: 8,314 (7,727 occupied: 4,480 owner occupied, 3,277 renter occupied)

% of renters here:

42%
State:

44%

Housing density: 5,350 houses/condos per square mile

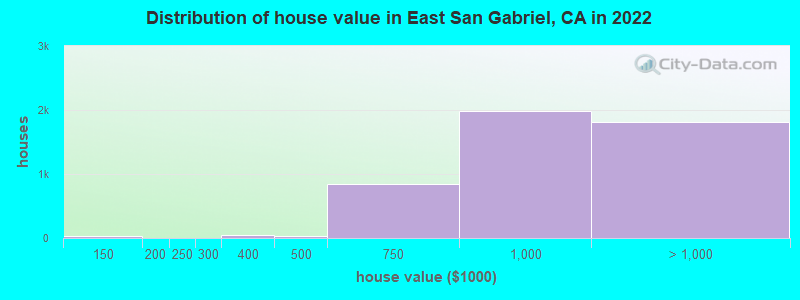
Median price asked for vacant for-sale houses and condos in 2022: $2,421,402.

Median contract rent in 2022: $1,778 (lower quartile is $1,470, upper quartile is over $2,000)


Median rent asked for vacant for-rent units in 2022: $2,062


Median gross rent in East San Gabriel, CA in 2022: $1,817

Housing units in East San Gabriel with a mortgage: 2,550 (301 second mortgage, 0 home equity loan, 289 both second mortgage and home equity loan)
Houses without a mortgage: 49

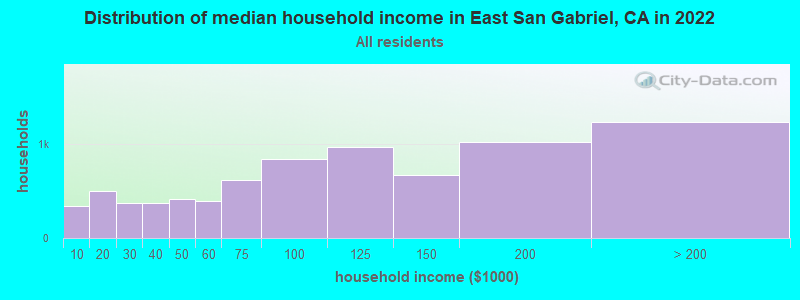
Median household income for houses/condos with a mortgage: $144,591

Median household income for apartments without a mortgage: $108,634

Median monthly housing costs: $1,784

Compare current foreclosures near East San Gabriel, CA:

Check out more offers near East San Gabriel, CA.
Powered by Foreclosure.com

Settings
X
Data:
Loading data...
Based on 2000-2022 data
Loading data...

123
Hide US histogram

East San Gabriel, California Age and Sex of Residents
Median year house/condo built: 1956

Median year apartment built: 1966

Household type by relationship:

Households: 22,162
  • Male householders: 4,179 (746 living alone), Female householders: 3,292 (811 living alone)
  • 3,874 spouses (3,848 opposite-sex spouses), 491 unmarried partners, (462 opposite-sex unmarried partners), 6,143 children (6,049 natural, 26 adopted, 67 stepchildren), 512 grandchildren, 547 brothers or sisters, 1,212 parents, 67 foster children, 841 other relatives, 873 non-relatives
  • In group quarters: 126

Size of family households: 1,853 2-persons, 1,672 3-persons, 1,073 4-persons, 352 5-persons, 319 6-persons, 219 7-or-more-persons.

Size of nonfamily households: 1,670 1-person, 463 2-persons, 85 3-persons, 7 4-persons, 17 7-or-more-persons.

2,581 married couples with children.
921 single-parent households (307 men, 614 women).

34.2% of residents of East San Gabriel speak English at home.
15.5% of residents speak Spanish at home (73% speak English very well, 11% speak English well, 10% speak English not well, 5% don't speak English at all).
3.1% of residents speak other Indo-European language at home (71% speak English very well, 27% speak English well, 2% speak English not well).
45.5% of residents speak Asian or Pacific Island language at home (36% speak English very well, 31% speak English well, 24% speak English not well, 9% don't speak English at all).
1.6% of residents speak other language at home (33% speak English very well, 15% speak English well, 13% speak English not well, 39% don't speak English at all).

Foreign born population: 10,076 (45.5%)
(64.4% of them are naturalized citizens)

Median number of rooms in houses and condos:
Here:

5.9
State:

6.0

Median number of rooms in apartments
Here:

3.9
State:

3.9

Owner-occupied Renter-occupied
Bedrooms in owner-occupied houses and condos in East San Gabriel, California
  • Bedrooms in owner-occupied houses and condos in East San Gabriel, California
  • 0no bedroom
  • 511 bedroom
  • 5392 bedrooms
  • 2,4283 bedrooms
  • 1,2204 bedrooms
  • 2425+ bedrooms
Bedrooms in renter-occupied apartments in East San Gabriel, California
  • Bedrooms in renter-occupied apartments in East San Gabriel, California
  • 276no bedroom
  • 8921 bedroom
  • 1,2212 bedrooms
  • 6393 bedrooms
  • 2044 bedrooms
  • 465+ bedrooms
Owner-occupied Renter-occupied
Cars and other vehicles available in East San Gabriel in owner-occupied houses/condos
  • Cars and other vehicles available in East San Gabriel in owner-occupied houses/condos
  • 158no vehicle
  • 9191 vehicle
  • 1,9242 vehicles
  • 8633 vehicles
  • 4854 vehicles
  • 1305+ vehicles
Cars and other vehicles available in East San Gabriel in renter-occupied apartments
  • Cars and other vehicles available in East San Gabriel in renter-occupied apartments
  • 177no vehicle
  • 1,3851 vehicle
  • 1,1052 vehicles
  • 3353 vehicles
  • 2164 vehicles
  • 595+ vehicles
Owner-occupied Renter-occupied
Rooms in owner-occupied houses in East San Gabriel, California
  • Rooms in owner-occupied houses in East San Gabriel, California
  • 01 room
  • 162 rooms
  • 793 rooms
  • 4364 rooms
  • 9675 rooms
  • 1,4816 rooms
  • 6657 rooms
  • 5058 rooms
  • 3319+ rooms
Rooms in renter-occupied apartments in East San Gabriel, California
  • Rooms in renter-occupied apartments in East San Gabriel, California
  • 2431 room
  • 2802 rooms
  • 7973 rooms
  • 8074 rooms
  • 6185 rooms
  • 2846 rooms
  • 1517 rooms
  • 228 rooms
  • 749+ rooms
Year house built
Median 2022 house/condo value by year built
Median house/condo value by year householder moved into unit
Breakdown of mean house values by ages of householders
  • East San Gabriel, CA household income distribution

  • Distribution of median household income in East San Gabriel, CA in 2022
  • 338Less than $10,000
  • 506$10,000 to $19,999
  • 373$20,000 to $29,999
  • 369$30,000 to $39,999
  • 412$40,000 to $49,999
  • 397$50,000 to $59,999
  • 613$60,000 to $74,999
  • 847$75,000 to $99,999
  • 967$100,000 to $124,999
  • 672$125,000 to $149,999
  • 1,018$150,000 to $199,999
  • 1,236$200,000 or more
  • Home value of owner - occupied houses in 2022 in East San Gabriel, CA

  • Distribution of house value in East San Gabriel, CA in 2022
  • 9$25,000 to $29,999
  • 6$60,000 to $69,999
  • 9$80,000 to $89,999
  • 34$100,000 to $124,999
  • 2$200,000 to $249,999
  • 5$250,000 to $299,999
  • 50$300,000 to $399,999
  • 26$400,000 to $499,999
  • 840$500,000 to $749,999
  • 1,979$750,000 to $999,999
  • 1,372$1,000,000 to $1,499,999
  • 341$1,500,000 to $1,999,999
  • 93$2,000,000 or more
  • Rent paid by renters in 2022 in East San Gabriel, CA

  • Distribution of rent paid by renters in East San Gabriel, CA in 2022
  • 7$650 to $699
  • 9$700 to $749
  • 6$750 to $799
  • 44$800 to $899
  • 34$900 to $999
  • 224$1,000 to $1,249
  • 470$1,250 to $1,499
  • 1,434$1,500 to $1,999
  • 428$2,000 to $2,499
  • 200$2,500 to $2,999
  • 135$3,000 to $3,499
  • 157$3,500 or more
  • 189No cash rent
Time Leaving Home To Go To Work in 2022

Percentage of workers working in this county: 95.8%
Number of people working at home: 1,818 (17.0% of all workers)

Travel time (in minutes) to work in 2022

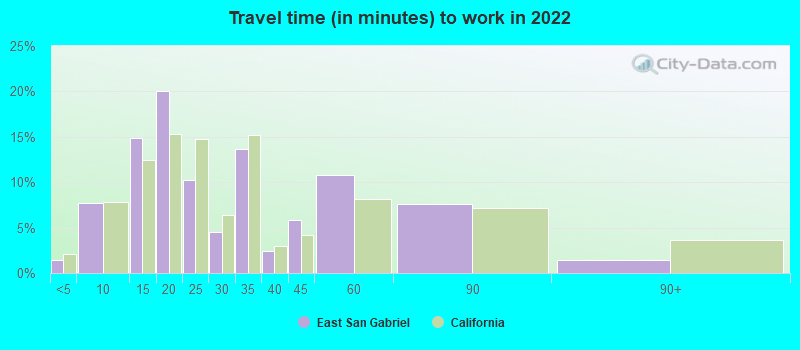
Travel time to work (commute)

  • Less than 5 minutes: 9
  • 5 to 9 minutes: 246
  • 10 to 14 minutes: 1,087
  • 15 to 19 minutes: 1,383
  • 20 to 24 minutes: 1,338
  • 25 to 29 minutes: 479
  • 30 to 34 minutes: 1,479
  • 35 to 39 minutes: 374
  • 40 to 44 minutes: 426
  • 45 to 59 minutes: 1,058
  • 60 to 89 minutes: 732
  • 90 or more minutes: 229
Means of transportation to work in 2022 - East San Gabriel

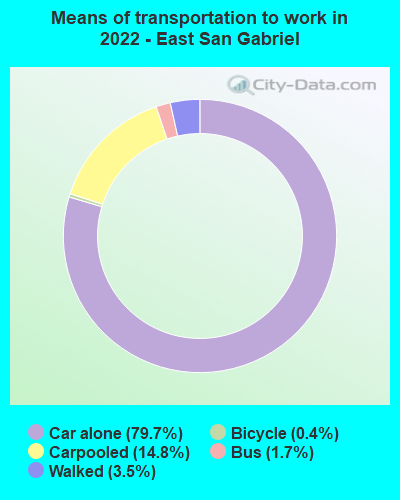
Means of transportation to work:

  • Drove a car alone: 1,248 (40.8%)
  • Carpooled: 256 (8.4%)
  • Bus: 24 (0.8%)
  • Bicycle: 6 (0.2%)
  • Walked: 58 (1.9%)
  • Worked at home: 1,818 (59.4%)
Class of Workers in 2022
  • Unemployment by race in 2022
  • Unemployment rate for White non-Hispanic residents
  • 10.1%Males
  • 0.9%Females
  • Unemployment rate for Black residents
  • 7.3%Males
  • 14.2%Females
  • Unemployment rate for Asian residents
  • 5.6%Males
  • 5.3%Females
  • Unemployment rate for other race residents
  • 0.6%Males
  • 5.1%Females
  • Unemployment rate for two or more race residents
  • 21.2%Males
  • 6.0%Females
  • Unemployment rate for Hispanic or Latino residents
  • 9.0%Males
  • 5.0%Females
Year of entry for the foreign-born population in East San Gabriel, California
  • Year of entry for the foreign-born population in East San Gabriel, California
  • 3,3192010 or later
  • 1,5012000 to 2009
  • 2,0301990 to 1999
  • 2,0851980 to 1989
  • 1,2341970 to 1979
  • 761Before 1970
Ancestries in East San Gabriel, CA

First ancestries reported:

  • Italian: 340 (2.1%)
  • German: 177 (1.1%)
  • English: 128 (0.8%)
  • Polish: 105 (0.7%)
  • Egyptian: 100 (0.6%)
  • Armenian: 82 (0.5%)
  • Irish: 79 (0.5%)
  • American: 76 (0.5%)
  • European: 62 (0.4%)
  • Romanian: 47 (0.3%)
  • African: 45 (0.3%)
  • New Zealander: 44 (0.3%)
  • Syrian: 27 (0.2%)
  • Eastern European: 26 (0.2%)
  • Greek: 24 (0.1%)
  • British: 23 (0.1%)
  • Iranian: 16 (0.10%)
  • Norwegian: 15 (0.09%)
  • Lebanese: 14 (0.09%)
  • Scandinavian: 13 (0.08%)
  • Scottish: 13 (0.08%)
  • French: 11 (0.07%)
  • Maltese: 9 (0.06%)
  • Swedish: 9 (0.06%)
  • Scotch-Irish: 8 (0.05%)
  • Danish: 7 (0.04%)
  • Russian: 6 (0.04%)
  • Northern European: 5 (0.03%)

Most common places of birth for foreign-born residents (%):

China, excluding Hong Kong and Taiwan
East San Gabriel:

35.4% (3,565)
California:

6.6% (684,672)

Taiwan
East San Gabriel:

12.1% (1,215)
California:

1.7% (176,274)

Hong Kong
East San Gabriel:

9.2% (931)
California:

1.0% (105,215)

Vietnam
East San Gabriel:

8.7% (877)
California:

4.9% (512,335)

Mexico
East San Gabriel:

6.0% (605)
California:

37.2% (3,881,193)

Philippines
East San Gabriel:

5.0% (503)
California:

7.8% (818,297)

Guatemala
East San Gabriel:

3.9% (391)
California:

2.8% (290,436)

Indonesia
East San Gabriel:

2.6% (259)
California:

0.4% (39,097)

Korea
East San Gabriel:

2.1% (213)
California:

3.0% (315,248)

India
East San Gabriel:

1.9% (193)
California:

5.2% (539,184)

Italy
East San Gabriel:

1.6% (165)
California:

0.3% (31,439)

Place of birth for U.S.-born residents:

  • This state: 10,259
  • Other state: 1,488
  • Northeast: 416
  • Midwest: 535
  • South: 205
  • West: 314

89.5% of East San Gabriel residents lived in the same house 1 years ago.
   Out of people who lived in different houses, 47.0% lived in this county.
   Out of people who lived in different counties, 59.4% lived in California.


East San Gabriel:

89.5%
State average:

88.9%

Education attainment for males 25 years and older:

  • No schooling: 355
  • Nursery to 4th grade: 91
  • 5th and 6th grade: 199
  • 7th and 8th grade: 13
  • 9th grade: 24
  • 10th grade: 60
  • 11th grade: 43
  • 12th grade, no diploma: 194
  • High school graduate (or equivalency): 1,600
  • Less than 1 year of college: 213
  • Some college more than 1 year, no degree: 1,113
  • Associate degree: 611
  • Bachelor's degree: 2,482
  • Master's degree: 771
  • Professional school degree: 225
  • Doctorate degree: 180
Educational Attainment for Males

Education attainment for females 25 years and older:

  • No schooling: 267
  • Nursery to 4th grade: 64
  • 5th and 6th grade: 171
  • 7th and 8th grade: 74
  • 9th grade: 49
  • 10th grade: 24
  • 11th grade: 8
  • 12th grade, no diploma: 232
  • High school graduate (or equivalency): 1,546
  • Less than 1 year of college: 342
  • Some college more than 1 year, no degree: 797
  • Associate degree: 969
  • Bachelor's degree: 2,253
  • Master's degree: 886
  • Professional school degree: 293
  • Doctorate degree: 200
Educational Attainment for Females
East San Gabriel marital status for males
East San Gabriel marital status for females

Housing units in structures:

  • One, detached: 5,857
  • One, attached: 354
  • Two: 73
  • 3 or 4: 64
  • 5 to 9: 153
  • 10 to 19: 352
  • 20 to 49: 981
  • 50 or more: 462
  • Mobile homes: 7
  • Boats, RVs, vans, etc.: 8
Housing units lacking complete plumbing facilities in 2022: 0.9%

Housing units lacking complete kitchen facilities in 2022: 5.6%

House/condo owner moved in on average 18 years ago

Renter moved in on average 3 years ago

Year householders moved into residence in East San Gabriel
Houses and condos Apartments
Most commonly used house heating fuel in houses and condos in East San Gabriel, CA
  • 73.7%Utility gas
  • 22.9%Electricity
  • 2.0%Bottled, tank, or LP gas
  • 0.5%Fuel oil, kerosene, etc.
  • 0.5%No fuel used
  • 0.4%Solar energy
Most commonly used house heating fuel in apartments in East San Gabriel, CA
  • 76.9%Utility gas
  • 19.0%Electricity
  • 3.7%No fuel used
  • 0.5%Bottled, tank, or LP gas

Private vs. public school enrollment:

Students in private schools in grades 1 to 8 (elementary and middle school): 151
Here:

9.1%
California:

10.5%

Students in private schools in grades 9 to 12 (high school): 95
Here:

8.6%
California:

8.5%

Students in private undergraduate colleges: 206
Here:

20.4%
California:

15.9%
School Enrollment by Level of School for Male Students
School Enrollment by Level of School for Female Students
Age and Sex of Sensory-Disabled Noninstitutionalized Residents
Age and Sex of Physically-Disabled Noninstitutionalized Residents
Age and Sex of Mentally-Disabled Noninstitutionalized Residents
Age and Sex of Self-Care Disabled Noninstitutionalized Residents
Age and Sex of Go-Outside-Home Disabled Noninstitutionalized Residents
Age and Sex of Noninstitutionalized Residents with Employment Disability