East Sandwich, MA (Massachusetts) Houses and Residents
Estimated median house or condo value in 2022: $717,184 (it was $243,200 in 2000 )
East Sandwich:
$717,184Massachusetts:
$534,700
Lower value quartile - upper value quartile: $525,490 - $874,408Mean price in 2022: Detached houses: $751,073 Here:
$751,073State:
$651,570
Townhouses or other attached units: $489,804 Here:
$489,804State:
$617,749
In 2-unit structures: $1,227,885 Here:
$1,227,885State:
$594,808
Total population: 3,940 (Urban population: 3,679, Rural population: 0)
Houses: 2,121 (1,537 occupied: 1,495 owner occupied, 142 renter occupied )
% of renters here:
9%State:
38%
Housing density: 284 houses/condos per square mile
Median price asked for vacant for-sale houses and condos in 2022 in this county: $590,409.
Median contract rent in 2022: $1,525 (lower quartile is $1,042, upper quartile is $1,770)
Median rent asked for vacant for-rent units in 2022: $2,009
Median gross rent in East Sandwich, MA in 2022: $1,911
Housing units in East Sandwich with a mortgage: 845 (168 second mortgage, 9 home equity loan, 119 both second mortgage and home equity loan )Houses without a mortgage: 29
Median household income for houses/condos with a mortgage: $137,507
Median household income for apartments without a mortgage: $122,957
Median monthly housing costs: $1,902
Data:
Median house or condo value ($)
Median house or condo value ($ change since 2000)
Median house or condo value ($) - White
Median house or condo value ($) - Black or African American
Median house or condo value ($) - Asian
Median house or condo value ($) - Hispanic or Latino
Median house or condo value ($) - American Indian and Alaska Native
Median house or condo value ($) - Multirace
Median house or condo value ($) - Other Race
Median price asked for mobile homes ($)
Household density (households per square mile)
Mean house or condo value by units in structure - 1, detached ($)
Mean house or condo value by units in structure - 1, attached ($)
Mean house or condo value by units in structure - 2 ($)
Mean house or condo value by units in structure by units in structure - 3 or 4 ($)
Mean house or condo value by units in structure - 5 or more ($)
Mean house or condo value by units in structure - Boat, RV, van, etc. ($)
Mean house or condo value by units in structure - Mobile home ($)
Median contract rent ($)
Median contract rent - Lower quartile ($)
Median contract rent - Upper quartile ($)
Median gross rent ($)
Urban houses (%)
Rural houses (%)
Houses occupied (%)
Houses occupied (% change since 2000)
Houses owner occupied (%)
Houses owner occupied (% change since 2000)
Houses renter occupied (%)
Houses renter occupied (% change since 2000)
Vacant housing units - For rent (%)
Vacant housing units - For rent (% change since 2000)
Vacant housing units - For sale only (%)
Vacant housing units - For sale only (% change since 2000)
Vacant housing units - Rented or sold, not occupied (%)
Vacant housing units - Rented or sold, not occupied (% change since 2000)
Vacant housing units - For seasonal, recreational, or occasional use (%)
Vacant housing units - For seasonal, recreational, or occasional use (% change since 2000)
Vacant housing units - For migrant workers (%)
Vacant housing units - For migrant workers (% change since 2000)
Vacant housing units - Other vacant (%)
Vacant housing units - Other vacant (% change since 2000)
Median monthly housing costs ($)
Median household income for houses/condos with a mortgage ($)
Median household income for houses/condos without a mortgage ($)
Median household income ($)
Median household income ($) - White
Median household income ($) - Black or African American
Median household income ($) - Asian
Median household income ($) - Hispanic or Latino
Median household income ($) - American Indian and Alaska Native
Median household income ($) - Multirace
Median household income ($) - Other Race
Mortgage status - with mortgage (%)
Mortgage status - with second mortgage (%)
Mortgage status - with home equity loan (%)
Mortgage status - with both second mortgage and home equity loan (%)
Mortgage status - without a mortgage (%)
Median year house/condo built
Median year apartment built
Household type by relationship - Male householder living alone (%)
Household type by relationship - Male householder not living alone (%)
Household type by relationship - Female householder living alone (%)
Household type by relationship - Female householder not living alone (%)
Household type by relationship - Opposite-Sex spouse (%)
Household type by relationship - Same-Sex spouse (%)
Household type by relationship - Opposite-Sex unmarried partner (%)
Household type by relationship - Same-Sex unmarried partner (%)
Household type by relationship - In group quarters (%)
Size of family households - 2-person household (%)
Size of family households - 3-person household (%)
Size of family households - 4-person household (%)
Size of family households - 5-person household (%)
Size of family households - 6-person household (%)
Size of family households - 7-or-more-person household (%)
Size of nonfamily households - 1-person household (%)
Size of nonfamily households - 2-person household (%)
Size of nonfamily households - 3-person household (%)
Size of nonfamily households - 4-person household (%)
Size of nonfamily households - 5-person household (%)
Size of nonfamily households - 6-person household (%)
Size of nonfamily households - 7-or-moreperson household (%)
Year house built - Built 2010 or later (%)
Year house built - Built 2000 to 2009 (%)
Year house built - Built 1990 to 1999 (%)
Year house built - Built 1980 to 1989 (%)
Year house built - Built 1970 to 1979 (%)
Year house built - Built 1960 to 1969 (%)
Year house built - Built 1950 to 1959 (%)
Year house built - Built 1940 to 1949 (%)
Year house built - Built 1939 or earlier (%)
Median number of rooms in houses and condos
Median number of rooms in apartments
Median number of bedrooms in owner occupied houses
Mean number of bedrooms in owner occupied houses
Median number of bedrooms in renter occupied houses
Mean number of bedrooms in renter occupied houses
Median number of vehichles in owner occupied houses
Mean number of vehichles in owner occupied houses
Median number of vehichles in renter occupied houses
Mean number of vehichles in renter occupied houses
Rooms in owner-occupied houses - 1 room (%)
Rooms in owner-occupied houses - 2 rooms (%)
Rooms in owner-occupied houses - 3 rooms (%)
Rooms in owner-occupied houses - 4 rooms (%)
Rooms in owner-occupied houses - 5 rooms (%)
Rooms in owner-occupied houses - 6 rooms (%)
Rooms in owner-occupied houses - 7 rooms (%)
Rooms in owner-occupied houses - 8 rooms (%)
Rooms in owner-occupied houses - 9+ rooms (%)
Rooms in renter-occupied houses - 1 room (%)
Rooms in renter-occupied houses - 2 rooms (%)
Rooms in renter-occupied houses - 3 rooms (%)
Rooms in renter-occupied houses - 4 rooms (%)
Rooms in renter-occupied houses - 5 rooms (%)
Rooms in renter-occupied houses - 6 rooms (%)
Rooms in renter-occupied houses - 7 rooms (%)
Rooms in renter-occupied houses - 8 rooms (%)
Rooms in renter-occupied houses - 9+ rooms (%)
Bedrooms in owner-occupied houses - no bedrooms (%)
Bedrooms in owner-occupied houses - 1 bedroom (%)
Bedrooms in owner-occupied houses - 2 bedrooms (%)
Bedrooms in owner-occupied houses - 3 bedrooms (%)
Bedrooms in owner-occupied houses - 4 bedrooms (%)
Bedrooms in owner-occupied houses - 5+ bedrooms (%)
Bedrooms in renter-occupied houses - no bedrooms (%)
Bedrooms in renter-occupied houses - 1 bedroom (%)
Bedrooms in renter-occupied houses - 2 bedrooms (%)
Bedrooms in renter-occupied houses - 3 bedrooms (%)
Bedrooms in renter-occupied houses - 4 bedrooms (%)
Bedrooms in renter-occupied houses - 5+ bedrooms (%)
Vehicles available in owner-occupied houses - no vehicle available (%)
Vehicles available in owner-occupied houses - 1 vehicle available(%)
Vehicles available in owner-occupied houses - 2 Vehicles available (%)
Vehicles available in owner-occupied houses - 3 Vehicles available (%)
Vehicles available in owner-occupied houses - 4 Vehicles available (%)
Vehicles available in owner-occupied houses - 5+ Vehicles available (%)
Vehicles available in renter-occupied houses - no vehicle available (%)
Vehicles available in renter-occupied houses - 1 vehicle available (%)
Vehicles available in renter-occupied houses - 2 Vehicles available (%)
Vehicles available in renter-occupied houses - 3 Vehicles available (%)
Vehicles available in renter-occupied houses - 4 Vehicles available (%)
Vehicles available in renter-occupied houses - 5+ Vehicles available (%)
Housing units in structures - 1, detached (%)
Housing units in structures - 1, attached (%)
Housing units in structures - 2 (%)
Housing units in structures - 3 or 4 (%)
Housing units in structures - 5 to 9 (%)
Housing units in structures - 10 to 19 (%)
Housing units in structures - 20 to 49 (%)
Housing units in structures - 50 or more (%)
Housing units in structures - Mobile home (%)
Housing units in structures - Boat, RV, van, etc. (%)
Housing units in structures - Owners - 1, detached (%)
Housing units in structures - Owners - 1, attached (%)
Housing units in structures - Owners - 2 (%)
Housing units in structures - Owners - 3 or 4 (%)
Housing units in structures - Owners - 5 to 9 (%)
Housing units in structures - Owners - 10 to 19 (%)
Housing units in structures - Owners - 20 to 49 (%)
Housing units in structures - Owners - 50 or more (%)
Housing units in structures - Owners - Mobile home (%)
Housing units in structures - Owners - Boat, RV, van, etc. (%)
Housing units in structures - Renters - 1, detached (%)
Housing units in structures - Renters - 1, attached (%)
Housing units in structures - Renters - 2 (%)
Housing units in structures - Renters - 3 or 4 (%)
Housing units in structures - Renters - 5 to 9 (%)
Housing units in structures - Renters - 10 to 19 (%)
Housing units in structures - Renters - 20 to 49 (%)
Housing units in structures - Renters - 50 or more (%)
Housing units in structures - Renters - Mobile home (%)
Housing units in structures - Renters - Boat, RV, van, etc. (%)
House/condo owner moved in on average (years ago)
Renter moved in on average (years ago)
Year householder moved into unit - Moved in 1999 to March 2000 (%)
Year householder moved into unit - Moved in 1999 to March 2000 (%) - White
Year householder moved into unit - Moved in 1999 to March 2000 (%) - Black or African American
Year householder moved into unit - Moved in 1999 to March 2000 (%) - Asian
Year householder moved into unit - Moved in 1999 to March 2000 (%) - Hispanic or Latino
Year householder moved into unit - Moved in 1999 to March 2000 (%) - American Indian and Alaska Native
Year householder moved into unit - Moved in 1999 to March 2000 (%) - Multirace
Year householder moved into unit - Moved in 1999 to March 2000 (%) - Other Race
Year householder moved into unit - Moved in 1995 to 1998 (%)
Year householder moved into unit - Moved in 1995 to 1998 (%) - White
Year householder moved into unit - Moved in 1995 to 1998 (%) - Black or African American
Year householder moved into unit - Moved in 1995 to 1998 (%) - Asian
Year householder moved into unit - Moved in 1995 to 1998 (%) - Hispanic or Latino
Year householder moved into unit - Moved in 1995 to 1998 (%) - American Indian and Alaska Native
Year householder moved into unit - Moved in 1995 to 1998 (%) - Multirace
Year householder moved into unit - Moved in 1995 to 1998 (%) - Other Race
Year householder moved into unit - Moved in 1990 to 1994 (%)
Year householder moved into unit - Moved in 1990 to 1994 (%) - White
Year householder moved into unit - Moved in 1990 to 1994 (%) - Black or African American
Year householder moved into unit - Moved in 1990 to 1994 (%) - Asian
Year householder moved into unit - Moved in 1990 to 1994 (%) - Hispanic or Latino
Year householder moved into unit - Moved in 1990 to 1994 (%) - American Indian and Alaska Native
Year householder moved into unit - Moved in 1990 to 1994 (%) - Multirace
Year householder moved into unit - Moved in 1990 to 1994 (%) - Other Race
Year householder moved into unit - Moved in 1980 to 1989 (%)
Year householder moved into unit - Moved in 1980 to 1989 (%) - White
Year householder moved into unit - Moved in 1980 to 1989 (%) - Black or African American
Year householder moved into unit - Moved in 1980 to 1989 (%) - Asian
Year householder moved into unit - Moved in 1980 to 1989 (%) - Hispanic or Latino
Year householder moved into unit - Moved in 1980 to 1989 (%) - American Indian and Alaska Native
Year householder moved into unit - Moved in 1980 to 1989 (%) - Multirace
Year householder moved into unit - Moved in 1980 to 1989 (%) - Other Race
Year householder moved into unit - Moved in 1970 to 1979 (%)
Year householder moved into unit - Moved in 1970 to 1979 (%) - White
Year householder moved into unit - Moved in 1970 to 1979 (%) - Black or African American
Year householder moved into unit - Moved in 1970 to 1979 (%) - Asian
Year householder moved into unit - Moved in 1970 to 1979 (%) - Hispanic or Latino
Year householder moved into unit - Moved in 1970 to 1979 (%) - American Indian and Alaska Native
Year householder moved into unit - Moved in 1970 to 1979 (%) - Multirace
Year householder moved into unit - Moved in 1970 to 1979 (%) - Other Race
Year householder moved into unit - Moved in 1969 or earlier (%)
Year householder moved into unit - Moved in 1969 or earlier (%) - White
Year householder moved into unit - Moved in 1969 or earlier (%) - Black or African American
Year householder moved into unit - Moved in 1969 or earlier (%) - Asian
Year householder moved into unit - Moved in 1969 or earlier (%) - Hispanic or Latino
Year householder moved into unit - Moved in 1969 or earlier (%) - American Indian and Alaska Native
Year householder moved into unit - Moved in 1969 or earlier (%) - Multirace
Year householder moved into unit - Moved in 1969 or earlier (%) - Other Race
Housing units lacking complete plumbing facilities (%)
Housing units lacking complete kitchen facilities (%)
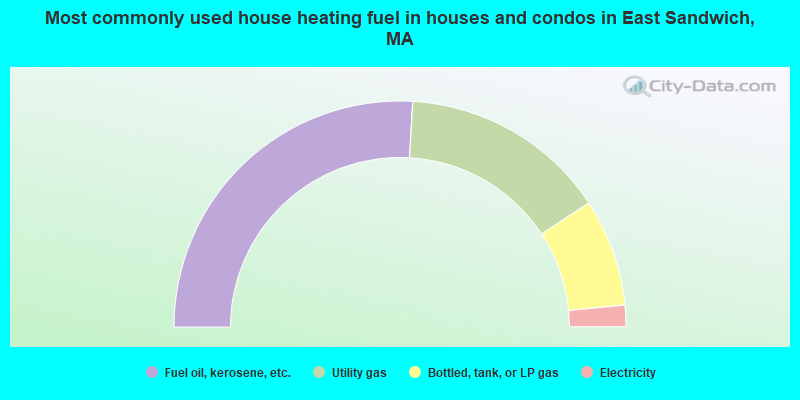
House heating fuel used in houses and condos - Utility gas (%)
House heating fuel used in houses and condos - Bottled, tank, or LP gas (%)
House heating fuel used in houses and condos - Electricity (%)
House heating fuel used in houses and condos - Fuel oil, kerosene, etc. (%)
House heating fuel used in houses and condos - Coal or coke (%)
House heating fuel used in houses and condos - Wood (%)
House heating fuel used in houses and condos - Solar energy (%)
House heating fuel used in houses and condos - Other fuel (%)
House heating fuel used in houses and condos - No fuel used (%)
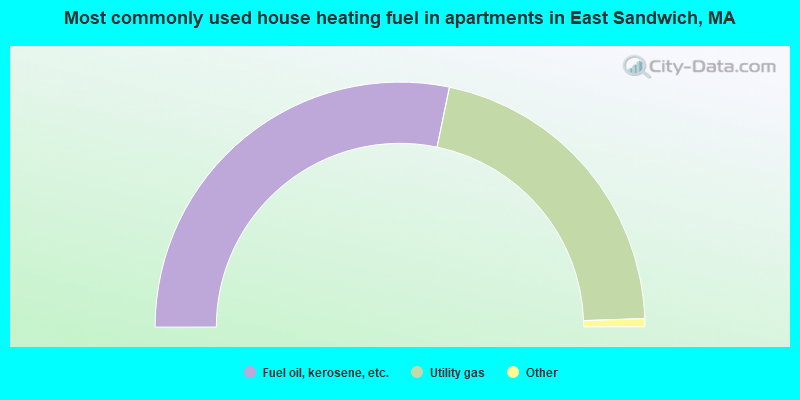
House heating fuel used in apartments - Utility gas (%)
House heating fuel used in apartments - Bottled, tank, or LP gas (%)
House heating fuel used in apartments - Electricity (%)
House heating fuel used in apartments - Fuel oil, kerosene, etc. (%)
House heating fuel used in apartments - Coal or coke (%)
House heating fuel used in apartments - Wood (%)
House heating fuel used in apartments - Solar energy (%)
House heating fuel used in apartments - Other fuel (%)
House heating fuel used in apartments - No fuel used (%)
Median year house/condo built: 1983Median year apartment built: 1939Household type by relationship:
Households: 3,836
Male householders: 765 (203 living alone ), Female householders: 782 (185 living alone )1,024 spouses (1,008 opposite-sex spouses ), 33 unmarried partners , (33 opposite-sex unmarried partners ), 961 children (867 natural , 78 adopted , 16 stepchildren ), 90 grandchildren , 23 brothers or sisters , 50 parents , 0 foster children , 63 other relatives , 23 non-relatives In group quarters: 18
Size of family households: 658 2-persons , 179 3-persons , 297 4-persons , 65 5-persons .
Size of nonfamily households: 416 1-person , 22 2-persons .
343 married couples with children. single-parent households (18 men , 88 women ).
97.2% of residents of East Sandwich speak English at home. of residents speak Spanish at home (78% speak English very well , 22% don't speak English at all ).of residents speak other Indo-European language at home (100% speak English very well ).of residents speak Asian or Pacific Island language at home (100% speak English very well ).
Foreign born population: 171 (4.5%)of them are naturalized citizens )
Median number of rooms in houses and condos:
Median number of rooms in apartments
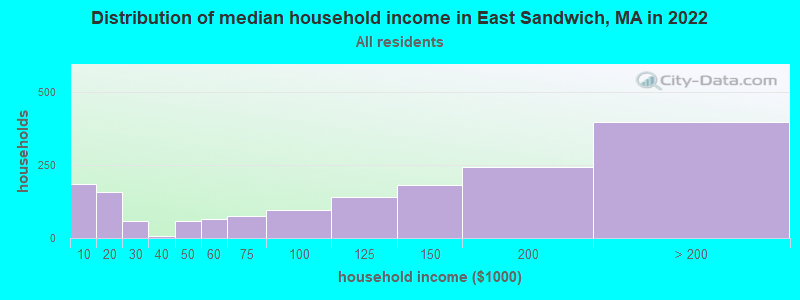
East Sandwich, MA household income distribution 186 Less than $10,000159 $10,000 to $19,99957 $20,000 to $29,9998 $30,000 to $39,99958 $40,000 to $49,99964 $50,000 to $59,99976 $60,000 to $74,99997 $75,000 to $99,999142 $100,000 to $124,999180 $125,000 to $149,999244 $150,000 to $199,999397 $200,000 or more
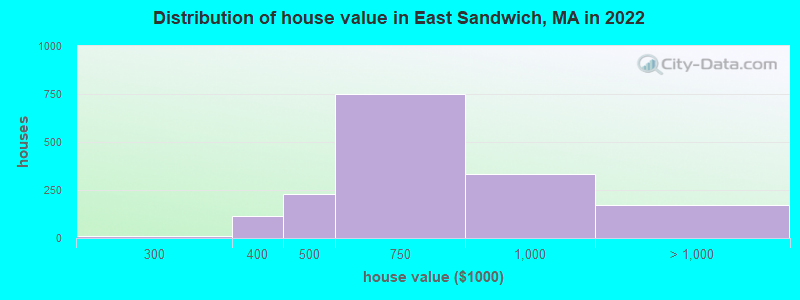
Home value of owner - occupied houses in 2022 in East Sandwich, MA 5 $100,000 to $124,9995 $150,000 to $174,9993 $200,000 to $249,9999 $250,000 to $299,999112 $300,000 to $399,999229 $400,000 to $499,999750 $500,000 to $749,999333 $750,000 to $999,999135 $1,000,000 to $1,499,99937 $1,500,000 to $1,999,999Rent paid by renters in 2022 in East Sandwich, MA 14 $1,000 to $1,2499 $1,250 to $1,49932 $1,500 to $1,99974 No cash rent
Percentage of workers working in this county: 71.4%Number of people working at home: 241 (14.9% of all workers )
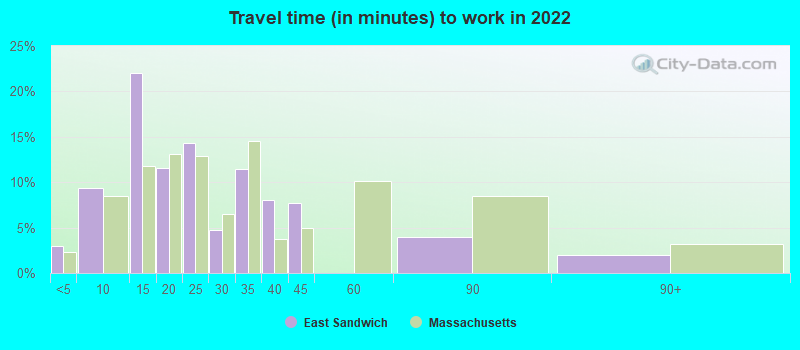
Travel time to work (commute)
Less than 5 minutes: 125 to 9 minutes: 20210 to 14 minutes: 18815 to 19 minutes: 16020 to 24 minutes: 32325 to 29 minutes: 7230 to 34 minutes: 9635 to 39 minutes: 1340 to 44 minutes: 10845 to 59 minutes: 14160 to 89 minutes: 7690 or more minutes: 19
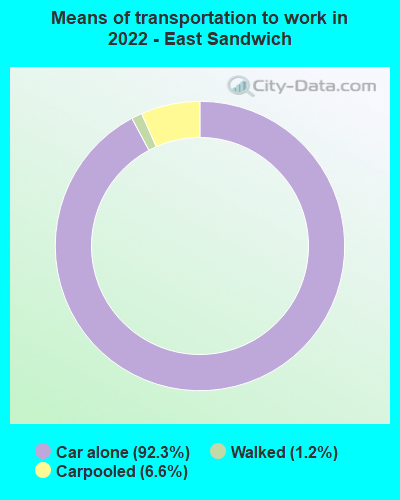
Means of transportation to work:
Drove a car alone: 642 (77.1%)Carpooled: 47 (5.6%)Walked: 9 (1.1%)Worked at home: 199 (23.9%)
Unemployment by race in 2022
Unemployment rate for White non-Hispanic residents 3.4% Males1.4% Females
Year of entry for the foreign-born population in East Sandwich, Massachusetts
6 2010 or later 59 2000 to 2009 16 1990 to 1999 19 1980 to 1989 7 1970 to 1979 47 Before 1970
First ancestries reported:
English: 395 (24.6%)
Irish: 330 (20.5%)
Italian: 208 (12.9%)
American: 142 (8.8%)
European: 81 (5.0%)
German: 43 (2.7%)
Ukrainian: 42 (2.6%)
French: 32 (2.0%)
Norwegian: 29 (1.8%)
Scottish: 28 (1.7%)
French Canadian: 24 (1.5%)
Portuguese: 24 (1.5%)
Swedish: 24 (1.5%)
Dutch: 18 (1.1%)
British: 12 (0.7%)
Belgian: 9 (0.6%)
Brazilian: 6 (0.4%)
Czechoslovakian: 4 (0.2%)
Celtic: 3 (0.2%) Most common places of birth for foreign-born residents (%): Philippines East Sandwich:
16.0% (29)Massachusetts:
0.9% (10,810)
Israel East Sandwich:
16.0% (29)Massachusetts:
0.5% (6,073)
Brazil East Sandwich:
14.4% (26)Massachusetts:
7.6% (92,959)
Italy East Sandwich:
13.3% (24)Massachusetts:
1.4% (16,886)
Armenia East Sandwich:
10.5% (19)Massachusetts:
0.2% (2,307)
Netherlands East Sandwich:
8.3% (15)Massachusetts:
0.2% (2,231)
Belgium East Sandwich:
6.6% (12)Massachusetts:
0.1% (1,245)
United Kingdom, excluding England and Scotland East Sandwich:
2.8% (5)Massachusetts:
1.0% (12,709)
England East Sandwich:
2.8% (5)Massachusetts:
0.9% (10,698)
Dominican Republic East Sandwich:
2.8% (5)Massachusetts:
8.3% (101,767)
Ireland East Sandwich:
2.2% (4)Massachusetts:
1.1% (13,446)
Place of birth for U.S.-born residents:
This state: 2,665Other state: 1,018Northeast: 524Midwest: 167South: 244West: 97 89.1% of East Sandwich residents lived in the same house 1 years ago.
Out of people who lived in different houses, 15.1% lived in this county.
Out of people who lived in different counties, 48.9% lived in Massachusetts.
East Sandwich:
89.1%State average:
87.7%
Education attainment for males 25 years and older:
No schooling: 0Nursery to 4th grade: 05th and 6th grade: 07th and 8th grade: 09th grade: 010th grade: 411th grade: 012th grade, no diploma: 0High school graduate (or equivalency): 241Less than 1 year of college: 18Some college more than 1 year, no degree: 156Associate degree: 159Bachelor's degree: 515Master's degree: 277Professional school degree: 90Doctorate degree: 33
Education attainment for females 25 years and older:
No schooling: 0Nursery to 4th grade: 05th and 6th grade: 07th and 8th grade: 09th grade: 010th grade: 011th grade: 1212th grade, no diploma: 4High school graduate (or equivalency): 156Less than 1 year of college: 74Some college more than 1 year, no degree: 168Associate degree: 179Bachelor's degree: 451Master's degree: 370Professional school degree: 71Doctorate degree: 45
Housing units in structures:
One, detached: 2,046One, attached: 33Two: 253 or 4: 820 to 49: 9Housing units lacking complete plumbing facilities in 2022: 1.1%Housing units lacking complete kitchen facilities in 2022: 1.1%House/condo owner moved in on average 14 years ago
Renter moved in on average 10 years ago
Private vs. public school enrollment:
Students in private schools in grades 1 to 8 (elementary and middle school): 2 Here:
1.1%Massachusetts:
10.3%
Students in private schools in grades 9 to 12 (high school): 36 Here:
14.6%Massachusetts:
12.3%
Students in private undergraduate colleges: 50 Here:
38.2%Massachusetts:
51.2%