Eastover, NC (North Carolina) Houses and Residents
| Eastover: | $268,376 |
| North Carolina: | $280,600 |
Mean price in 2022:
Detached houses: $312,002
Here: $312,002 State: $375,326 Mobile homes: $148,014
Here: $148,014 State: $124,933
Total population: 3,687 (Urban population: 573, Rural population: 792 (11 farm, 781 nonfarm))
Houses: 1,624 (1,428 occupied: 1,118 owner occupied, 363 renter occupied)
| % of renters here: | 25% |
| State: | 33% |
Housing density: 401 houses/condos per square mile
Median price asked for vacant for-sale houses and condos in 2022: $488,004.
Median contract rent in 2022: $747 (lower quartile is $457, upper quartile is $1,142)
Median rent asked for vacant for-rent units in 2022: $965
Median gross rent in Eastover, NC in 2022: $998
Housing units in Eastover with a mortgage: 547 (24 second mortgage, 7 home equity loan, 6 both second mortgage and home equity loan)
Houses without a mortgage: 15
Median household income for houses/condos with a mortgage: $82,857
Median household income for apartments without a mortgage: $91,692
Median monthly housing costs: $831
Compare current foreclosures near Eastover, NC:
| Photo | Address | Area | Beds / Baths | Price | Details |
|---|---|---|---|---|---|

|
#1
Firefly St
Fayetteville, NC 28306
|
1,377 sq. feet
|
1 baths 4 beds |
$255,000
|
show details |

|
#2
Rock Harbor Ln
Spring Lake, NC 28390
|
- sq. feet
|
2 baths 3 beds |
$184,900
|
show details |

|
#3
Dowfield Dr
Fayetteville, NC 28311
|
1,769 sq. feet
|
2 baths 3 beds |
show details | |

|
#4
Reedy Branch Rd
Fayetteville, NC 28312
|
1,354 sq. feet
|
2 baths 3 beds |
show details | |

|
#5
Maple Leaf Ct
Fayetteville, NC 28306
|
1,627 sq. feet
|
2 baths 3 beds |
show details | |

|
#6
Spreading Branch Rd
Hope Mills, NC 28348
|
2,789 sq. feet
|
3 baths 4 beds |
show details | |

|
#7
Lakeway Dr
Fayetteville, NC 28306
|
1,843 sq. feet
|
3 baths 4 beds |
show details | |

|
#8
Sierra Trl
Spring Lake, NC 28390
|
1,362 sq. feet
|
2 baths 3 beds |
show details | |

|
#9
Berkshire Rd
Fayetteville, NC 28304
|
1,200 sq. feet
|
2 baths 3 beds |
show details | |

|
#10
Wingate Rd
Fayetteville, NC 28304
|
1,365 sq. feet
|
2 baths 3 beds |
show details |
| Photo | Address | Area | Beds / Baths | Price | Details |
|---|---|---|---|---|---|

|
#11
Hedingham Dr
Hope Mills, NC 28348
|
1,566 sq. feet
|
2 baths 4 beds |
show details | |

|
#12
Cascade St
Fayetteville, NC 28301
|
1,654 sq. feet
|
2 baths 3 beds |
show details | |

|
#13
Tarmore Ct
Fayetteville, NC 28311
|
2,333 sq. feet
|
2 baths 4 beds |
show details | |

|
#14
Sunpointe Dr
Hope Mills, NC 28348
|
1,296 sq. feet
|
2 baths 3 beds |
show details | |

|
#15
Zepher Rd
Fayetteville, NC 28311
|
1,092 sq. feet
|
1 baths 3 beds |
show details | |

|
#16
Milford Rd
Fayetteville, NC 28303
|
1,555 sq. feet
|
2 baths 3 beds |
show details | |

|
#17
Tangletree Dr
Linden, NC 28356
|
1,460 sq. feet
|
2 baths 3 beds |
show details | |

|
#18
Home Stakes Dr
Parkton, NC 28371
|
1,919 sq. feet
|
3 baths 3 beds |
show details | |

|
#19
Wall St
Fayetteville, NC 28301
|
700 sq. feet
|
1 baths 3 beds |
show details | |

|
#20
Matchwood Ct
Fayetteville, NC 28306
|
1,586 sq. feet
|
3 baths 4 beds |
show details |
| Photo | Address | Area | Beds / Baths | Price | Details |
|---|---|---|---|---|---|

|
#21
Willborough Ave
Fayetteville, NC 28303
|
728 sq. feet
|
1 baths 3 beds |
show details | |

|
#22
Winthrop Dr
Fayetteville, NC 28311
|
1,312 sq. feet
|
1 baths 3 beds |
show details | |

|
#23
Alexwood Dr
Hope Mills, NC 28348
|
1,493 sq. feet
|
2 baths 3 beds |
show details | |

|
#24
Seabrook School Rd
Fayetteville, NC 28312
|
2,358 sq. feet
|
3 baths 3 beds |
show details | |

|
#25
Bashlot Pl
Fayetteville, NC 28303
|
2,074 sq. feet
|
2 baths 3 beds |
show details | |

|
#26
Delancy Dr
Hope Mills, NC 28348
|
2,083 sq. feet
|
3 baths 4 beds |
show details | |

|
#27
Worthington Dr
Fayetteville, NC 28304
|
1,484 sq. feet
|
2 baths 3 beds |
show details | |

|
#28
Porter Rd
Hope Mills, NC 28348
|
1,936 sq. feet
|
2 baths 3 beds |
show details | |

|
#29
Pearl St
Fayetteville, NC 28303
|
1,390 sq. feet
|
2 baths 3 beds |
show details | |

|
#30
Lake Trail Dr
Fayetteville, NC 28304
|
1,658 sq. feet
|
2 baths 3 beds |
show details |
| Photo | Address | Area | Beds / Baths | Price | Details |
|---|---|---|---|---|---|

|
#31
Goodyear Dr
Spring Lake, NC 28390
|
1,375 sq. feet
|
2 baths 3 beds |
show details | |

|
#32
Spindle Tree Dr
Fayetteville, NC 28304
|
1,353 sq. feet
|
2 baths 3 beds |
show details | |

|
#33
Sanders St
Hope Mills, NC 28348
|
836 sq. feet
|
1 baths 3 beds |
show details | |

|
#34
Blue Spring Rd
Fayetteville, NC 28304
|
1,865 sq. feet
|
2 baths 3 beds |
show details | |

|
#35
Mourning Dove Pl
Fayetteville, NC 28314
|
1,570 sq. feet
|
2 baths 3 beds |
show details | |

|
#36
Rolling Hill Rd
Fayetteville, NC 28304
|
2,000 sq. feet
|
3 baths 3 beds |
show details | |

|
#37
Lisa Cir
Spring Lake, NC 28390
|
1,404 sq. feet
|
1 baths 3 beds |
show details | |

|
#38
Ashfield Dr
Fayetteville, NC 28311
|
2,450 sq. feet
|
3 baths 3 beds |
show details | |

|
#39
Legion Rd
Hope Mills, NC 28348
|
2,374 sq. feet
|
3 baths 5 beds |
show details | |

|
#40
Newark Ave
Fayetteville, NC 28301
|
775 sq. feet
|
1 baths 3 beds |
show details |
| Photo | Address | Area | Beds / Baths | Price | Details |
|---|---|---|---|---|---|

|
#41
Spreading Branch Rd
Hope Mills, NC 28348
|
2,484 sq. feet
|
5 baths 6 beds |
show details | |

|
#42
Hewitt Dr
Fayetteville, NC 28311
|
1,381 sq. feet
|
1 baths 3 beds |
show details | |

|
#43
Eccles Dr
Fayetteville, NC 28301
|
1,330 sq. feet
|
2 baths 3 beds |
show details | |

|
#44
July Ct
Fayetteville, NC 28314
|
1,350 sq. feet
|
2 baths 3 beds |
show details | |

|
#45
Arnish Ct
Fayetteville, NC 28306
|
1,148 sq. feet
|
2 baths 3 beds |
show details | |

|
#46
Porto Pl
Fayetteville, NC 28314
|
1,468 sq. feet
|
2 baths 3 beds |
show details | |

|
#47
Wavetree Dr
Fayetteville, NC 28306
|
1,612 sq. feet
|
2 baths 3 beds |
show details | |

|
#48
Omni Ct
Fayetteville, NC 28314
|
1,618 sq. feet
|
2 baths 3 beds |
show details | |

|
#49
Inverness Dr
Fayetteville, NC 28304
|
1,603 sq. feet
|
2 baths 3 beds |
show details | |

|
Check over 1 million property listings on Foreclosure.com!
|
browse all offers | |||

Latest news about housing in Eastover, NC collected exclusively by city-data.com from local newspapers, TV, and radio stations


Median year apartment built: 1981
Household type by relationship:
Households: 3,675- Male householders: 723 (164 living alone), Female householders: 702 (169 living alone)
834 spouses (834 opposite-sex spouses), 78 unmarried partners, (78 opposite-sex unmarried partners), 1,065 children (905 natural, 146 adopted, 14 stepchildren), 111 grandchildren, 30 brothers or sisters, 19 parents, 0 foster children, 24 other relatives, 0 non-relatives
- In group quarters: 86
Size of family households: 636 2-persons, 237 3-persons, 136 4-persons, 85 5-persons, 46 6-persons.
Size of nonfamily households: 316 1-person, 34 2-persons.
605 married couples with children.
224 single-parent households (5 men, 219 women).
94.8% of residents of Eastover speak English at home.
4.7% of residents speak Spanish at home (35% speak English very well, 38% speak English well, 27% speak English not well).
0.6% of residents speak other Indo-European language at home (100% speak English very well).
Foreign born population: 89 (2.4%)
(32.6% of them are naturalized citizens)
| Here: | 6.9 |
| State: | 6.4 |
| Here: | 5.3 |
| State: | 4.4 |

- Bedrooms in owner-occupied houses and condos in Eastover, North Carolina
- 21no bedroom
- 101 bedroom
- 772 bedrooms
- 6593 bedrooms
- 3174 bedrooms
- 335+ bedrooms

- Bedrooms in renter-occupied apartments in Eastover, North Carolina
- 20no bedroom
- 01 bedroom
- 1162 bedrooms
- 1653 bedrooms
- 634 bedrooms
- 05+ bedrooms

- Cars and other vehicles available in Eastover in owner-occupied houses/condos
- 0no vehicle
- 1541 vehicle
- 5192 vehicles
- 2563 vehicles
- 714 vehicles
- 1195+ vehicles

- Cars and other vehicles available in Eastover in renter-occupied apartments
- 34no vehicle
- 1041 vehicle
- 1672 vehicles
- 453 vehicles
- 134 vehicles
- 05+ vehicles

- Rooms in owner-occupied houses in Eastover, North Carolina
- 211 room
- 02 rooms
- 103 rooms
- 414 rooms
- 795 rooms
- 3546 rooms
- 1817 rooms
- 2048 rooms
- 2299+ rooms

- Rooms in renter-occupied apartments in Eastover, North Carolina
- 201 room
- 02 rooms
- 133 rooms
- 844 rooms
- 815 rooms
- 456 rooms
- 867 rooms
- 368 rooms
- 09+ rooms


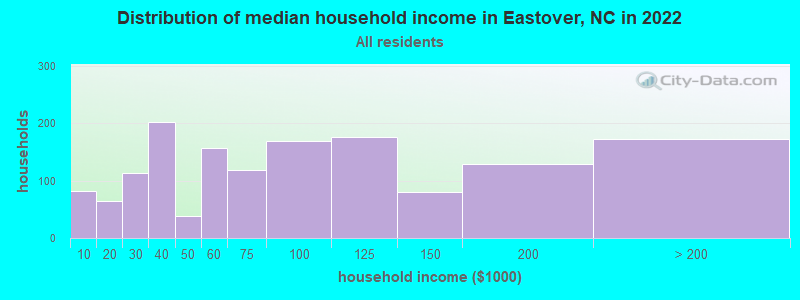
Eastover, NC household income distribution

- 82Less than $10,000
- 64$10,000 to $19,999
- 113$20,000 to $29,999
- 202$30,000 to $39,999
- 38$40,000 to $49,999
- 156$50,000 to $59,999
- 119$60,000 to $74,999
- 169$75,000 to $99,999
- 176$100,000 to $124,999
- 80$125,000 to $149,999
- 128$150,000 to $199,999
- 173$200,000 or more
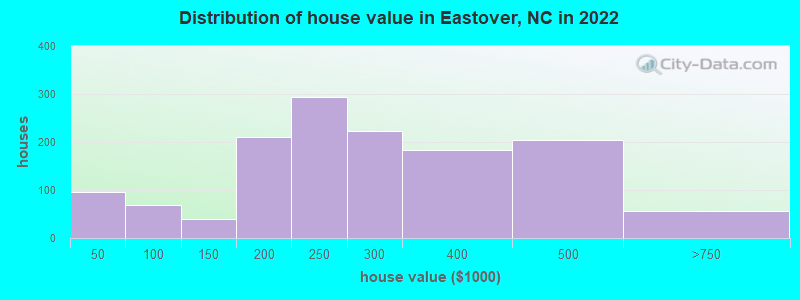
Home value of owner - occupied houses in 2022 in Eastover, NC
-
- 7Less than $10,000
- 10$20,000 to $24,999
- 14$25,000 to $29,999
- 47$30,000 to $34,999
- 14$40,000 to $49,999
- 10$60,000 to $69,999
- 20$70,000 to $79,999
- 5$80,000 to $89,999
- 17$90,000 to $99,999
- 17$100,000 to $124,999
- 22$125,000 to $149,999
- 88$150,000 to $174,999
- 122$175,000 to $199,999
- 294$200,000 to $249,999
- 223$250,000 to $299,999
- 184$300,000 to $399,999
- 205$400,000 to $499,999
- 57$500,000 to $749,999
Rent paid by renters in 2022 in Eastover, NC
-
- 9Less than $100
- 15$300 to $349
- 10$350 to $399
- 53$400 to $449
- 9$450 to $499
- 24$550 to $599
- 5$650 to $699
- 35$700 to $749
- 13$750 to $799
- 16$1,000 to $1,249
- 83$1,250 to $1,499
- 63No cash rent


Percentage of workers working in this county: 95.6%
Number of people working at home: 241 (16.2% of all workers)
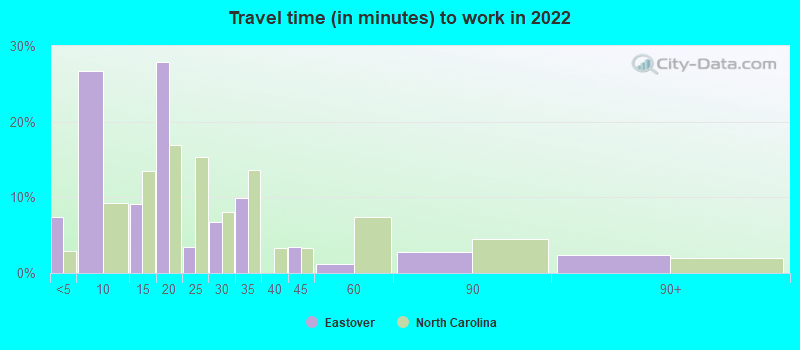
Travel time to work (commute)
- Less than 5 minutes: 137
- 5 to 9 minutes: 39
- 10 to 14 minutes: 86
- 15 to 19 minutes: 252
- 20 to 24 minutes: 282
- 25 to 29 minutes: 209
- 30 to 34 minutes: 178
- 35 to 39 minutes: 7
- 40 to 44 minutes: 67
- 45 to 59 minutes: 19
- 60 to 89 minutes: 13
- 90 or more minutes: 0
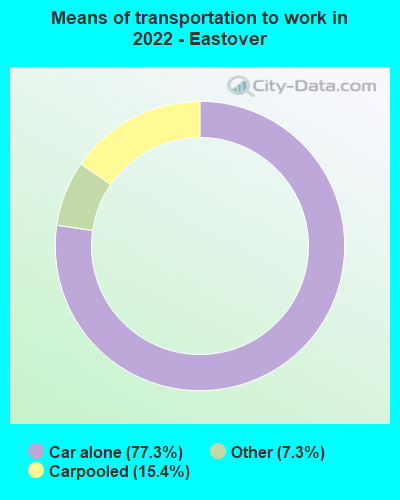
Means of transportation to work:
- Drove a car alone: 466 (58.8%)
- Carpooled: 101 (12.7%)
- Taxi: 27 (3.4%)
- Worked at home: 241 (30.4%)

- Unemployment by race in 2022
- Unemployment rate for White non-Hispanic residents
- 13.2%Males
- Unemployment rate for Black residents
- 8.0%Males

- Year of entry for the foreign-born population in Eastover, North Carolina
- 02010 or later
- 102000 to 2009
- 521990 to 1999
- 01980 to 1989
- 01970 to 1979
- 14Before 1970

First ancestries reported:
- English: 464 (23.3%)
- American: 311 (15.6%)
- European: 162 (8.1%)
- Scottish: 128 (6.4%)
- German: 107 (5.4%)
- Irish: 101 (5.1%)
- Scotch-Irish: 72 (3.6%)
- Hungarian: 34 (1.7%)
- Polish: 15 (0.8%)
- French: 13 (0.7%)
- British: 11 (0.6%)
- Jamaican: 8 (0.4%)
Most common places of birth for foreign-born residents (%):
| Eastover: | 49.4% (44) |
| North Carolina: | 24.7% (214,776) |
| Eastover: | 12.4% (11) |
| North Carolina: | 0.9% (7,765) |
| Eastover: | 11.2% (10) |
| North Carolina: | 1.8% (15,534) |
| Eastover: | 9.0% (8) |
| North Carolina: | 1.3% (11,419) |
| Eastover: | 7.9% (7) |
| North Carolina: | 0.7% (5,941) |
Place of birth for U.S.-born residents:
- This state: 2,619
- Other state: 853
- Northeast: 146
- Midwest: 252
- South: 385
- West: 76
95.3% of Eastover residents lived in the same house 1 years ago.
Out of people who lived in different houses, 48.3% lived in this county.
Out of people who lived in different counties, 100.0% lived in North Carolina.
| Eastover: | 95.3% |
| State average: | 87.3% |
Education attainment for males 25 years and older:
- No schooling: 0
- Nursery to 4th grade: 0
- 5th and 6th grade: 0
- 7th and 8th grade: 2
- 9th grade: 0
- 10th grade: 17
- 11th grade: 8
- 12th grade, no diploma: 37
- High school graduate (or equivalency): 418
- Less than 1 year of college: 161
- Some college more than 1 year, no degree: 120
- Associate degree: 117
- Bachelor's degree: 349
- Master's degree: 66
- Professional school degree: 0
- Doctorate degree: 27

Education attainment for females 25 years and older:
- No schooling: 0
- Nursery to 4th grade: 0
- 5th and 6th grade: 0
- 7th and 8th grade: 0
- 9th grade: 31
- 10th grade: 0
- 11th grade: 0
- 12th grade, no diploma: 38
- High school graduate (or equivalency): 296
- Less than 1 year of college: 60
- Some college more than 1 year, no degree: 224
- Associate degree: 187
- Bachelor's degree: 147
- Master's degree: 210
- Professional school degree: 12
- Doctorate degree: 85


Housing units in structures:
- One, detached: 1,328
- One, attached: 29
- 20 to 49: 59
- Mobile homes: 197
- Boats, RVs, vans, etc.: 10
Housing units lacking complete kitchen facilities in 2022: 8.1%
House/condo owner moved in on average 13 years ago
Renter moved in on average 6 years ago

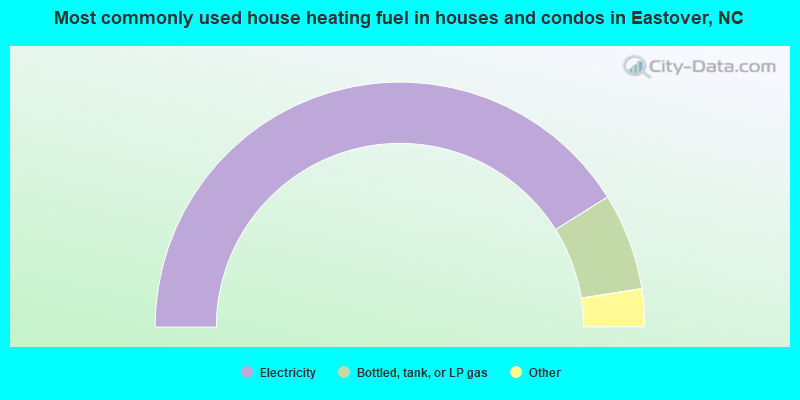
- 82.3%Electricity
- 12.8%Bottled, tank, or LP gas
- 3.7%Utility gas
- 1.2%No fuel used
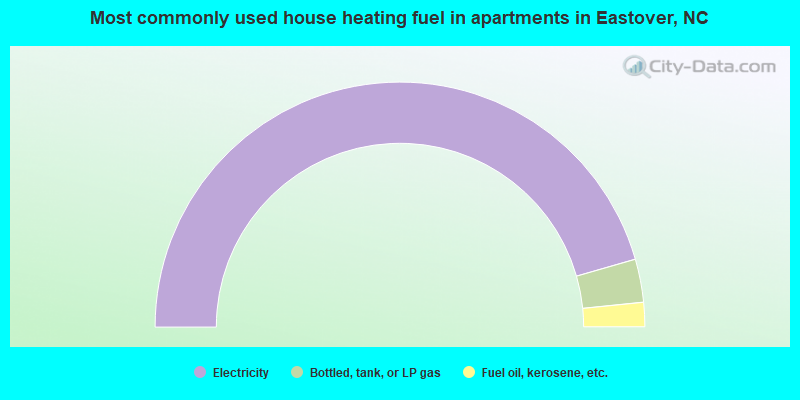
- 91.1%Electricity
- 5.7%Bottled, tank, or LP gas
- 3.2%Fuel oil, kerosene, etc.
Private vs. public school enrollment:
| Here: | 14.6% |
| North Carolina: | 13.8% |
| Here: | 17.2% |
| North Carolina: | 11.9% |
| Here: | 0.0% |
| North Carolina: | 19.3% |


