Eau Claire, MI (Michigan) Houses and Residents
| Eau Claire: | $150,587 |
| Michigan: | $224,400 |
Mean price in 2022:
Detached houses: $156,022
Here: $156,022 State: $280,038 Townhouses or other attached units: $230,533
Here: $230,533 State: $239,520
Total population: 621 (Urban population: 576 (all inside urban clusters), Rural population: 95 (all nonfarm))
Houses: 232 (217 occupied: 171 owner occupied, 43 renter occupied)
| % of renters here: | 20% |
| State: | 27% |
Housing density: 319 houses/condos per square mile
Median price asked for vacant for-sale houses and condos in 2022 in this county: $272,552.
Median contract rent in 2022: $731 (lower quartile is $709, upper quartile is $898)
Median rent asked for vacant for-rent units in 2022: $741
Median gross rent in Eau Claire, MI in 2022: $933
Housing units in Eau Claire with a mortgage: 93 (11 second mortgage, 0 home equity loan, 0 both second mortgage and home equity loan)
Houses without a mortgage: 0
Median household income for houses/condos with a mortgage: $72,849
Median household income for apartments without a mortgage: $38,623
Median monthly housing costs: $877
Compare current foreclosures near Eau Claire, MI:
| Photo | Address | Area | Beds / Baths | Price | Details |
|---|---|---|---|---|---|

|
#1
Porter Dr
Eau Claire, MI 49111
|
1,352 sq. feet
|
2 baths 3 beds |
show details | |

|
#2
S Maple St
Eau Claire, MI 49111
|
- sq. feet
|
- baths - beds |
show details | |

|
#3
Fairview Rd
Eau Claire, MI 49111
|
- sq. feet
|
- baths - beds |
show details | |

|
#4
E Ivy Ct
Eau Claire, MI 49111
|
- sq. feet
|
- baths - beds |
show details | |

|
#5
Jeffrey Ln
Niles, MI 49120
|
1,623 sq. feet
|
2 baths 2 beds |
show details | |

|
#6
Bishop Ave
Benton Harbor, MI 49022
|
1,040 sq. feet
|
1 baths 4 beds |
show details | |

|
#7
Plimpton Ave
Benton Harbor, MI 49022
|
720 sq. feet
|
1 baths 1 beds |
show details | |

|
#8
Wedgewood Rd
Saint Joseph, MI 49085
|
1,847 sq. feet
|
2 baths 3 beds |
show details | |

|
#9
Pine St
Niles, MI 49120
|
1,800 sq. feet
|
3 baths 3 beds |
show details | |

|
#10
N Cayuga St
Buchanan, MI 49107
|
- sq. feet
|
2 baths 4 beds |
show details |
| Photo | Address | Area | Beds / Baths | Price | Details |
|---|---|---|---|---|---|

|
#11
S 3rd St
Niles, MI 49120
|
1,762 sq. feet
|
2 baths 3 beds |
show details | |

|
#12
W Us Highway 12
Buchanan, MI 49107
|
1,484 sq. feet
|
2 baths 3 beds |
show details | |

|
#13
Glenwood Rd
Dowagiac, MI 49047
|
1,856 sq. feet
|
2 baths 3 beds |
show details | |

|
#14
Leach Rd
Dowagiac, MI 49047
|
1,213 sq. feet
|
1 baths 2 beds |
show details | |

|
#15
Fair Oaks St E
Niles, MI 49120
|
900 sq. feet
|
1 baths 1 beds |
show details | |

|
#16
Elm St
Dowagiac, MI 49047
|
1,219 sq. feet
|
2 baths 4 beds |
show details | |

|
#17
Graham St
Cassopolis, MI 49031
|
1,184 sq. feet
|
1 baths 2 beds |
show details | |

|
#18
Lake Rd
Coloma, MI 49038
|
- sq. feet
|
1 baths 4 beds |
show details | |

|
#19
Lily Rd
South Bend, IN 46637
|
1,768 sq. feet
|
2 baths 3 beds |
show details | |

|
#20
Pencross Dr
Granger, IN 46530
|
2,885 sq. feet
|
4 baths 5 beds |
show details |
| Photo | Address | Area | Beds / Baths | Price | Details |
|---|---|---|---|---|---|

|
#21
Myrtle Ave
South Bend, IN 46637
|
1,809 sq. feet
|
2 baths 4 beds |
show details | |

|
#22
N Prospect Ct
Watervliet, MI 49098
|
- sq. feet
|
2 baths 3 beds |
show details | |

|
#23
N Street
Cassopolis, MI 49031
|
- sq. feet
|
2 baths 3 beds |
show details | |

|
#24
Defield Rd
Coloma, MI 49038
|
- sq. feet
|
1 baths 2 beds |
show details | |

|
#25
67th St
Dowagiac, MI 49047
|
- sq. feet
|
1 baths 2 beds |
show details | |

|
#26
Herbert St
Niles, MI 49120
|
- sq. feet
|
1 baths 4 beds |
show details | |

|
#27
Roslyn Rd
Benton Harbor, MI 49022
|
- sq. feet
|
2 baths 3 beds |
show details | |

|
#28
Orchard St
South Bend, IN 46637
|
1,632 sq. feet
|
1 baths 3 beds |
show details | |

|
#29
Helmen Ave
South Bend, IN 46637
|
1,208 sq. feet
|
1 baths 3 beds |
show details | |

|
#30
Parisian Dr
South Bend, IN 46637
|
1,590 sq. feet
|
2 baths 3 beds |
show details |
| Photo | Address | Area | Beds / Baths | Price | Details |
|---|---|---|---|---|---|

|
#31
Hurd Ave
Benton Harbor, MI 49022
|
- sq. feet
|
1 baths 2 beds |
show details | |

|
#32
Auten Rd
South Bend, IN 46637
|
1,068 sq. feet
|
1 baths 3 beds |
show details | |

|
#33
Garr Rd
Buchanan, MI 49107
|
- sq. feet
|
1 baths 3 beds |
show details | |

|
#34
Thresher Ave
Benton Harbor, MI 49022
|
- sq. feet
|
- baths - beds |
show details | |

|
#35
Eloise Dr
Benton Harbor, MI 49022
|
- sq. feet
|
- baths - beds |
show details | |

|
#36
Bond St Apt 1
Niles, MI 49120
|
- sq. feet
|
- baths - beds |
show details | |

|
#37
Church St # 1
Saint Joseph, MI 49085
|
- sq. feet
|
- baths - beds |
show details | |

|
#38
Woods Edge Dr
Niles, MI 49120
|
- sq. feet
|
- baths - beds |
show details | |

|
#39
Lakeshore Dr
Saint Joseph, MI 49085
|
- sq. feet
|
- baths - beds |
show details | |

|
#40
Mobile Blvd Lot 56
Niles, MI 49120
|
- sq. feet
|
- baths - beds |
show details |
| Photo | Address | Area | Beds / Baths | Price | Details |
|---|---|---|---|---|---|

|
#41
Mobile Blvd # 7
Niles, MI 49120
|
- sq. feet
|
- baths - beds |
show details | |

|
#42
Sanctuary Dr
Stevensville, MI 49127
|
- sq. feet
|
- baths - beds |
show details | |

|
#43
N Shore Dr
Benton Harbor, MI 49022
|
- sq. feet
|
- baths - beds |
show details | |

|
#44
Edgecumbe Ave
Benton Harbor, MI 49022
|
- sq. feet
|
- baths - beds |
show details | |

|
#45
Mannix St
Niles, MI 49120
|
- sq. feet
|
- baths - beds |
show details | |

|
#46
W Front St Apt 58
Buchanan, MI 49107
|
- sq. feet
|
- baths - beds |
show details | |

|
#47
Vineyard Ave
Benton Harbor, MI 49022
|
- sq. feet
|
- baths - beds |
show details | |

|
#48
Thresher Ave
Benton Harbor, MI 49022
|
- sq. feet
|
- baths - beds |
show details | |

|
#49
Chippewa St
Niles, MI 49120
|
- sq. feet
|
- baths - beds |
show details | |

|
Check over 1 million property listings on Foreclosure.com!
|
browse all offers | |||


 | Since everyone else is doing it . . . (51 replies) |
| Menominee (35 replies) |
| Michigan ranked as third-worst state for business by CEOs (51 replies) |

Median year apartment built: 1953
Household type by relationship:
Households: 599- Male householders: 126 (57 living alone), Female householders: 88 (17 living alone)
102 spouses (102 opposite-sex spouses), 35 unmarried partners, (35 opposite-sex unmarried partners), 197 children (190 natural, 1 adopted, 4 stepchildren), 9 grandchildren, 8 brothers or sisters, 14 parents, 0 foster children, 1 other relatives, 13 non-relatives
Size of family households: 24 2-persons, 46 3-persons, 30 4-persons, 13 5-persons, 7 6-persons.
Size of nonfamily households: 79 1-person, 18 2-persons.
111 married couples with children.
35 single-parent households (9 men, 26 women).
85.7% of residents of Eau Claire speak English at home.
10.5% of residents speak Spanish at home (59% speak English very well, 18% speak English well, 23% speak English not well).
3.2% of residents speak other language at home (100% speak English very well).
Foreign born population: 46 (7.7%)
(10.9% of them are naturalized citizens)
| Here: | 5.3 |
| State: | 6.5 |
| Here: | 5.1 |
| State: | 4.3 |

- Bedrooms in owner-occupied houses and condos in Eau Claire, Michigan
- 2no bedroom
- 01 bedroom
- 422 bedrooms
- 943 bedrooms
- 314 bedrooms
- 35+ bedrooms

- Bedrooms in renter-occupied apartments in Eau Claire, Michigan
- 0no bedroom
- 61 bedroom
- 162 bedrooms
- 183 bedrooms
- 44 bedrooms
- 05+ bedrooms

- Cars and other vehicles available in Eau Claire in owner-occupied houses/condos
- 6no vehicle
- 301 vehicle
- 782 vehicles
- 523 vehicles
- 34 vehicles
- 35+ vehicles

- Cars and other vehicles available in Eau Claire in renter-occupied apartments
- 0no vehicle
- 231 vehicle
- 172 vehicles
- 43 vehicles
- 04 vehicles
- 05+ vehicles

- Rooms in owner-occupied houses in Eau Claire, Michigan
- 21 room
- 02 rooms
- 13 rooms
- 254 rooms
- 635 rooms
- 326 rooms
- 257 rooms
- 118 rooms
- 139+ rooms

- Rooms in renter-occupied apartments in Eau Claire, Michigan
- 01 room
- 62 rooms
- 03 rooms
- 164 rooms
- 05 rooms
- 126 rooms
- 67 rooms
- 38 rooms
- 19+ rooms


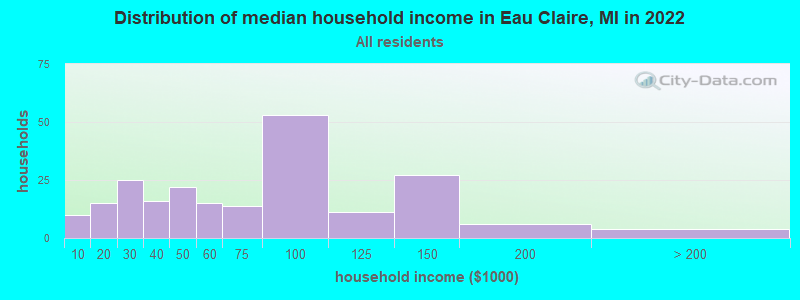
Eau Claire, MI household income distribution

- 10Less than $10,000
- 15$10,000 to $19,999
- 25$20,000 to $29,999
- 16$30,000 to $39,999
- 22$40,000 to $49,999
- 15$50,000 to $59,999
- 14$60,000 to $74,999
- 53$75,000 to $99,999
- 11$100,000 to $124,999
- 27$125,000 to $149,999
- 6$150,000 to $199,999
- 4$200,000 or more
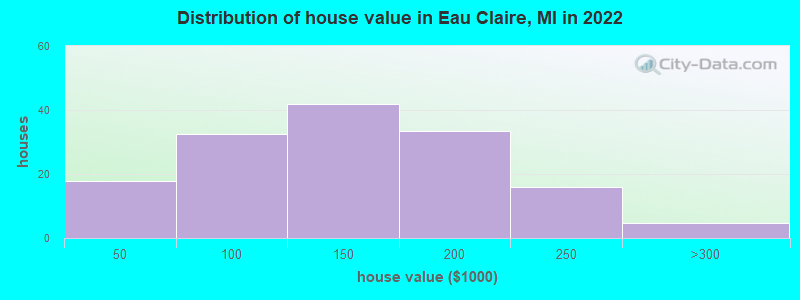
Home value of owner - occupied houses in 2022 in Eau Claire, MI
-
- 4Less than $10,000
- 5$15,000 to $19,999
- 2$20,000 to $24,999
- 1$25,000 to $29,999
- 4$40,000 to $49,999
- 4$50,000 to $59,999
- 1$60,000 to $69,999
- 8$70,000 to $79,999
- 9$80,000 to $89,999
- 4$90,000 to $99,999
- 15$100,000 to $124,999
- 26$125,000 to $149,999
- 16$150,000 to $174,999
- 17$175,000 to $199,999
- 15$200,000 to $249,999
- 4$250,000 to $299,999
Rent paid by renters in 2022 in Eau Claire, MI
-
- 6$450 to $499
- 20$700 to $749
- 2$800 to $899
- 5$900 to $999
- 2$1,000 to $1,249
- 3No cash rent


Percentage of workers working in this county: 88.8%
Number of people working at home: 5 (1.7% of all workers)
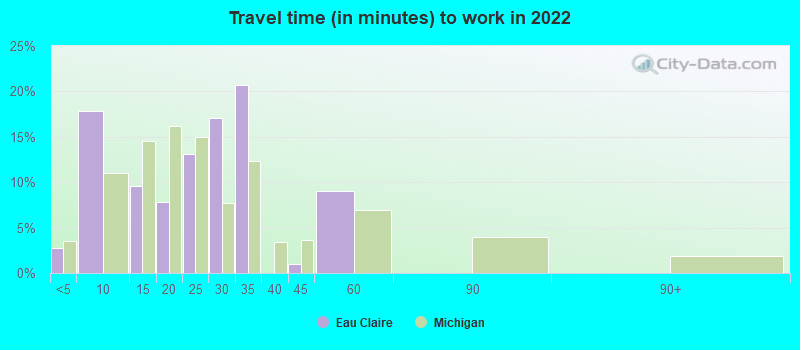
Travel time to work (commute)
- Less than 5 minutes: 21
- 5 to 9 minutes: 33
- 10 to 14 minutes: 35
- 15 to 19 minutes: 35
- 20 to 24 minutes: 30
- 25 to 29 minutes: 42
- 30 to 34 minutes: 40
- 35 to 39 minutes: 4
- 40 to 44 minutes: 19
- 45 to 59 minutes: 17
- 60 to 89 minutes: 0
- 90 or more minutes: 0
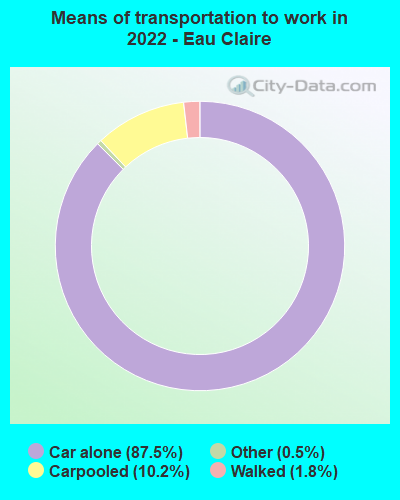
Means of transportation to work:
- Drove a car alone: 462 (81.5%)
- Carpooled: 74 (13.1%)
- Taxi: 2 (0.4%)
- Walked: 9 (1.6%)
- Worked at home: 5 (0.9%)

- Unemployment by race in 2022
- Unemployment rate for White non-Hispanic residents
- 4.1%Males
- 1.7%Females

- Year of entry for the foreign-born population in Eau Claire, Michigan
- 112010 or later
- 22000 to 2009
- 211990 to 1999
- 41980 to 1989
- 01970 to 1979
- 2Before 1970

First ancestries reported:
- German: 54 (25.5%)
- Finnish: 24 (11.3%)
- European: 23 (10.8%)
- American: 4 (1.9%)
- Northern European: 3 (1.4%)
- English: 2 (0.9%)
- French Canadian: 2 (0.9%)
- Ugandan: 2 (0.9%)
- Dutch: 1 (0.5%)
- Irish: 1 (0.5%)
- Polish: 1 (0.5%)
- Scottish: 1 (0.5%)
Most common places of birth for foreign-born residents (%):
| Eau Claire: | 54.9% (28) |
| Michigan: | 10.9% (75,965) |
| Eau Claire: | 21.6% (11) |
| Michigan: | 0.1% (835) |
| Eau Claire: | 3.9% (2) |
| Michigan: | 0.5% (3,489) |
Place of birth for U.S.-born residents:
- This state: 414
- Other state: 129
- Northeast: 15
- Midwest: 69
- South: 36
- West: 8
91.9% of Eau Claire residents lived in the same house 1 years ago.
Out of people who lived in different houses, 43.0% lived in this county.
Out of people who lived in different counties, 18.2% lived in Michigan.
| Eau Claire: | 91.9% |
| State average: | 88.4% |
Education attainment for males 25 years and older:
- No schooling: 0
- Nursery to 4th grade: 0
- 5th and 6th grade: 0
- 7th and 8th grade: 3
- 9th grade: 1
- 10th grade: 2
- 11th grade: 1
- 12th grade, no diploma: 4
- High school graduate (or equivalency): 74
- Less than 1 year of college: 10
- Some college more than 1 year, no degree: 23
- Associate degree: 32
- Bachelor's degree: 32
- Master's degree: 28
- Professional school degree: 0
- Doctorate degree: 12

Education attainment for females 25 years and older:
- No schooling: 0
- Nursery to 4th grade: 0
- 5th and 6th grade: 0
- 7th and 8th grade: 8
- 9th grade: 0
- 10th grade: 0
- 11th grade: 0
- 12th grade, no diploma: 4
- High school graduate (or equivalency): 25
- Less than 1 year of college: 16
- Some college more than 1 year, no degree: 24
- Associate degree: 16
- Bachelor's degree: 32
- Master's degree: 29
- Professional school degree: 0
- Doctorate degree: 0


Housing units in structures:
- One, detached: 196
- One, attached: 7
- Two: 1
- 3 or 4: 23
- Mobile homes: 4
House/condo owner moved in on average 7 years ago
Renter moved in on average 3 years ago

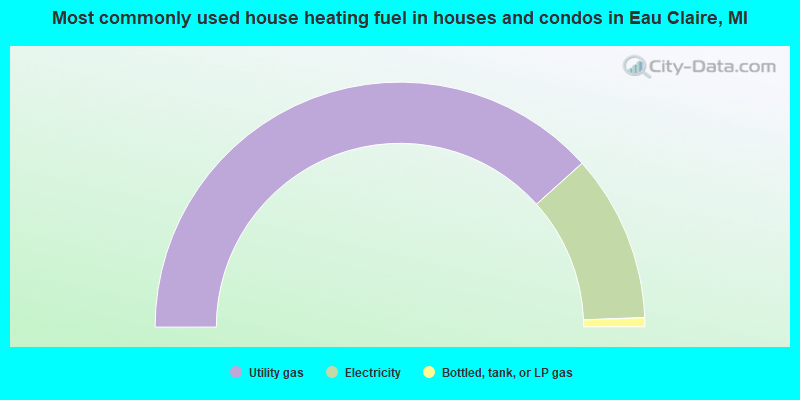
- 76.7%Utility gas
- 22.1%Electricity
- 1.2%Bottled, tank, or LP gas
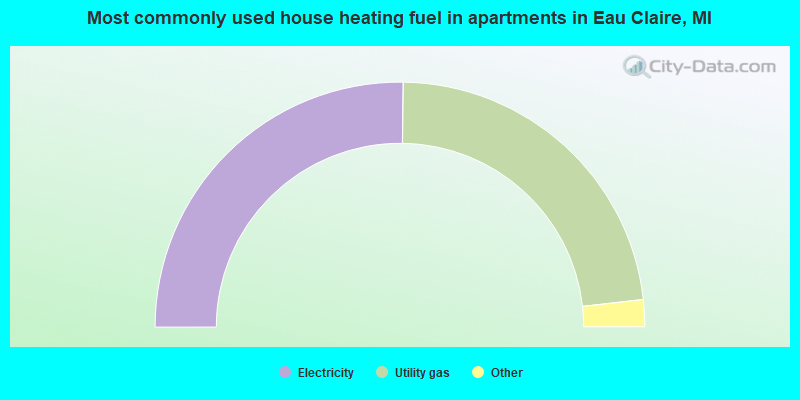
- 52.3%Electricity
- 47.7%Utility gas
Private vs. public school enrollment:
| Here: | 3.2% |
| Michigan: | 12.4% |
| Here: | 26.7% |
| Michigan: | 9.8% |
| Here: | 0.0% |
| Michigan: | 14.9% |


