Edinburgh, IN (Indiana) Houses and Residents
| Edinburgh: | $153,758 |
| Indiana: | $208,700 |
Mean price in 2022:
Detached houses: $148,106
Here: $148,106 State: $257,916 Mobile homes: $21,687
Here: $21,687 State: $67,116
Total population: 4,533 (All urban)
Houses: 2,065 (1,810 occupied: 1,001 owner occupied, 830 renter occupied)
| % of renters here: | 45% |
| State: | 29% |
Housing density: 726 houses/condos per square mile
Median price asked for vacant for-sale houses and condos in 2022: $261,274.
Median contract rent in 2022: $614 (lower quartile is $539, upper quartile is $754)
Median rent asked for vacant for-rent units in 2022: $610
Median gross rent in Edinburgh, IN in 2022: $801
Housing units in Edinburgh with a mortgage: 692 (56 second mortgage, 0 home equity loan, 41 both second mortgage and home equity loan)
Houses without a mortgage: 23
Median household income for houses/condos with a mortgage: $73,810
Median household income for apartments without a mortgage: $38,120
Median monthly housing costs: $841
Compare current foreclosures near Edinburgh, IN:
| Photo | Address | Area | Beds / Baths | Price | Details |
|---|---|---|---|---|---|

|
#1
N Walnut St
Edinburgh, IN 46124
|
2,430 sq. feet
|
1 baths 3 beds |
show details | |

|
#2
W Center Cross St
Edinburgh, IN 46124
|
1,168 sq. feet
|
1 baths 3 beds |
show details | |

|
#3
W Center Cross St
Edinburgh, IN 46124
|
1,008 sq. feet
|
1 baths 2 beds |
show details | |

|
#4
N Fairmount Dr
Edinburgh, IN 46124
|
1,488 sq. feet
|
2 baths 3 beds |
show details | |

|
#5
Middle Park Dr
Edinburgh, IN 46124
|
1,288 sq. feet
|
1 baths 3 beds |
show details | |

|
#6
N Grant St
Edinburgh, IN 46124
|
1,476 sq. feet
|
2 baths 2 beds |
show details | |

|
#7
N Us Highway 31, Trlr 48
Edinburgh, IN 46124
|
- sq. feet
|
- baths - beds |
show details | |

|
#8
E 800 N
Edinburgh, IN 46124
|
- sq. feet
|
- baths - beds |
show details | |

|
#9
E Park Dr
Edinburgh, IN 46124
|
- sq. feet
|
- baths - beds |
show details | |

|
#10
Prosser Dr Lot 4
Edinburgh, IN 46124
|
- sq. feet
|
- baths - beds |
show details |
| Photo | Address | Area | Beds / Baths | Price | Details |
|---|---|---|---|---|---|

|
#11
N Us Highway 31, Trlr 61
Edinburgh, IN 46124
|
- sq. feet
|
- baths - beds |
show details | |

|
#12
E Thompson St
Edinburgh, IN 46124
|
- sq. feet
|
- baths - beds |
show details | |

|
#13
Saint Andrews Ave
Edinburgh, IN 46124
|
- sq. feet
|
- baths - beds |
show details | |

|
#14
Franklin St
Edinburgh, IN 46124
|
- sq. feet
|
- baths - beds |
show details | |

|
#15
Prosser Dr Lot 16
Edinburgh, IN 46124
|
- sq. feet
|
- baths - beds |
show details | |

|
#16
White Oak Ln
Edinburgh, IN 46124
|
- sq. feet
|
- baths - beds |
show details | |

|
#17
Sycamore St
Columbus, IN 47201
|
1,296 sq. feet
|
1 baths 3 beds |
$89,900
|
show details |

|
#18
N Us Highway 31
Edinburgh, IN 46124
|
- sq. feet
|
- baths - beds |
show details | |

|
#19
S Walnut St
Edinburgh, IN 46124
|
- sq. feet
|
- baths - beds |
show details | |

|
#20
16th St
Columbus, IN 47201
|
1,008 sq. feet
|
1 baths 2 beds |
show details |
| Photo | Address | Area | Beds / Baths | Price | Details |
|---|---|---|---|---|---|

|
#21
Larimar Dr
Whiteland, IN 46184
|
3,253 sq. feet
|
4 baths 5 beds |
show details | |

|
#22
Della Rd
Columbus, IN 47203
|
720 sq. feet
|
1 baths 2 beds |
show details | |

|
#23
Bridlewood Dr
Franklin, IN 46131
|
2,472 sq. feet
|
2 baths 3 beds |
show details | |

|
#24
S Peoga Rd
Trafalgar, IN 46181
|
680 sq. feet
|
1 baths 2 beds |
show details | |

|
#25
Western Ct
Shelbyville, IN 46176
|
1,626 sq. feet
|
2 baths 3 beds |
show details | |

|
#26
Taylor Rd
Columbus, IN 47203
|
1,459 sq. feet
|
2 baths 3 beds |
show details | |

|
#27
Hillcrest Dr
Shelbyville, IN 46176
|
2,341 sq. feet
|
2 baths 5 beds |
show details | |

|
#28
Della Rd
Columbus, IN 47203
|
712 sq. feet
|
1 baths 2 beds |
show details | |

|
#29
Cobra Dr
Franklin, IN 46131
|
1,641 sq. feet
|
3 baths 3 beds |
show details | |

|
#30
E 200 N
Franklin, IN 46131
|
2,559 sq. feet
|
2 baths 4 beds |
show details |
| Photo | Address | Area | Beds / Baths | Price | Details |
|---|---|---|---|---|---|

|
#31
W 200 S
Columbus, IN 47201
|
3,468 sq. feet
|
2 baths 3 beds |
show details | |

|
#32
Kentucky Ave
Columbus, IN 47201
|
936 sq. feet
|
1 baths 3 beds |
show details | |

|
#33
Turning Leaf Dr
Franklin, IN 46131
|
2,785 sq. feet
|
2 baths 3 beds |
show details | |

|
#34
Spring Meadow Ct
Franklin, IN 46131
|
1,252 sq. feet
|
2 baths 3 beds |
show details | |

|
#35
Harvest Ridge Cir
Franklin, IN 46131
|
1,920 sq. feet
|
2 baths 3 beds |
show details | |

|
#36
N Nelson Ridge Rd
Columbus, IN 47201
|
1,816 sq. feet
|
1 baths 3 beds |
show details | |

|
#37
S 130 W
Columbus, IN 47201
|
1,296 sq. feet
|
1 baths 3 beds |
show details | |

|
#38
Sprunica Rd
Nineveh, IN 46164
|
1,760 sq. feet
|
1 baths 3 beds |
show details | |

|
#39
S 500 W
Trafalgar, IN 46181
|
1,792 sq. feet
|
2 baths 3 beds |
show details | |

|
#40
Lakecrest Dr
Columbus, IN 47201
|
1,607 sq. feet
|
2 baths 3 beds |
show details |
| Photo | Address | Area | Beds / Baths | Price | Details |
|---|---|---|---|---|---|

|
#41
N Aberdeen Dr
Franklin, IN 46131
|
1,494 sq. feet
|
2 baths 3 beds |
show details | |

|
#42
E 350 N
Needham, IN 46162
|
960 sq. feet
|
1 baths 2 beds |
show details | |

|
#43
Woodfield Blvd
Franklin, IN 46131
|
1,786 sq. feet
|
2 baths 3 beds |
show details | |

|
#44
Lakecrest Dr
Columbus, IN 47201
|
1,808 sq. feet
|
2 baths 3 beds |
show details | |

|
#45
Della Rd
Columbus, IN 47203
|
1,152 sq. feet
|
2 baths 3 beds |
show details | |

|
#46
E Lake Shore Dr S
Hope, IN 47246
|
2,912 sq. feet
|
2 baths 4 beds |
show details | |

|
#47
W 250 S
Shelbyville, IN 46176
|
1,123 sq. feet
|
2 baths 3 beds |
show details | |

|
#48
N Brooks St
Columbus, IN 47201
|
1,972 sq. feet
|
1 baths 3 beds |
show details | |

|
#49
Schaefer Dr
Hope, IN 47246
|
960 sq. feet
|
1 baths 3 beds |
show details | |

|
Check over 1 million property listings on Foreclosure.com!
|
browse all offers | |||

Latest news about housing in Edinburgh, IN collected exclusively by city-data.com from local newspapers, TV, and radio stations

 | Blues restaurant at Fashion Mall (22 replies) |
| Investing in Richmond old houses (13 replies) |
| Housing suggestion for South Indy (14 replies) |
| possible job in Edinburgh...but looks like a dangerous place!!! (13 replies) |
| Affordable areas to live (5 replies) |
| Retire in Greenwood/Franklin, Columbus, Newburgh/Chandler, New Albany/Georgetown/Lanesville, Sellersburg, Madison, IN? (17 replies) |

Median year apartment built: 1963
Household type by relationship:
Households: 4,242- Male householders: 949 (328 living alone), Female householders: 840 (280 living alone)
699 spouses (699 opposite-sex spouses), 182 unmarried partners, (182 opposite-sex unmarried partners), 1,120 children (1,003 natural, 22 adopted, 95 stepchildren), 106 grandchildren, 0 brothers or sisters, 24 parents, 0 foster children, 75 other relatives, 242 non-relatives
Size of family households: 391 2-persons, 307 3-persons, 227 4-persons, 59 5-persons, 82 6-persons.
Size of nonfamily households: 714 1-person, 88 2-persons.
389 married couples with children.
182 single-parent households (22 men, 160 women).
98.3% of residents of Edinburgh speak English at home.
0.2% of residents speak Spanish at home (100% speak English very well).
0.4% of residents speak other Indo-European language at home (100% speak English very well).
Foreign born population: 19 (0.4%)
(78.9% of them are naturalized citizens)
| Here: | 6.1 |
| State: | 6.6 |
| Here: | 4.0 |
| State: | 4.3 |

- Bedrooms in owner-occupied houses and condos in Edinburgh, Indiana
- 0no bedroom
- 231 bedroom
- 2812 bedrooms
- 5073 bedrooms
- 1814 bedrooms
- 95+ bedrooms

- Bedrooms in renter-occupied apartments in Edinburgh, Indiana
- 0no bedroom
- 1931 bedroom
- 4432 bedrooms
- 1753 bedrooms
- 204 bedrooms
- 05+ bedrooms

- Cars and other vehicles available in Edinburgh in owner-occupied houses/condos
- 51no vehicle
- 2421 vehicle
- 3972 vehicles
- 2393 vehicles
- 724 vehicles
- 05+ vehicles

- Cars and other vehicles available in Edinburgh in renter-occupied apartments
- 57no vehicle
- 4891 vehicle
- 2232 vehicles
- 453 vehicles
- 174 vehicles
- 05+ vehicles

- Rooms in owner-occupied houses in Edinburgh, Indiana
- 01 room
- 02 rooms
- 193 rooms
- 1024 rooms
- 2055 rooms
- 3296 rooms
- 1067 rooms
- 1648 rooms
- 769+ rooms
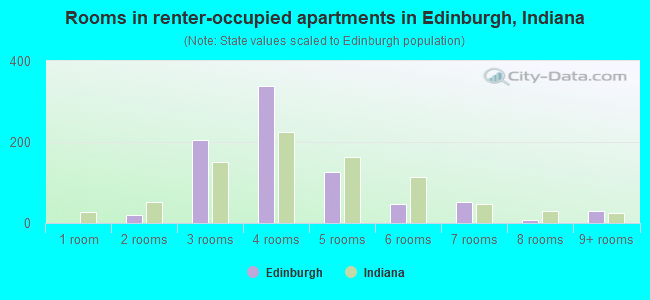
- Rooms in renter-occupied apartments in Edinburgh, Indiana
- 01 room
- 192 rooms
- 2063 rooms
- 3394 rooms
- 1265 rooms
- 486 rooms
- 537 rooms
- 88 rooms
- 309+ rooms


Edinburgh, IN household income distribution

- 18Less than $10,000
- 202$10,000 to $19,999
- 181$20,000 to $29,999
- 181$30,000 to $39,999
- 274$40,000 to $49,999
- 205$50,000 to $59,999
- 208$60,000 to $74,999
- 401$75,000 to $99,999
- 115$100,000 to $124,999
- 48$125,000 to $149,999
- 47$150,000 to $199,999
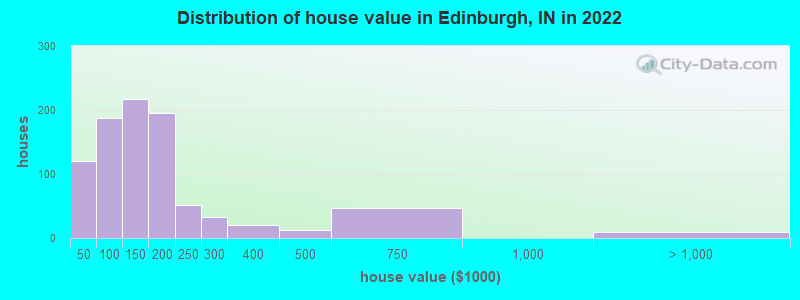
Home value of owner - occupied houses in 2022 in Edinburgh, IN
-
- 105Less than $10,000
- 14$15,000 to $19,999
- 33$70,000 to $79,999
- 43$80,000 to $89,999
- 111$90,000 to $99,999
- 105$100,000 to $124,999
- 110$125,000 to $149,999
- 110$150,000 to $174,999
- 85$175,000 to $199,999
- 50$200,000 to $249,999
- 32$250,000 to $299,999
- 19$300,000 to $399,999
- 12$400,000 to $499,999
- 46$500,000 to $749,999
- 8$2,000,000 or more
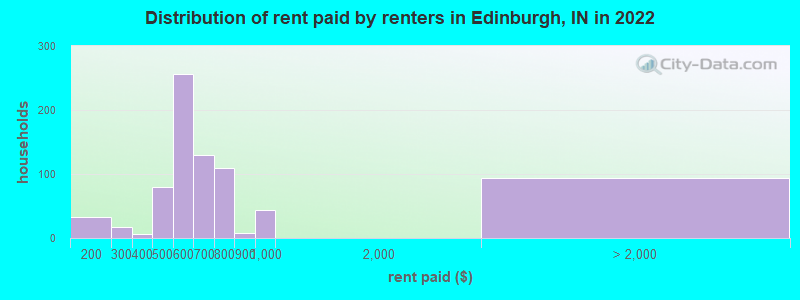
Rent paid by renters in 2022 in Edinburgh, IN
-
- 32$150 to $199
- 17$250 to $299
- 7$350 to $399
- 55$400 to $449
- 24$450 to $499
- 105$500 to $549
- 150$550 to $599
- 72$600 to $649
- 56$650 to $699
- 27$700 to $749
- 81$750 to $799
- 8$800 to $899
- 43$900 to $999
- 92No cash rent

Percentage of workers working in this county: 47.5%
Number of people working at home: 247 (11.2% of all workers)
Travel time to work (commute)
- Less than 5 minutes: 132
- 5 to 9 minutes: 435
- 10 to 14 minutes: 356
- 15 to 19 minutes: 283
- 20 to 24 minutes: 111
- 25 to 29 minutes: 139
- 30 to 34 minutes: 104
- 35 to 39 minutes: 69
- 40 to 44 minutes: 109
- 45 to 59 minutes: 192
- 60 to 89 minutes: 25
- 90 or more minutes: 36
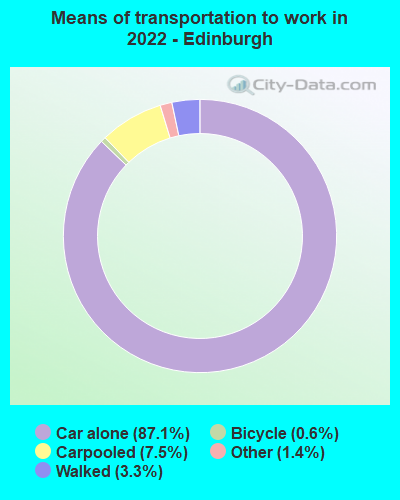
Means of transportation to work:
- Drove a car alone: 1,896 (77.2%)
- Carpooled: 181 (7.4%)
- Taxi: 36 (1.5%)
- Bicycle: 14 (0.6%)
- Walked: 73 (3.0%)
- Worked at home: 247 (10.1%)

- Unemployment by race in 2022
- Unemployment rate for White non-Hispanic residents
- 4.8%Males
- 5.8%Females
- Unemployment rate for two or more race residents
- 100.0%Males

- Year of entry for the foreign-born population in Edinburgh, Indiana
- 02010 or later
- 32000 to 2009
- 131990 to 1999
- 01980 to 1989
- 01970 to 1979
- 0Before 1970

First ancestries reported:
- American: 435 (37.3%)
- German: 210 (18.0%)
- Irish: 179 (15.4%)
- English: 153 (13.1%)
- European: 26 (2.2%)
- African: 14 (1.2%)
- Scottish: 10 (0.9%)
- Welsh: 10 (0.9%)
Most common places of birth for foreign-born residents (%):
| Edinburgh: | 158.8% (27) |
| Indiana: | 0.4% (1,469) |
| Edinburgh: | 17.6% (3) |
| Indiana: | 27.0% (101,996) |
Place of birth for U.S.-born residents:
- This state: 3,121
- Other state: 1,019
- Northeast: 12
- Midwest: 538
- South: 441
- West: 24
86.8% of Edinburgh residents lived in the same house 1 years ago.
Out of people who lived in different houses, 37.3% lived in this county.
Out of people who lived in different counties, 100.0% lived in Indiana.
| Edinburgh: | 86.8% |
| State average: | 87.1% |
Education attainment for males 25 years and older:
- No schooling: 60
- Nursery to 4th grade: 0
- 5th and 6th grade: 6
- 7th and 8th grade: 28
- 9th grade: 9
- 10th grade: 19
- 11th grade: 29
- 12th grade, no diploma: 36
- High school graduate (or equivalency): 582
- Less than 1 year of college: 71
- Some college more than 1 year, no degree: 431
- Associate degree: 200
- Bachelor's degree: 102
- Master's degree: 43
- Professional school degree: 0
- Doctorate degree: 0

Education attainment for females 25 years and older:
- No schooling: 55
- Nursery to 4th grade: 0
- 5th and 6th grade: 4
- 7th and 8th grade: 16
- 9th grade: 21
- 10th grade: 57
- 11th grade: 30
- 12th grade, no diploma: 60
- High school graduate (or equivalency): 540
- Less than 1 year of college: 223
- Some college more than 1 year, no degree: 143
- Associate degree: 225
- Bachelor's degree: 122
- Master's degree: 43
- Professional school degree: 0
- Doctorate degree: 0


Housing units in structures:
- One, detached: 1,304
- One, attached: 78
- Two: 24
- 3 or 4: 133
- 5 to 9: 208
- 10 to 19: 7
- 20 to 49: 68
- Mobile homes: 240
Median worth of mobile homes: $11,413
Housing units lacking complete kitchen facilities in 2022: 2.0%
House/condo owner moved in on average 13 years ago
Renter moved in on average 4 years ago

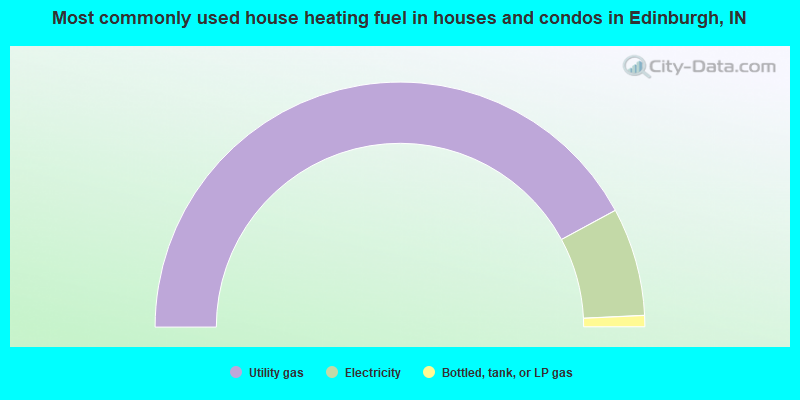
- 84.2%Utility gas
- 14.3%Electricity
- 1.5%Bottled, tank, or LP gas
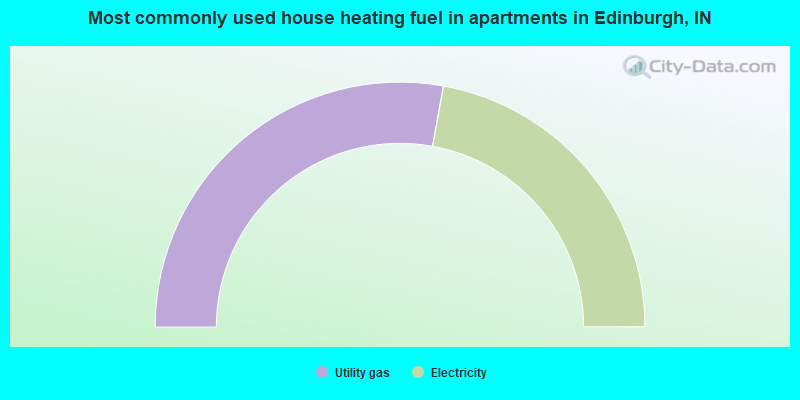
- 55.7%Utility gas
- 44.3%Electricity
Private vs. public school enrollment:
| Here: | 11.6% |
| Indiana: | 14.9% |
| Here: | 0.0% |
| Indiana: | 11.4% |
| Here: | 14.7% |
| Indiana: | 22.3% |