Effingham, IL (Illinois) Houses and Residents
| Effingham: | $164,050 |
| Illinois: | $251,600 |
Mean price in 2022:
Detached houses: $221,666
Here: $221,666 State: $310,164 Townhouses or other attached units: $179,967
Here: $179,967 State: $286,230 In 2-unit structures: $81,494
Here: $81,494 State: $299,638 Mobile homes: $41,654
Here: $41,654 State: $78,855
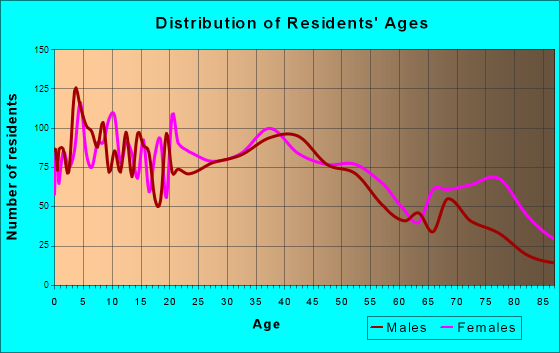
Total population: 12,577 (Urban population: 12,131 (all inside urban clusters), Rural population: 305 (7 farm, 298 nonfarm))
Houses: 5,563 (5,163 occupied: 3,325 owner occupied, 1,905 renter occupied)
| % of renters here: | 36% |
| State: | 33% |
Housing density: 642 houses/condos per square mile
Median price asked for vacant for-sale houses and condos in 2022: $127,563.
Median contract rent in 2022: $567 (lower quartile is $433, upper quartile is $725)
Median rent asked for vacant for-rent units in 2022: $702
Median gross rent in Effingham, IL in 2022: $680
Housing units in Effingham with a mortgage: 1,790 (119 second mortgage, 0 home equity loan, 109 both second mortgage and home equity loan)
Houses without a mortgage: 72
Median household income for houses/condos with a mortgage: $80,195
Median household income for apartments without a mortgage: $63,430
Median monthly housing costs: $802
Compare current foreclosures near Effingham, IL:
| Photo | Address | Area | Beds / Baths | Price | Details |
|---|---|---|---|---|---|

|
#1
N 1000th Rd
Effingham, IL 62401
|
- sq. feet
|
- baths - beds |
show details | |

|
#2
S 4th St
Effingham, IL 62401
|
- sq. feet
|
- baths - beds |
show details | |

|
#3
E Hendelmeyer Ave Apt 11a
Effingham, IL 62401
|
- sq. feet
|
- baths - beds |
show details | |

|
#4
N Oak St # 9
Effingham, IL 62401
|
- sq. feet
|
- baths - beds |
show details | |

|
#5
N 2nd St
Effingham, IL 62401
|
- sq. feet
|
- baths - beds |
show details | |

|
#6
E 1800th Ave
Effingham, IL 62401
|
- sq. feet
|
- baths - beds |
show details | |

|
#7
Hillside Dr Apt A4
Effingham, IL 62401
|
- sq. feet
|
- baths - beds |
show details | |

|
#8
W Saint Anthony Ave
Effingham, IL 62401
|
- sq. feet
|
- baths - beds |
show details | |

|
#9
W Kentucky Ave
Effingham, IL 62401
|
- sq. feet
|
- baths - beds |
show details | |

|
#10
N Lincoln St
Effingham, IL 62401
|
- sq. feet
|
- baths - beds |
show details |
| Photo | Address | Area | Beds / Baths | Price | Details |
|---|---|---|---|---|---|

|
#11
W Kreke Ave
Effingham, IL 62401
|
- sq. feet
|
- baths - beds |
show details | |

|
#12
W Franklin Ave
Effingham, IL 62401
|
- sq. feet
|
- baths - beds |
show details | |

|
#13
W Wabash Ave
Effingham, IL 62401
|
- sq. feet
|
- baths - beds |
show details | |

|
#14
E Blue Ridge Dr
Effingham, IL 62401
|
- sq. feet
|
- baths - beds |
show details | |

|
#15
S Sycamore St
Effingham, IL 62401
|
- sq. feet
|
- baths - beds |
show details | |

|
#16
N Oceola St
Effingham, IL 62401
|
- sq. feet
|
- baths - beds |
show details | |

|
#17
Locust Ave
Neoga, IL 62447
|
- sq. feet
|
2 baths 4 beds |
$84,900
|
show details |

|
#18
W 7th St
Neoga, IL 62447
|
- sq. feet
|
- baths - beds |
$25,900
|
show details |

|
#19
Locust Ave
Neoga, IL 62447
|
2,208 sq. feet
|
2 baths 4 beds |
show details | |

|
#20
County Highway 9
Neoga, IL 62447
|
- sq. feet
|
2 baths 4 beds |
show details |
| Photo | Address | Area | Beds / Baths | Price | Details |
|---|---|---|---|---|---|

|
#21
N Myrtle St
Beecher City, IL 62414
|
1,200 sq. feet
|
- baths 1 beds |
show details | |

|
#22
Broad St
Edgewood, IL 62426
|
- sq. feet
|
- baths - beds |
show details | |

|
#23
County Highway 7
Strasburg, IL 62465
|
- sq. feet
|
- baths - beds |
show details | |

|
#24
S 4th St
Altamont, IL 62411
|
- sq. feet
|
- baths - beds |
show details | |

|
#25
N 3570 East Rd
Neoga, IL 62447
|
- sq. feet
|
- baths - beds |
show details | |

|
#26
N Wyandotte St Apt D
Beecher City, IL 62414
|
- sq. feet
|
- baths - beds |
show details | |

|
#27
Us Route 45, Lot 100
Neoga, IL 62447
|
- sq. feet
|
- baths - beds |
show details | |

|
#28
E 500th Ave
Dieterich, IL 62424
|
- sq. feet
|
- baths - beds |
show details | |

|
#29
W Elm St
Altamont, IL 62411
|
- sq. feet
|
- baths - beds |
show details | |

|
#30
S 3rd St
Altamont, IL 62411
|
- sq. feet
|
- baths - beds |
show details |
| Photo | Address | Area | Beds / Baths | Price | Details |
|---|---|---|---|---|---|

|
#31
N 3rd St
Altamont, IL 62411
|
- sq. feet
|
- baths - beds |
show details | |

|
#32
Deer Dr
Altamont, IL 62411
|
- sq. feet
|
- baths - beds |
show details | |

|
#33
E Section St # B
Dieterich, IL 62424
|
- sq. feet
|
- baths - beds |
show details | |

|
#34
N Church St
Sigel, IL 62462
|
- sq. feet
|
- baths - beds |
show details | |

|
#35
2600 East Rd
Strasburg, IL 62465
|
- sq. feet
|
- baths - beds |
show details | |

|
#36
Oak St
Altamont, IL 62411
|
- sq. feet
|
- baths - beds |
show details | |

|
#37
E Empire Dr
Altamont, IL 62411
|
- sq. feet
|
- baths - beds |
show details | |

|
#38
W John Adams Ave
Altamont, IL 62411
|
- sq. feet
|
- baths - beds |
show details | |

|
#39
N Main St
Dieterich, IL 62424
|
- sq. feet
|
- baths - beds |
show details | |

|
#40
W Main St
Shumway, IL 62461
|
- sq. feet
|
- baths - beds |
show details |
| Photo | Address | Area | Beds / Baths | Price | Details |
|---|---|---|---|---|---|

|
#41
E State Highway 33
Shumway, IL 62461
|
- sq. feet
|
- baths - beds |
show details | |

|
#42
Mallard Ln
Mason, IL 62443
|
- sq. feet
|
- baths - beds |
show details | |

|
Check over 1 million property listings on Foreclosure.com!
|
browse all offers | |||

Latest news about housing in Effingham, IL collected exclusively by city-data.com from local newspapers, TV, and radio stations

 | Effingham, IL Executive rental home needed soon!! (1 reply) |
| Illinoisans are hurting. (233 replies) |
| Interesting/quirky/off-the-beaten-path stuff to see in non-Chicagoland IL? (13 replies) |
| Southern Illinois - Hotels with Bars? (3 replies) |
| Bloomington, Lincoln, Clinton or Springfield good to move to? (13 replies) |
| Looking for small town in central illinois (7 replies) |
Median year apartment built: 1980
Household type by relationship:
Households: 12,075- Male householders: 2,299 (576 living alone), Female householders: 2,769 (1,047 living alone)
2,147 spouses (2,120 opposite-sex spouses), 513 unmarried partners, (507 opposite-sex unmarried partners), 3,268 children (3,085 natural, 58 adopted, 124 stepchildren), 96 grandchildren, 95 brothers or sisters, 102 parents, 24 foster children, 67 other relatives, 315 non-relatives
- In group quarters: 374
Size of family households: 1,371 2-persons, 590 3-persons, 602 4-persons, 256 5-persons, 132 6-persons, 17 7-or-more-persons.
Size of nonfamily households: 1,710 1-person, 470 2-persons, 84 3-persons, 9 4-persons.
1,435 married couples with children.
1,111 single-parent households (291 men, 820 women).
93.1% of residents of Effingham speak English at home.
5.2% of residents speak Spanish at home (45% speak English very well, 18% speak English well, 28% speak English not well, 9% don't speak English at all).
1.2% of residents speak other Indo-European language at home (67% speak English very well, 33% speak English not well).
0.2% of residents speak Asian or Pacific Island language at home (100% speak English very well).
Foreign born population: 532 (4.4%)
(39.5% of them are naturalized citizens)
| Here: | 6.5 |
| State: | 6.4 |
| Here: | 3.8 |
| State: | 4.1 |

- Bedrooms in owner-occupied houses and condos in Effingham, Illinois
- 18no bedroom
- 221 bedroom
- 5512 bedrooms
- 1,9003 bedrooms
- 5644 bedrooms
- 2715+ bedrooms

- Bedrooms in renter-occupied apartments in Effingham, Illinois
- 281no bedroom
- 5041 bedroom
- 7612 bedrooms
- 2383 bedrooms
- 704 bedrooms
- 515+ bedrooms

- Cars and other vehicles available in Effingham in owner-occupied houses/condos
- 165no vehicle
- 8281 vehicle
- 1,4042 vehicles
- 7353 vehicles
- 1524 vehicles
- 425+ vehicles

- Cars and other vehicles available in Effingham in renter-occupied apartments
- 380no vehicle
- 9721 vehicle
- 4272 vehicles
- 1263 vehicles
- 04 vehicles
- 05+ vehicles

- Rooms in owner-occupied houses in Effingham, Illinois
- 181 room
- 02 rooms
- 103 rooms
- 1594 rooms
- 5985 rooms
- 8646 rooms
- 6347 rooms
- 5318 rooms
- 5119+ rooms

- Rooms in renter-occupied apartments in Effingham, Illinois
- 2811 room
- 922 rooms
- 4193 rooms
- 3714 rooms
- 3585 rooms
- 2046 rooms
- 1137 rooms
- 128 rooms
- 559+ rooms


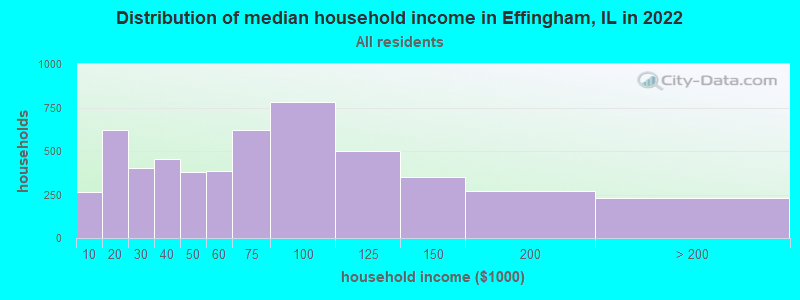
Effingham, IL household income distribution

- 263Less than $10,000
- 623$10,000 to $19,999
- 405$20,000 to $29,999
- 452$30,000 to $39,999
- 377$40,000 to $49,999
- 386$50,000 to $59,999
- 623$60,000 to $74,999
- 780$75,000 to $99,999
- 502$100,000 to $124,999
- 351$125,000 to $149,999
- 270$150,000 to $199,999
- 228$200,000 or more
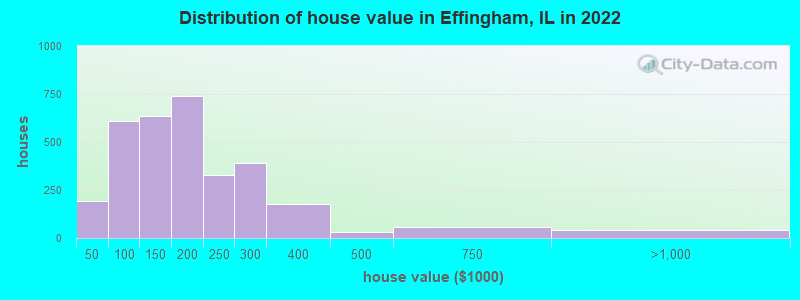
Home value of owner - occupied houses in 2022 in Effingham, IL
-
- 48Less than $10,000
- 14$10,000 to $14,999
- 47$15,000 to $19,999
- 60$20,000 to $24,999
- 5$30,000 to $34,999
- 11$35,000 to $39,999
- 7$40,000 to $49,999
- 47$50,000 to $59,999
- 83$60,000 to $69,999
- 51$70,000 to $79,999
- 167$80,000 to $89,999
- 252$90,000 to $99,999
- 394$100,000 to $124,999
- 240$125,000 to $149,999
- 455$150,000 to $174,999
- 286$175,000 to $199,999
- 329$200,000 to $249,999
- 392$250,000 to $299,999
- 176$300,000 to $399,999
- 29$400,000 to $499,999
- 56$500,000 to $749,999
- 32$750,000 to $999,999
- 6$1,000,000 to $1,499,999
Rent paid by renters in 2022 in Effingham, IL
-
- 23Less than $100
- 16$100 to $149
- 31$150 to $199
- 72$250 to $299
- 166$300 to $349
- 84$350 to $399
- 89$400 to $449
- 150$450 to $499
- 142$500 to $549
- 212$550 to $599
- 169$600 to $649
- 100$650 to $699
- 109$700 to $749
- 41$750 to $799
- 110$800 to $899
- 30$900 to $999
- 81$1,000 to $1,249
- 125$1,250 to $1,499
- 10$3,000 to $3,499
- 59No cash rent


Percentage of workers working in this county: 90.2%
Number of people working at home: 859 (14.6% of all workers)
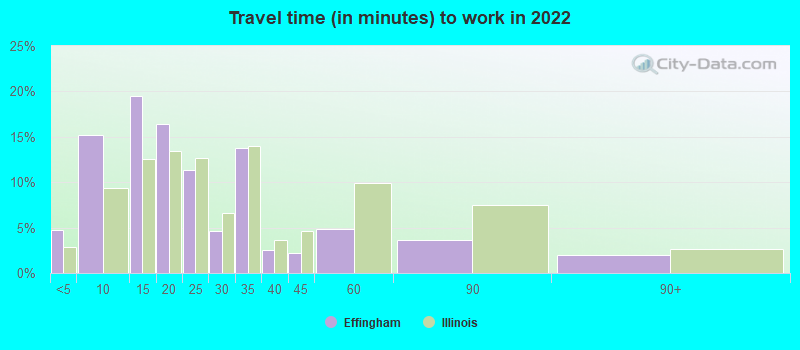
Travel time to work (commute)
- Less than 5 minutes: 507
- 5 to 9 minutes: 1,603
- 10 to 14 minutes: 1,409
- 15 to 19 minutes: 396
- 20 to 24 minutes: 250
- 25 to 29 minutes: 242
- 30 to 34 minutes: 276
- 35 to 39 minutes: 103
- 40 to 44 minutes: 85
- 45 to 59 minutes: 65
- 60 to 89 minutes: 94
- 90 or more minutes: 46
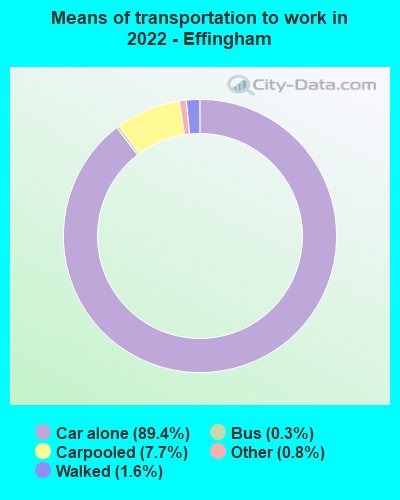
Means of transportation to work:
- Drove a car alone: 13,081 (82.6%)
- Carpooled: 1,204 (7.6%)
- Bus: 46 (0.3%)
- Taxi: 133 (0.8%)
- Bicycle: 10 (0.1%)
- Walked: 244 (1.5%)
- Worked at home: 859 (5.4%)

- Unemployment by race in 2022
- Unemployment rate for White non-Hispanic residents
- 3.0%Males
- 0.7%Females
- Unemployment rate for two or more race residents
- 20.1%Males
- Unemployment rate for Hispanic or Latino residents
- 11.2%Males

- Year of entry for the foreign-born population in Effingham, Illinois
- 3112010 or later
- 1552000 to 2009
- 751990 to 1999
- 731980 to 1989
- 01970 to 1979
- 23Before 1970

First ancestries reported:
- German: 2,459 (37.2%)
- American: 1,491 (22.6%)
- English: 465 (7.0%)
- Irish: 265 (4.0%)
- European: 84 (1.3%)
- Greek: 72 (1.1%)
- Scottish: 66 (1.0%)
- Scotch-Irish: 42 (0.6%)
- French: 31 (0.5%)
- Italian: 27 (0.4%)
- Romanian: 25 (0.4%)
- Polish: 21 (0.3%)
- Dutch: 20 (0.3%)
- Swedish: 18 (0.3%)
- Pennsylvania German: 15 (0.2%)
- French Canadian: 13 (0.2%)
- Eastern European: 7 (0.1%)
- Serbian: 7 (0.1%)
- Czechoslovakian: 6 (0.09%)
Most common places of birth for foreign-born residents (%):
| Effingham: | 63.0% (335) |
| Illinois: | 34.7% (626,958) |
| Effingham: | 14.5% (77) |
| Illinois: | 9.2% (166,409) |
| Effingham: | 6.2% (33) |
| Illinois: | 4.1% (74,364) |
| Effingham: | 4.9% (26) |
| Illinois: | 0.6% (10,720) |
| Effingham: | 4.1% (22) |
| Illinois: | 0.8% (14,736) |
| Effingham: | 3.4% (18) |
| Illinois: | 5.2% (93,003) |
| Effingham: | 1.7% (9) |
| Illinois: | 0.4% (7,323) |
Place of birth for U.S.-born residents:
- This state: 9,745
- Other state: 1,712
- Northeast: 45
- Midwest: 1,168
- South: 244
- West: 263
82.9% of Effingham residents lived in the same house 1 years ago.
Out of people who lived in different houses, 34.1% lived in this county.
Out of people who lived in different counties, 72.6% lived in Illinois.
| Effingham: | 82.9% |
| State average: | 88.3% |
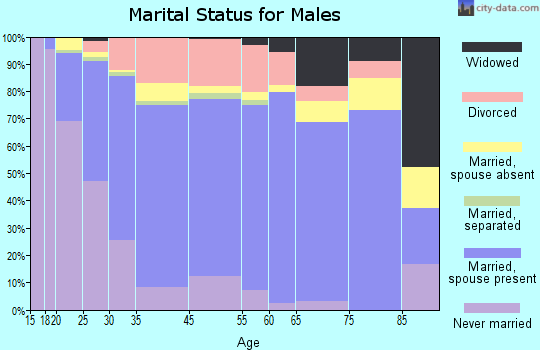
Education attainment for males 25 years and older:
- No schooling: 15
- Nursery to 4th grade: 2
- 5th and 6th grade: 38
- 7th and 8th grade: 30
- 9th grade: 15
- 10th grade: 11
- 11th grade: 0
- 12th grade, no diploma: 22
- High school graduate (or equivalency): 1,241
- Less than 1 year of college: 281
- Some college more than 1 year, no degree: 509
- Associate degree: 538
- Bachelor's degree: 728
- Master's degree: 152
- Professional school degree: 89
- Doctorate degree: 20

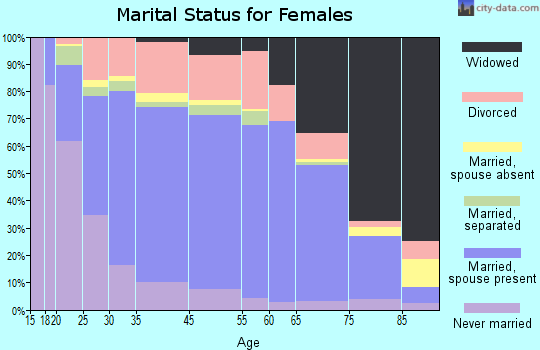
Education attainment for females 25 years and older:
- No schooling: 7
- Nursery to 4th grade: 41
- 5th and 6th grade: 163
- 7th and 8th grade: 32
- 9th grade: 68
- 10th grade: 86
- 11th grade: 42
- 12th grade, no diploma: 15
- High school graduate (or equivalency): 1,161
- Less than 1 year of college: 486
- Some college more than 1 year, no degree: 501
- Associate degree: 658
- Bachelor's degree: 572
- Master's degree: 425
- Professional school degree: 141
- Doctorate degree: 14

Housing units in structures:
- One, detached: 3,644
- One, attached: 87
- Two: 312
- 3 or 4: 413
- 5 to 9: 238
- 10 to 19: 248
- 20 to 49: 260
- 50 or more: 106
- Mobile homes: 252
Median worth of mobile homes: $26,317
Housing units lacking complete kitchen facilities in 2022: 1.9%
House/condo owner moved in on average 15 years ago
Renter moved in on average 2 years ago

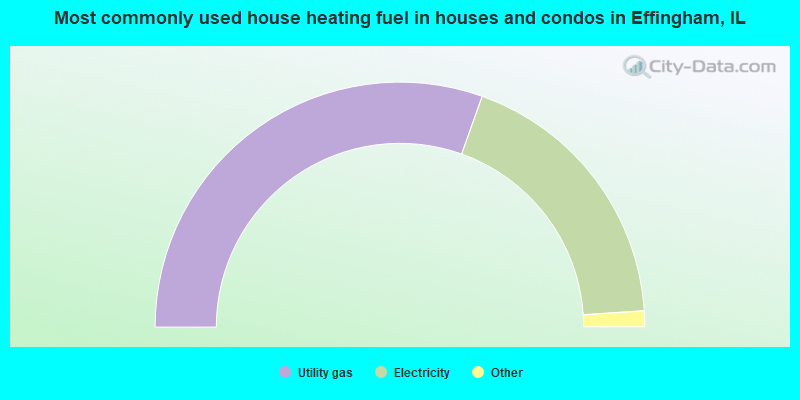
- 60.9%Utility gas
- 37.0%Electricity
- 1.4%Bottled, tank, or LP gas
- 0.5%Wood
- 0.2%Other fuel
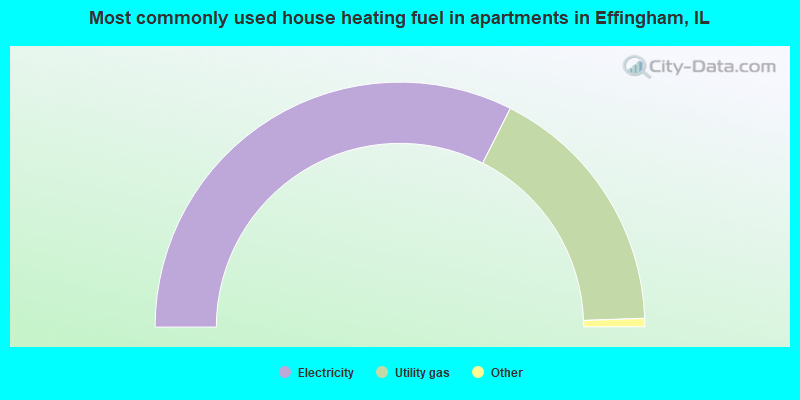
- 64.9%Electricity
- 34.0%Utility gas
- 0.9%Bottled, tank, or LP gas
- 0.2%No fuel used
Private vs. public school enrollment:
| Here: | 19.8% |
| Illinois: | 13.3% |
| Here: | 21.2% |
| Illinois: | 9.9% |
| Here: | 7.7% |
| Illinois: | 27.4% |


