Housing density: 3,120 houses/condos per square mile
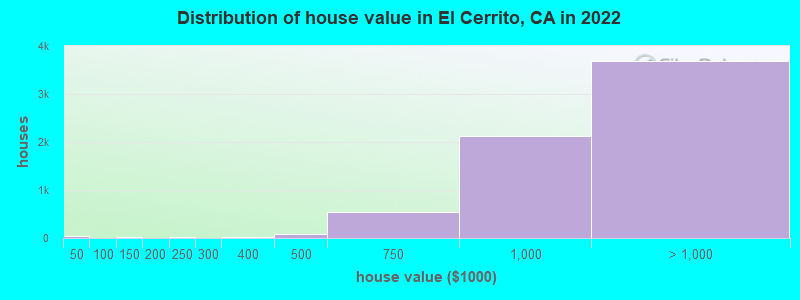
Median price asked for vacant for-sale houses and condos in 2022: $424,670.
Median contract rent in 2022: over $2,000 (lower quartile is $1,710, upper quartile is over $2,000)
Median rent asked for vacant for-rent units in 2022: $2,146
Median gross rent in El Cerrito, CA in 2022: over $2,000
Housing units in El Cerrito with a mortgage: 3,951 (586 second mortgage, 0 home equity loan, 528 both second mortgage and home equity loan) Houses without a mortgage: 92
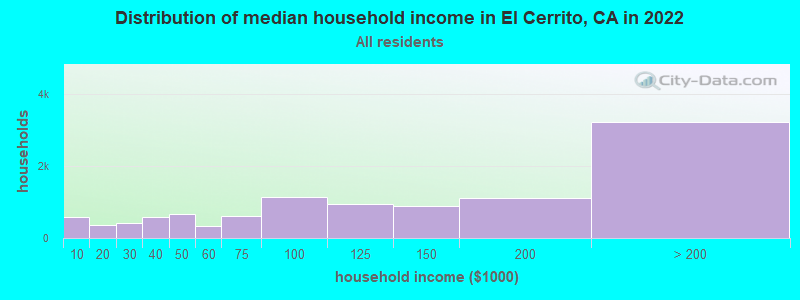
Median household income for houses/condos with a mortgage: $205,545
Median household income for apartments without a mortgage: $106,314
3,228 married couples with children.
808 single-parent households (154 men, 654 women).
60.8% of residents of El Cerrito speak English at home.
7.3% of residents speak Spanish at home (62% speak English very well, 22% speak English well, 14% speak English not well, 2% don't speak English at all).
12.7% of residents speak other Indo-European language at home (75% speak English very well, 14% speak English well, 10% speak English not well, 1% don't speak English at all).
17.3% of residents speak Asian or Pacific Island language at home (48% speak English very well, 34% speak English well, 16% speak English not well, 2% don't speak English at all).
2.9% of residents speak other language at home (74% speak English very well, 17% speak English well, 1% speak English not well, 8% don't speak English at all).
Foreign born population: 9,046 (35.1%)
(61.8% of them are naturalized citizens)
Percentage of workers working in this county: 50.6% Number of people working at home: 3,897 (29.2% of all workers)
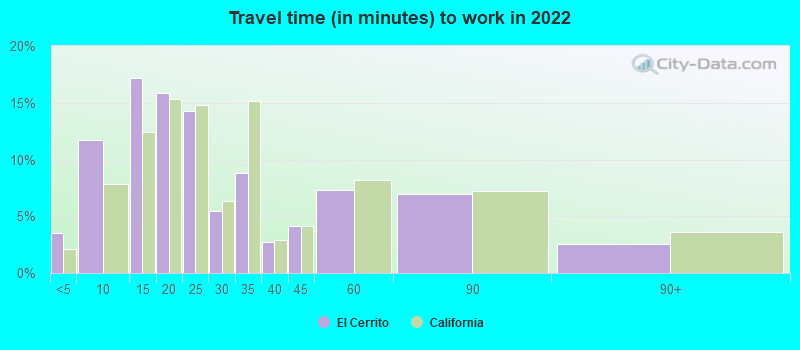
Travel time to work (commute)
Less than 5 minutes: 185
5 to 9 minutes: 657
10 to 14 minutes: 941
15 to 19 minutes: 1,043
20 to 24 minutes: 1,146
25 to 29 minutes: 844
30 to 34 minutes: 1,202
35 to 39 minutes: 336
40 to 44 minutes: 688
45 to 59 minutes: 1,567
60 to 89 minutes: 1,018
90 or more minutes: 218
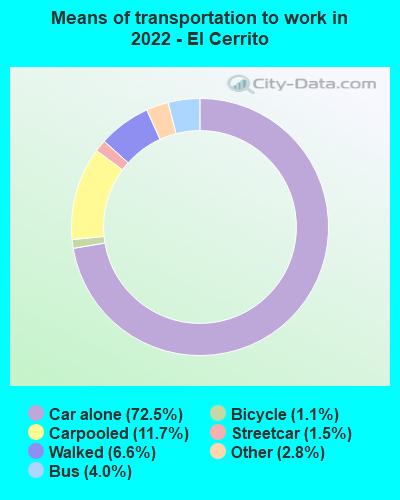
Means of transportation to work:
Drove a car alone: 4,662 (45.6%)
Carpooled: 839 (8.2%)
Bus: 203 (2.0%)
Subway or elevated rail: 63 (0.6%)
Taxi: 190 (1.9%)
Bicycle: 49 (0.5%)
Walked: 604 (5.9%)
Worked at home: 3,897 (38.1%)
Unemployment by race in 2022
Unemployment rate for White non-Hispanic residents
5.3%Males
5.7%Females
Unemployment rate for Black residents
3.2%Males
9.5%Females
Unemployment rate for American Indian and Alaska Native residents
3.9%Males
Unemployment rate for Asian residents
3.5%Males
5.5%Females
Unemployment rate for other race residents
7.6%Males
0.9%Females
Unemployment rate for two or more race residents
6.5%Males
3.7%Females
Unemployment rate for Hispanic or Latino residents
5.0%Males
1.9%Females
Year of entry for the foreign-born population in El Cerrito, California
3,3422010 or later
2,0292000 to 2009
1,3171990 to 1999
1,6941980 to 1989
9921970 to 1979
1,173Before 1970
First ancestries reported:
European: 616 (4.2%)
German: 590 (4.0%)
English: 511 (3.5%)
Iranian: 332 (2.3%)
Italian: 304 (2.1%)
Polish: 257 (1.7%)
Russian: 253 (1.7%)
Irish: 246 (1.7%)
American: 225 (1.5%)
Scottish: 159 (1.1%)
Nigerian: 133 (0.9%)
British: 112 (0.8%)
Brazilian: 109 (0.7%)
Ukrainian: 108 (0.7%)
Israeli: 107 (0.7%)
French: 103 (0.7%)
Eastern European: 91 (0.6%)
African: 83 (0.6%)
Welsh: 73 (0.5%)
Norwegian: 67 (0.5%)
Northern European: 52 (0.4%)
Romanian: 51 (0.3%)
Greek: 42 (0.3%)
Dutch: 42 (0.3%)
Kenyan: 39 (0.3%)
Arab: 35 (0.2%)
Slovak: 33 (0.2%)
French Canadian: 31 (0.2%)
Portuguese: 30 (0.2%)
Swedish: 27 (0.2%)
Finnish: 24 (0.2%)
Turkish: 24 (0.2%)
Egyptian: 23 (0.2%)
Lithuanian: 18 (0.1%)
Scotch-Irish: 16 (0.1%)
Ethiopian: 15 (0.1%)
Bulgarian: 15 (0.1%)
Canadian: 14 (0.10%)
Belgian: 14 (0.10%)
Syrian: 13 (0.09%)
Slovene: 11 (0.07%)
New Zealander: 10 (0.07%)
Lebanese: 9 (0.06%)
Palestinian: 9 (0.06%)
Danish: 8 (0.05%)
Serbian: 7 (0.05%)
Estonian: 6 (0.04%)
Hungarian: 4 (0.03%)
Swiss: 4 (0.03%)
Australian: 4 (0.03%)
Jordanian: 3 (0.02%)
Most common places of birth for foreign-born residents (%):
Nepal
El Cerrito:
19.7% (1,682)
California:
0.2% (16,541)
China, excluding Hong Kong and Taiwan
El Cerrito:
15.7% (1,344)
California:
6.6% (684,672)
Philippines
El Cerrito:
6.6% (568)
California:
7.8% (818,297)
India
El Cerrito:
6.1% (519)
California:
5.2% (539,184)
Mexico
El Cerrito:
4.8% (409)
California:
37.2% (3,881,193)
Taiwan
El Cerrito:
4.0% (340)
California:
1.7% (176,274)
Japan
El Cerrito:
3.8% (321)
California:
1.0% (103,575)
Iran
El Cerrito:
3.7% (313)
California:
2.0% (206,004)
Russia
El Cerrito:
3.1% (262)
California:
0.7% (71,932)
Hong Kong
El Cerrito:
2.4% (208)
California:
1.0% (105,215)
Korea
El Cerrito:
2.2% (189)
California:
3.0% (315,248)
Germany
El Cerrito:
1.8% (158)
California:
0.7% (73,304)
Israel
El Cerrito:
1.8% (151)
California:
0.3% (33,029)
Algeria
El Cerrito:
1.7% (143)
California:
0.0% (4,729)
Brazil
El Cerrito:
1.6% (134)
California:
0.5% (53,222)
Place of birth for U.S.-born residents:
This state: 11,270
Other state: 5,087
Northeast: 1,589
Midwest: 1,749
South: 1,200
West: 600
84.6% of El Cerrito residents lived in the same house 1 years ago. Out of people who lived in different houses, 30.0% lived in this county. Out of people who lived in different counties, 83.7% lived in California.
El Cerrito:
84.6%
State average:
88.9%
Education attainment for males 25 years and older:
No schooling: 259
Nursery to 4th grade: 21
5th and 6th grade: 9
7th and 8th grade: 0
9th grade: 67
10th grade: 39
11th grade: 45
12th grade, no diploma: 145
High school graduate (or equivalency): 1,098
Less than 1 year of college: 178
Some college more than 1 year, no degree: 766
Associate degree: 583
Bachelor's degree: 3,166
Master's degree: 1,648
Professional school degree: 593
Doctorate degree: 730
Education attainment for females 25 years and older:
No schooling: 189
Nursery to 4th grade: 6
5th and 6th grade: 36
7th and 8th grade: 11
9th grade: 3
10th grade: 44
11th grade: 12
12th grade, no diploma: 141
High school graduate (or equivalency): 1,194
Less than 1 year of college: 347
Some college more than 1 year, no degree: 908
Associate degree: 654
Bachelor's degree: 3,423
Master's degree: 2,509
Professional school degree: 544
Doctorate degree: 590
Housing units in structures:
One, detached: 7,652
One, attached: 437
Two: 249
3 or 4: 1,139
5 to 9: 528
10 to 19: 485
20 to 49: 303
50 or more: 576
Housing units lacking complete plumbing facilities in 2022: 1.8%
Housing units lacking complete kitchen facilities in 2022: 2.6%
House/condo owner moved in on average 17 years ago