Jump to a detailed profile or search site with Google Custom Search

El Dorado Hills, CA (California) Houses and Residents

Estimated median house or condo value in 2022: $886,446 (it was $277,900 in 2000)
El Dorado Hills:

$886,446
California:

$715,900
Lower value quartile - upper value quartile: $681,782 - $1,092,592

Total population: 42,108 (Urban population: 17,770, Rural population: 313 (all nonfarm))

Houses: 18,009 (17,435 occupied: 14,816 owner occupied, 2,220 renter occupied)

% of renters here:

13%
State:

44%

Housing density: 1,006 houses/condos per square mile

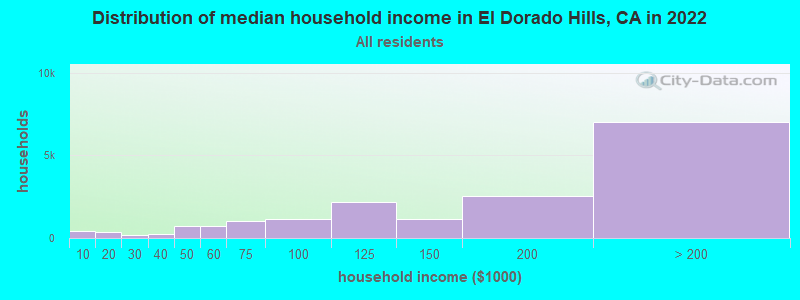
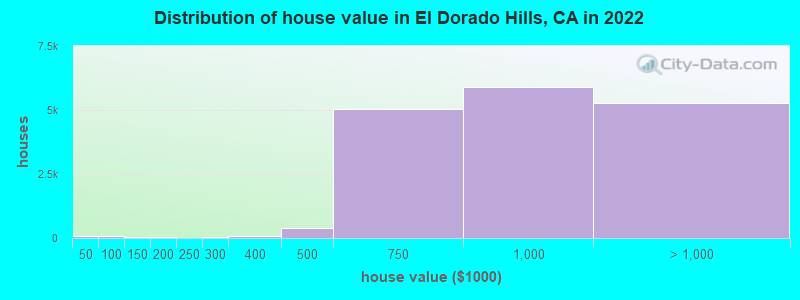
Median price asked for vacant for-sale houses and condos in 2022: $701,060.

Median contract rent in 2022: over $2,000 (lower quartile is $1,518, upper quartile is over $2,000)


Median rent asked for vacant for-rent units in 2022: $20,641


Median gross rent in El Dorado Hills, CA in 2022: over $2,000

Housing units in El Dorado Hills with a mortgage: 11,276 (1,746 second mortgage, 56 home equity loan, 1,568 both second mortgage and home equity loan)
Houses without a mortgage: 41

Median household income for houses/condos with a mortgage: $201,525

Median household income for apartments without a mortgage: $107,775

Median monthly housing costs: $3,069

Compare current foreclosures in El Dorado Hills, CA:

Check out more offers in El Dorado Hills, CA.
Powered by Foreclosure.com

Settings
X
Data:
Loading data...
Based on 2000-2022 data
Loading data...

123
Hide US histogram

El Dorado Hills, California Age and Sex of Residents
Median year house/condo built: 2001

Median year apartment built: 1999

Household type by relationship:

Households: 49,320
  • Male householders: 9,486 (888 living alone), Female householders: 7,820 (1,678 living alone)
  • 12,755 spouses (12,720 opposite-sex spouses), 326 unmarried partners, (319 opposite-sex unmarried partners), 16,171 children (15,069 natural, 247 adopted, 854 stepchildren), 450 grandchildren, 20 brothers or sisters, 956 parents, 64 foster children, 518 other relatives, 658 non-relatives
  • In group quarters: 91

Size of family households: 6,368 2-persons, 3,057 3-persons, 3,001 4-persons, 1,223 5-persons, 437 6-persons, 171 7-or-more-persons.

Size of nonfamily households: 2,367 1-person, 396 2-persons, 52 3-persons.

9,830 married couples with children.
1,269 single-parent households (495 men, 774 women).

85.3% of residents of El Dorado Hills speak English at home.
2.7% of residents speak Spanish at home (86% speak English very well, 10% speak English well, 4% speak English not well).
4.9% of residents speak other Indo-European language at home (76% speak English very well, 19% speak English well, 5% speak English not well).
6.6% of residents speak Asian or Pacific Island language at home (66% speak English very well, 26% speak English well, 8% speak English not well).
0.4% of residents speak other language at home (96% speak English very well, 4% speak English well).

Foreign born population: 7,072 (14.3%)
(56.7% of them are naturalized citizens)

Median number of rooms in houses and condos:
Here:

7.5
State:

6.0

Median number of rooms in apartments
Here:

4.8
State:

3.9

Owner-occupied Renter-occupied
Bedrooms in owner-occupied houses and condos in El Dorado Hills, California
  • Bedrooms in owner-occupied houses and condos in El Dorado Hills, California
  • 11no bedroom
  • 501 bedroom
  • 8652 bedrooms
  • 4,7113 bedrooms
  • 6,5554 bedrooms
  • 2,6245+ bedrooms
Bedrooms in renter-occupied apartments in El Dorado Hills, California
  • Bedrooms in renter-occupied apartments in El Dorado Hills, California
  • 35no bedroom
  • 2581 bedroom
  • 8492 bedrooms
  • 5313 bedrooms
  • 4684 bedrooms
  • 805+ bedrooms
Owner-occupied Renter-occupied
Cars and other vehicles available in El Dorado Hills in owner-occupied houses/condos
  • Cars and other vehicles available in El Dorado Hills in owner-occupied houses/condos
  • 168no vehicle
  • 2,1311 vehicle
  • 7,2652 vehicles
  • 3,5573 vehicles
  • 1,3314 vehicles
  • 3645+ vehicles
Cars and other vehicles available in El Dorado Hills in renter-occupied apartments
  • Cars and other vehicles available in El Dorado Hills in renter-occupied apartments
  • 206no vehicle
  • 7221 vehicle
  • 7342 vehicles
  • 4813 vehicles
  • 284 vehicles
  • 505+ vehicles
Owner-occupied Renter-occupied
Rooms in owner-occupied houses in El Dorado Hills, California
  • Rooms in owner-occupied houses in El Dorado Hills, California
  • 01 room
  • 232 rooms
  • 1113 rooms
  • 4484 rooms
  • 1,5645 rooms
  • 2,5696 rooms
  • 2,7877 rooms
  • 2,5168 rooms
  • 4,7989+ rooms
Rooms in renter-occupied apartments in El Dorado Hills, California
  • Rooms in renter-occupied apartments in El Dorado Hills, California
  • 351 room
  • 1192 rooms
  • 3333 rooms
  • 5214 rooms
  • 3715 rooms
  • 3436 rooms
  • 2677 rooms
  • 1888 rooms
  • 449+ rooms
Year house built
Median 2022 house/condo value by year built
Median house/condo value by year householder moved into unit
Breakdown of mean house values by ages of householders
  • El Dorado Hills, CA household income distribution

  • Distribution of median household income in El Dorado Hills, CA in 2022
  • 394Less than $10,000
  • 348$10,000 to $19,999
  • 197$20,000 to $29,999
  • 265$30,000 to $39,999
  • 702$40,000 to $49,999
  • 742$50,000 to $59,999
  • 1,044$60,000 to $74,999
  • 1,129$75,000 to $99,999
  • 2,189$100,000 to $124,999
  • 1,124$125,000 to $149,999
  • 2,520$150,000 to $199,999
  • 7,017$200,000 or more
  • Home value of owner - occupied houses in 2022 in El Dorado Hills, CA

  • Distribution of house value in El Dorado Hills, CA in 2022
  • 53Less than $10,000
  • 14$30,000 to $34,999
  • 1$40,000 to $49,999
  • 43$50,000 to $59,999
  • 38$70,000 to $79,999
  • 14$80,000 to $89,999
  • 34$100,000 to $124,999
  • 48$150,000 to $174,999
  • 6$200,000 to $249,999
  • 33$250,000 to $299,999
  • 85$300,000 to $399,999
  • 397$400,000 to $499,999
  • 5,041$500,000 to $749,999
  • 5,904$750,000 to $999,999
  • 3,668$1,000,000 to $1,499,999
  • 884$1,500,000 to $1,999,999
  • 737$2,000,000 or more
  • Rent paid by renters in 2022 in El Dorado Hills, CA

  • Distribution of rent paid by renters in El Dorado Hills, CA in 2022
  • 30$100 to $149
  • 12$350 to $399
  • 77$550 to $599
  • 13$750 to $799
  • 198$900 to $999
  • 73$1,000 to $1,249
  • 70$1,250 to $1,499
  • 313$1,500 to $1,999
  • 667$2,000 to $2,499
  • 415$2,500 to $2,999
  • 300$3,000 to $3,499
  • 164$3,500 or more
  • 152No cash rent
Time Leaving Home To Go To Work in 2022

Percentage of workers working in this county: 49.8%
Number of people working at home: 6,824 (30.7% of all workers)

Travel time (in minutes) to work in 2022

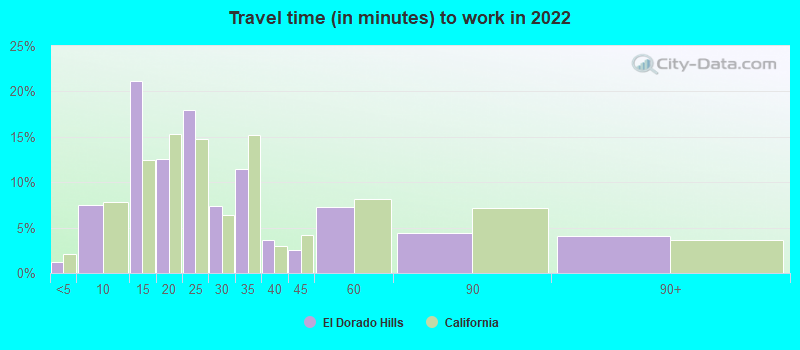
Travel time to work (commute)

  • Less than 5 minutes: 320
  • 5 to 9 minutes: 909
  • 10 to 14 minutes: 2,319
  • 15 to 19 minutes: 1,708
  • 20 to 24 minutes: 2,716
  • 25 to 29 minutes: 986
  • 30 to 34 minutes: 1,881
  • 35 to 39 minutes: 466
  • 40 to 44 minutes: 877
  • 45 to 59 minutes: 1,682
  • 60 to 89 minutes: 679
  • 90 or more minutes: 1,603
Means of transportation to work in 2022 - El Dorado Hills

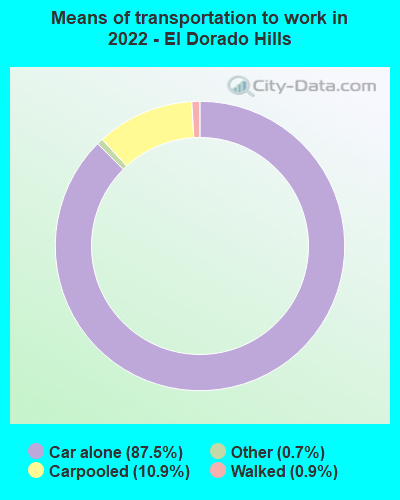
Means of transportation to work:

  • Drove a car alone: 9,494 (56.7%)
  • Carpooled: 1,271 (7.6%)
  • Taxi: 84 (0.5%)
  • Walked: 97 (0.6%)
  • Worked at home: 6,824 (40.8%)
Class of Workers in 2022
  • Unemployment by race in 2022
  • Unemployment rate for White non-Hispanic residents
  • 2.9%Males
  • 1.8%Females
  • Unemployment rate for Black residents
  • 23.2%Males
  • Unemployment rate for Asian residents
  • 1.2%Males
  • 2.1%Females
  • Unemployment rate for other race residents
  • 0.8%Females
  • Unemployment rate for two or more race residents
  • 3.9%Males
  • 2.5%Females
  • Unemployment rate for Hispanic or Latino residents
  • 6.5%Males
  • 1.7%Females
Year of entry for the foreign-born population in El Dorado Hills, California
  • Year of entry for the foreign-born population in El Dorado Hills, California
  • 9422010 or later
  • 1,3852000 to 2009
  • 1,2461990 to 1999
  • 1601980 to 1989
  • 1791970 to 1979
  • 289Before 1970
Ancestries in El Dorado Hills, CA

First ancestries reported:

  • English: 1,839 (9.7%)
  • German: 1,780 (9.4%)
  • European: 1,234 (6.5%)
  • Irish: 1,188 (6.3%)
  • Italian: 863 (4.5%)
  • American: 720 (3.8%)
  • Portuguese: 371 (2.0%)
  • Iranian: 315 (1.7%)
  • Polish: 305 (1.6%)
  • Norwegian: 248 (1.3%)
  • Scotch-Irish: 216 (1.1%)
  • Ukrainian: 187 (1.0%)
  • Russian: 184 (1.0%)
  • Scottish: 174 (0.9%)
  • Northern European: 169 (0.9%)
  • Scandinavian: 151 (0.8%)
  • French: 137 (0.7%)
  • Swedish: 136 (0.7%)
  • Hungarian: 122 (0.6%)
  • British: 103 (0.5%)
  • Swiss: 97 (0.5%)
  • Dutch: 85 (0.4%)
  • Welsh: 78 (0.4%)
  • Danish: 69 (0.4%)
  • Eastern European: 68 (0.4%)
  • Austrian: 53 (0.3%)
  • Greek: 47 (0.2%)
  • Slovak: 45 (0.2%)
  • Assyrian: 44 (0.2%)
  • Palestinian: 28 (0.1%)
  • Slovene: 22 (0.1%)
  • Finnish: 22 (0.1%)
  • Croatian: 20 (0.1%)
  • Turkish: 19 (0.1%)
  • Pennsylvania German: 18 (0.09%)
  • Belgian: 18 (0.09%)
  • Romanian: 18 (0.09%)
  • Nigerian: 17 (0.09%)
  • Canadian: 16 (0.08%)
  • Lithuanian: 15 (0.08%)
  • French Canadian: 15 (0.08%)
  • Egyptian: 14 (0.07%)
  • Trinidadian and Tobagonian: 13 (0.07%)
  • Maltese: 12 (0.06%)
  • Basque: 12 (0.06%)
  • Armenian: 12 (0.06%)
  • Czech: 10 (0.05%)
  • Moroccan: 7 (0.04%)
  • African: 6 (0.03%)
  • Brazilian: 5 (0.03%)
  • Lebanese: 1 (0.01%)

Most common places of birth for foreign-born residents (%):

India
El Dorado Hills:

18.5% (1,104)
California:

5.2% (539,184)

Philippines
El Dorado Hills:

14.5% (866)
California:

7.8% (818,297)

Iran
El Dorado Hills:

7.6% (456)
California:

2.0% (206,004)

China, excluding Hong Kong and Taiwan
El Dorado Hills:

7.1% (423)
California:

6.6% (684,672)

Canada
El Dorado Hills:

6.9% (415)
California:

1.2% (127,477)

Vietnam
El Dorado Hills:

4.8% (285)
California:

4.9% (512,335)

Korea
El Dorado Hills:

4.4% (263)
California:

3.0% (315,248)

Mexico
El Dorado Hills:

3.0% (178)
California:

37.2% (3,881,193)

Ukraine
El Dorado Hills:

2.9% (171)
California:

0.6% (60,761)

Germany
El Dorado Hills:

2.3% (138)
California:

0.7% (73,304)

United Kingdom, excluding England and Scotland
El Dorado Hills:

1.7% (103)
California:

0.6% (60,582)

Poland
El Dorado Hills:

1.6% (93)
California:

0.2% (20,997)

Place of birth for U.S.-born residents:

  • This state: 30,031
  • Other state: 11,923
  • Northeast: 2,268
  • Midwest: 3,807
  • South: 2,433
  • West: 3,406

89.4% of El Dorado Hills residents lived in the same house 1 years ago.
   Out of people who lived in different houses, 23.2% lived in this county.
   Out of people who lived in different counties, 79.6% lived in California.


El Dorado Hills:

89.4%
State average:

88.9%

Education attainment for males 25 years and older:

  • No schooling: 107
  • Nursery to 4th grade: 0
  • 5th and 6th grade: 17
  • 7th and 8th grade: 0
  • 9th grade: 17
  • 10th grade: 31
  • 11th grade: 25
  • 12th grade, no diploma: 73
  • High school graduate (or equivalency): 1,608
  • Less than 1 year of college: 879
  • Some college more than 1 year, no degree: 2,690
  • Associate degree: 888
  • Bachelor's degree: 5,907
  • Master's degree: 3,004
  • Professional school degree: 727
  • Doctorate degree: 559
Educational Attainment for Males

Education attainment for females 25 years and older:

  • No schooling: 62
  • Nursery to 4th grade: 51
  • 5th and 6th grade: 0
  • 7th and 8th grade: 85
  • 9th grade: 18
  • 10th grade: 32
  • 11th grade: 0
  • 12th grade, no diploma: 260
  • High school graduate (or equivalency): 1,838
  • Less than 1 year of college: 1,217
  • Some college more than 1 year, no degree: 2,514
  • Associate degree: 1,908
  • Bachelor's degree: 5,954
  • Master's degree: 2,870
  • Professional school degree: 641
  • Doctorate degree: 397
Educational Attainment for Females
El Dorado Hills marital status for males
El Dorado Hills marital status for females

Housing units in structures:

  • One, detached: 16,102
  • One, attached: 442
  • Two: 69
  • 3 or 4: 105
  • 5 to 9: 337
  • 10 to 19: 302
  • 20 to 49: 158
  • 50 or more: 276
  • Mobile homes: 214

Median worth of mobile homes: $246,125

Housing units lacking complete plumbing facilities in 2022: 0.0%

Housing units lacking complete kitchen facilities in 2022: 0.1%

House/condo owner moved in on average 8 years ago

Renter moved in on average 2 years ago

Year householders moved into residence in El Dorado Hills
Houses and condos Apartments
Most commonly used house heating fuel in houses and condos in El Dorado Hills, CA
  • 65.5%Utility gas
  • 18.6%Electricity
  • 8.6%Bottled, tank, or LP gas
  • 4.4%Solar energy
  • 1.9%Wood
  • 0.7%Other fuel
  • 0.3%No fuel used
Most commonly used house heating fuel in apartments in El Dorado Hills, CA
  • 60.8%Utility gas
  • 29.6%Electricity
  • 5.7%Bottled, tank, or LP gas
  • 2.3%Wood
  • 1.0%Other fuel
  • 0.6%No fuel used

Private vs. public school enrollment:

Students in private schools in grades 1 to 8 (elementary and middle school): 378
Here:

7.7%
California:

10.5%

Students in private schools in grades 9 to 12 (high school): 744
Here:

21.0%
California:

8.5%

Students in private undergraduate colleges: 483
Here:

21.4%
California:

15.9%
School Enrollment by Level of School for Male Students
School Enrollment by Level of School for Female Students
Age and Sex of Sensory-Disabled Noninstitutionalized Residents
Age and Sex of Physically-Disabled Noninstitutionalized Residents
Age and Sex of Mentally-Disabled Noninstitutionalized Residents
Age and Sex of Self-Care Disabled Noninstitutionalized Residents
Age and Sex of Go-Outside-Home Disabled Noninstitutionalized Residents
Age and Sex of Noninstitutionalized Residents with Employment Disability