El Granada, CA (California) Houses and Residents
| El Granada: | $1,550,286 |
| California: | $715,900 |
Total population: 5,467 (Urban population: 5,340 (all inside urban clusters), Rural population: 480 (all nonfarm))
Houses: 2,305 (2,148 occupied: 1,790 owner occupied, 316 renter occupied)
| % of renters here: | 15% |
| State: | 44% |
Housing density: 428 houses/condos per square mile
Median price asked for vacant for-sale houses and condos in 2022 in this county: $912,464.
Median contract rent in 2022: over $2,000 (lower quartile is $1,157, upper quartile is over $2,000)
Median rent asked for vacant for-rent units in 2022: $3,705
Median gross rent in El Granada, CA in 2022: over $2,000
Housing units in El Granada with a mortgage: 1,237 (93 second mortgage, 0 home equity loan, 97 both second mortgage and home equity loan)
Houses without a mortgage: 197
Median household income for houses/condos with a mortgage: $250,865
Median household income for apartments without a mortgage: $134,548
Median monthly housing costs: $3,547
Compare current foreclosures near El Granada, CA:
| Photo | Address | Area | Beds / Baths | Price | Details |
|---|---|---|---|---|---|

|
#1
Navarra Ave
El Granada, CA 94018
|
- sq. feet
|
- baths - beds |
show details | |

|
#2
Munich St
San Francisco, CA 94112
|
1,103 sq. feet
|
1 baths 2 beds |
show details | |

|
#3
Harkness Ave
San Francisco, CA 94134
|
1,412 sq. feet
|
2 baths 3 beds |
show details | |

|
#4
Holloway Ave
San Francisco, CA 94132
|
1,110 sq. feet
|
5 baths 1 beds |
show details | |

|
#5
Madrid St
San Francisco, CA 94112
|
1,018 sq. feet
|
1 baths 4 beds |
show details | |

|
#6
Cayuga Ave
San Francisco, CA 94112
|
1,340 sq. feet
|
1 baths 3 beds |
show details | |

|
#7
Byxbee St
San Francisco, CA 94132
|
800 sq. feet
|
1 baths 1 beds |
show details | |

|
#8
Fleetwood Dr
San Bruno, CA 94066
|
1,440 sq. feet
|
3 baths 5 beds |
show details | |

|
#9
Lobos St
San Francisco, CA 94112
|
750 sq. feet
|
1 baths 2 beds |
show details | |

|
#10
Cedar Ct
Daly City, CA 94014
|
1,200 sq. feet
|
2 baths 3 beds |
show details |
| Photo | Address | Area | Beds / Baths | Price | Details |
|---|---|---|---|---|---|

|
#11
Hollister Ave
San Francisco, CA 94124
|
1,000 sq. feet
|
3 baths 5 beds |
show details | |

|
#12
S Humboldt St
San Mateo, CA 94401
|
1,290 sq. feet
|
2 baths 3 beds |
show details | |

|
#13
Manor Dr
Pacifica, CA 94044
|
1,360 sq. feet
|
2 baths 3 beds |
show details | |

|
#14
Hemlock Ave
Redwood City, CA 94061
|
1,440 sq. feet
|
2 baths 4 beds |
show details | |

|
#15
Mirada Rd
Half Moon Bay, CA 94019
|
2,450 sq. feet
|
4 baths 4 beds |
show details | |

|
#16
Hempstead Pl
Redwood City, CA 94061
|
1,020 sq. feet
|
1 baths 3 beds |
show details | |

|
#17
Alameda De Las Pulgas
Redwood City, CA 94061
|
1,250 sq. feet
|
2 baths 3 beds |
show details | |

|
#18
Chestnut St
San Carlos, CA 94070
|
1,390 sq. feet
|
2 baths 3 beds |
show details | |

|
#19
Cymbidium Cir
South San Francisco, CA 94080
|
1,610 sq. feet
|
2 baths 3 beds |
show details | |

|
#20
Vienna St
San Francisco, CA 94112
|
760 sq. feet
|
1 baths 3 beds |
show details |
| Photo | Address | Area | Beds / Baths | Price | Details |
|---|---|---|---|---|---|

|
#21
Minerva St
San Francisco, CA 94112
|
878 sq. feet
|
1 baths 2 beds |
show details | |

|
#22
31st Ave
San Francisco, CA 94116
|
1,115 sq. feet
|
1 baths 2 beds |
show details | |

|
#23
San Bruno Ave
San Francisco, CA 94134
|
2,900 sq. feet
|
5 baths 6 beds |
show details | |

|
#24
Folsom St
San Francisco, CA 94110
|
1,350 sq. feet
|
1 baths 3 beds |
show details | |

|
#25
Wyandotte Ave
Daly City, CA 94014
|
1,680 sq. feet
|
2 baths 3 beds |
show details | |

|
#26
Ford St
Daly City, CA 94014
|
1,770 sq. feet
|
1 baths 3 beds |
show details | |

|
#27
Park Manor Dr
Daly City, CA 94015
|
1,770 sq. feet
|
2 baths 3 beds |
show details | |

|
#28
Wildwood Ave
Daly City, CA 94015
|
1,120 sq. feet
|
1 baths 3 beds |
show details | |

|
#29
Wildwood Ave
Daly City, CA 94015
|
1,120 sq. feet
|
1 baths 3 beds |
show details | |

|
#30
Hillside Blvd
Daly City, CA 94014
|
2,250 sq. feet
|
3 baths 3 beds |
show details |
| Photo | Address | Area | Beds / Baths | Price | Details |
|---|---|---|---|---|---|

|
#31
Melissa Cir
Daly City, CA 94014
|
1,790 sq. feet
|
3 baths 4 beds |
show details | |

|
#32
Vasquez Ave
San Francisco, CA 94127
|
1,663 sq. feet
|
1 baths 2 beds |
show details | |

|
#33
Hempstead Pl
Redwood City, CA 94061
|
1,020 sq. feet
|
1 baths 3 beds |
show details | |

|
#34
Alexander Ave
Daly City, CA 94014
|
970 sq. feet
|
1 baths 2 beds |
show details | |

|
#35
Hilton St
Redwood City, CA 94063
|
954 sq. feet
|
1 baths 2 beds |
show details | |

|
#36
Accacia St
Daly City, CA 94014
|
1,950 sq. feet
|
3 baths 3 beds |
show details | |

|
#37
Valota Rd
Redwood City, CA 94061
|
950 sq. feet
|
1 baths 2 beds |
show details | |

|
#38
31st Ave
San Francisco, CA 94116
|
1,115 sq. feet
|
1 baths 2 beds |
show details | |

|
#39
Irvington St
Daly City, CA 94014
|
1,720 sq. feet
|
2 baths 4 beds |
show details | |

|
#40
Bellevue Ave
Daly City, CA 94014
|
880 sq. feet
|
1 baths 2 beds |
show details |
| Photo | Address | Area | Beds / Baths | Price | Details |
|---|---|---|---|---|---|

|
#41
Rhine St
San Francisco, CA 94112
|
828 sq. feet
|
1 baths 2 beds |
show details | |

|
#42
Irvington St
Daly City, CA 94014
|
1,230 sq. feet
|
1 baths 2 beds |
show details | |

|
#43
Banks St
San Francisco, CA 94110
|
1,300 sq. feet
|
3 baths 3 beds |
show details | |

|
#44
Irvington St
Daly City, CA 94014
|
1,390 sq. feet
|
1 baths 2 beds |
show details | |

|
#45
Brunswick St
Daly City, CA 94014
|
1,560 sq. feet
|
1 baths 3 beds |
show details | |

|
#46
Liebig St
San Francisco, CA 94112
|
862 sq. feet
|
1 baths 1 beds |
show details | |

|
#47
Oceanview Ter Apt 112
San Francisco, CA 94132
|
669 sq. feet
|
1 baths 1 beds |
show details | |

|
#48
Sears St
San Francisco, CA 94112
|
1,140 sq. feet
|
1 baths 2 beds |
show details | |

|
#49
Village Ln
Daly City, CA 94015
|
1,420 sq. feet
|
1 baths 2 beds |
show details | |

|
Check over 1 million property listings on Foreclosure.com!
|
browse all offers | |||


 | What do people in Monterey/Carmel do for living (34 replies) |
| Is San Jose a world class city? (185 replies) |
| Wealthiest Cities and Towns in California Ranked by Average Family Income( $200,000+) (14 replies) |
| Pros and Cons of El Granada? (0 replies) |
| Where to settle in the Bay Area? (36 replies) |
| Working in Foster City - where to live w family (18 replies) |

Median year apartment built: 1972
Household type by relationship:
Households: 5,463- Male householders: 1,223 (129 living alone), Female householders: 830 (174 living alone)
1,285 spouses (1,173 opposite-sex spouses), 134 unmarried partners, (134 opposite-sex unmarried partners), 1,441 children (1,441 natural, 0 adopted, 0 stepchildren), 76 grandchildren, 87 brothers or sisters, 39 parents, 0 foster children, 71 other relatives, 248 non-relatives
- In group quarters: 24
Size of family households: 780 2-persons, 471 3-persons, 226 4-persons, 132 5-persons, 6 7-or-more-persons.
Size of nonfamily households: 344 1-person, 115 2-persons.
595 married couples with children.
247 single-parent households (119 men, 128 women).
88.7% of residents of El Granada speak English at home.
7.1% of residents speak Spanish at home (71% speak English very well, 11% speak English well, 16% speak English not well, 2% don't speak English at all).
3.5% of residents speak other Indo-European language at home (91% speak English very well, 9% speak English well).
1.1% of residents speak Asian or Pacific Island language at home (60% speak English very well, 40% speak English well).
Foreign born population: 705 (12.9%)
(60.0% of them are naturalized citizens)
| Here: | 6.5 |
| State: | 6.0 |
| Here: | 5.2 |
| State: | 3.9 |

- Bedrooms in owner-occupied houses and condos in El Granada, California
- 20no bedroom
- 01 bedroom
- 1452 bedrooms
- 8723 bedrooms
- 6304 bedrooms
- 1255+ bedrooms

- Bedrooms in renter-occupied apartments in El Granada, California
- 0no bedroom
- 721 bedroom
- 1362 bedrooms
- 703 bedrooms
- 384 bedrooms
- 05+ bedrooms

- Cars and other vehicles available in El Granada in owner-occupied houses/condos
- 23no vehicle
- 2071 vehicle
- 8232 vehicles
- 3783 vehicles
- 3414 vehicles
- 195+ vehicles

- Cars and other vehicles available in El Granada in renter-occupied apartments
- 0no vehicle
- 1201 vehicle
- 1582 vehicles
- 173 vehicles
- 224 vehicles
- 05+ vehicles

- Rooms in owner-occupied houses in El Granada, California
- 201 room
- 02 rooms
- 483 rooms
- 1804 rooms
- 2655 rooms
- 4226 rooms
- 3457 rooms
- 2888 rooms
- 2239+ rooms

- Rooms in renter-occupied apartments in El Granada, California
- 01 room
- 202 rooms
- 163 rooms
- 354 rooms
- 1015 rooms
- 756 rooms
- 247 rooms
- 468 rooms
- 09+ rooms


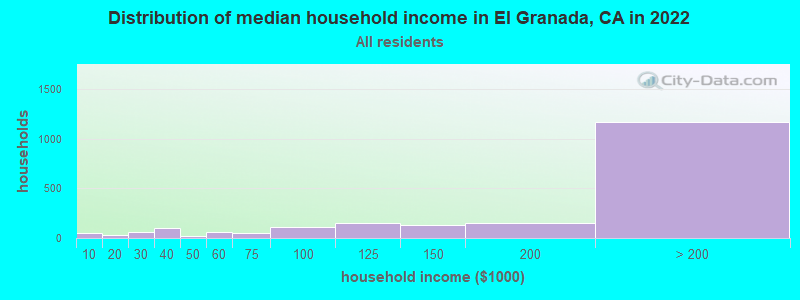
El Granada, CA household income distribution

- 52Less than $10,000
- 34$10,000 to $19,999
- 65$20,000 to $29,999
- 96$30,000 to $39,999
- 24$40,000 to $49,999
- 61$50,000 to $59,999
- 50$60,000 to $74,999
- 110$75,000 to $99,999
- 151$100,000 to $124,999
- 126$125,000 to $149,999
- 155$150,000 to $199,999
- 1,169$200,000 or more
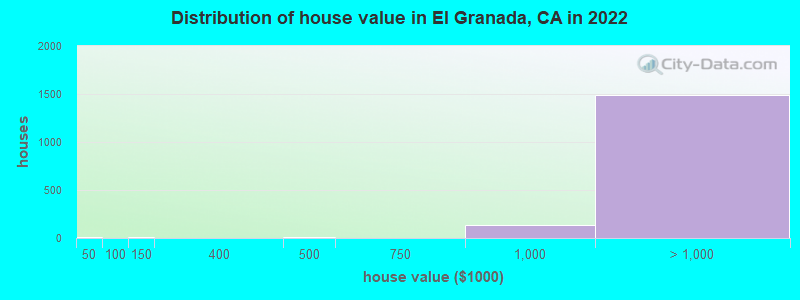
Home value of owner - occupied houses in 2022 in El Granada, CA
-
- 15Less than $10,000
- 11$100,000 to $124,999
- 8$400,000 to $499,999
- 133$750,000 to $999,999
- 764$1,000,000 to $1,499,999
- 378$1,500,000 to $1,999,999
- 344$2,000,000 or more
Rent paid by renters in 2022 in El Granada, CA
-
- 24$600 to $649
- 34$1,000 to $1,249
- 18$1,250 to $1,499
- 41$2,000 to $2,499
- 62$2,500 to $2,999
- 17$3,000 to $3,499
- 59$3,500 or more
- 42No cash rent


Percentage of workers working in this county: 75.8%
Number of people working at home: 845 (31.0% of all workers)
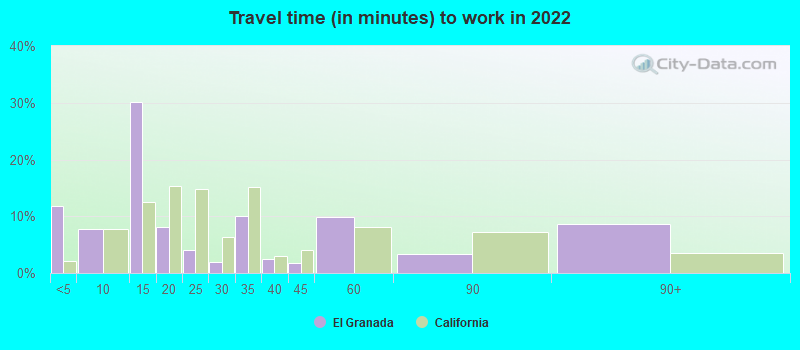
Travel time to work (commute)
- Less than 5 minutes: 67
- 5 to 9 minutes: 159
- 10 to 14 minutes: 246
- 15 to 19 minutes: 127
- 20 to 24 minutes: 104
- 25 to 29 minutes: 134
- 30 to 34 minutes: 194
- 35 to 39 minutes: 167
- 40 to 44 minutes: 111
- 45 to 59 minutes: 326
- 60 to 89 minutes: 152
- 90 or more minutes: 29
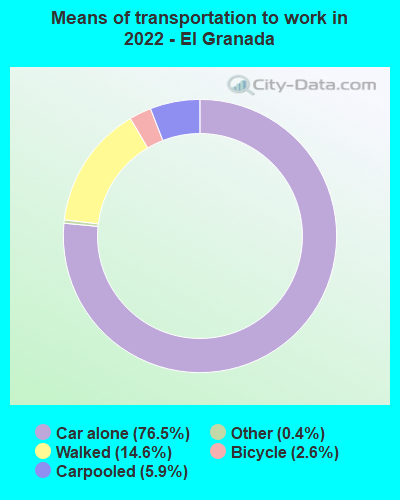
Means of transportation to work:
- Drove a car alone: 701 (42.7%)
- Carpooled: 58 (3.5%)
- Taxi: 3 (0.2%)
- Bicycle: 27 (1.6%)
- Walked: 150 (9.1%)
- Worked at home: 845 (51.5%)

- Unemployment by race in 2022
- Unemployment rate for White non-Hispanic residents
- 12.3%Males
- 1.2%Females

- Year of entry for the foreign-born population in El Granada, California
- 1592010 or later
- 242000 to 2009
- 1111990 to 1999
- 2871980 to 1989
- 1551970 to 1979
- 174Before 1970
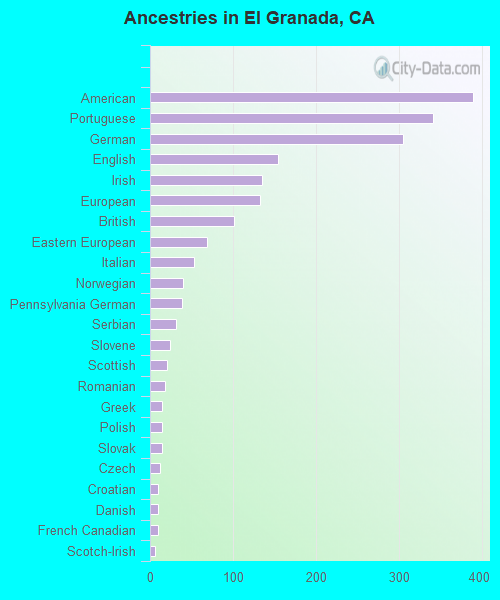
First ancestries reported:
- American: 389 (15.9%)
- Portuguese: 341 (13.9%)
- German: 305 (12.5%)
- English: 154 (6.3%)
- Irish: 135 (5.5%)
- European: 133 (5.4%)
- British: 101 (4.1%)
- Eastern European: 69 (2.8%)
- Italian: 53 (2.2%)
- Norwegian: 40 (1.6%)
- Pennsylvania German: 39 (1.6%)
- Serbian: 31 (1.3%)
- Slovene: 24 (1.0%)
- Scottish: 21 (0.9%)
- Romanian: 18 (0.7%)
- Greek: 15 (0.6%)
- Polish: 15 (0.6%)
- Slovak: 15 (0.6%)
- Czech: 12 (0.5%)
- Croatian: 10 (0.4%)
- Danish: 10 (0.4%)
- French Canadian: 10 (0.4%)
- Scotch-Irish: 6 (0.2%)
- Scandinavian: 1 (0.04%)
Most common places of birth for foreign-born residents (%):
| El Granada: | 27.3% (195) |
| California: | 37.2% (3,881,193) |
| El Granada: | 17.6% (126) |
| California: | 0.2% (25,462) |
| El Granada: | 13.9% (99) |
| California: | 1.2% (127,477) |
| El Granada: | 12.7% (91) |
| California: | 0.0% (4,595) |
| El Granada: | 5.5% (39) |
| California: | 5.2% (539,184) |
| El Granada: | 4.1% (29) |
| California: | 0.1% (7,249) |
| El Granada: | 3.8% (27) |
| California: | 7.8% (818,297) |
| El Granada: | 3.2% (23) |
| California: | 6.6% (684,672) |
| El Granada: | 3.1% (22) |
| California: | 1.7% (176,274) |
| El Granada: | 2.7% (19) |
| California: | 0.1% (5,897) |
| El Granada: | 2.1% (15) |
| California: | 0.6% (57,953) |
| El Granada: | 1.7% (12) |
| California: | 0.5% (53,222) |
Place of birth for U.S.-born residents:
- This state: 3,229
- Other state: 1,489
- Northeast: 577
- Midwest: 499
- South: 191
- West: 204
89.4% of El Granada residents lived in the same house 1 years ago.
Out of people who lived in different houses, 22.5% lived in this county.
Out of people who lived in different counties, 70.6% lived in California.
| El Granada: | 89.4% |
| State average: | 88.9% |
Education attainment for males 25 years and older:
- No schooling: 0
- Nursery to 4th grade: 3
- 5th and 6th grade: 0
- 7th and 8th grade: 3
- 9th grade: 0
- 10th grade: 56
- 11th grade: 0
- 12th grade, no diploma: 0
- High school graduate (or equivalency): 305
- Less than 1 year of college: 230
- Some college more than 1 year, no degree: 230
- Associate degree: 120
- Bachelor's degree: 895
- Master's degree: 202
- Professional school degree: 117
- Doctorate degree: 69

Education attainment for females 25 years and older:
- No schooling: 0
- Nursery to 4th grade: 0
- 5th and 6th grade: 0
- 7th and 8th grade: 0
- 9th grade: 0
- 10th grade: 0
- 11th grade: 2
- 12th grade, no diploma: 178
- High school graduate (or equivalency): 148
- Less than 1 year of college: 46
- Some college more than 1 year, no degree: 91
- Associate degree: 337
- Bachelor's degree: 530
- Master's degree: 388
- Professional school degree: 188
- Doctorate degree: 15


Housing units in structures:
- One, detached: 2,086
- One, attached: 72
- Two: 41
- 5 to 9: 43
- 20 to 49: 61
House/condo owner moved in on average 20 years ago
Renter moved in on average 6 years ago

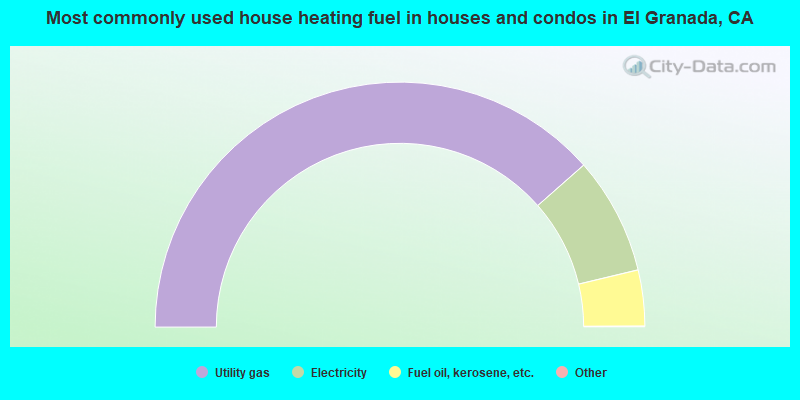
- 77.1%Utility gas
- 15.5%Electricity
- 7.4%Fuel oil, kerosene, etc.
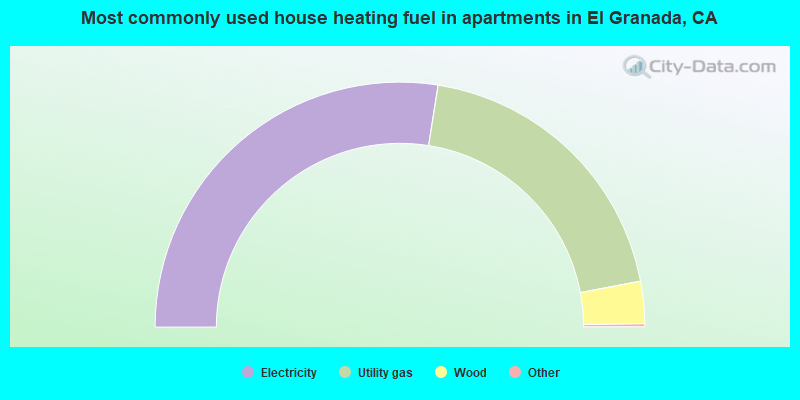
- 55.2%Electricity
- 39.2%Utility gas
- 5.6%Wood
Private vs. public school enrollment:
| Here: | 44.1% |
| California: | 10.5% |
| Here: | 30.1% |
| California: | 8.5% |
| Here: | 14.5% |
| California: | 15.9% |


