Housing density: 1,880 houses/condos per square mile
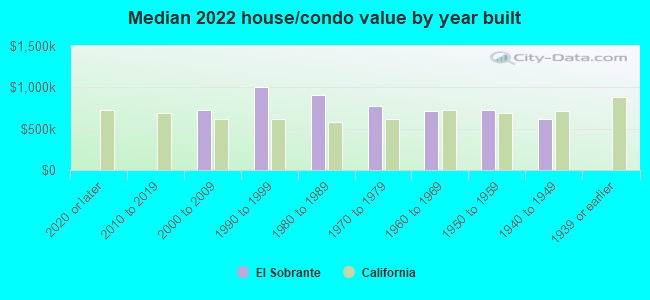
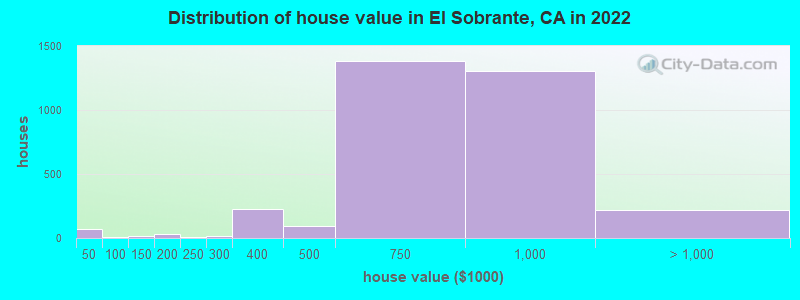
Median price asked for vacant for-sale houses and condos in 2022: $929,689.
Median contract rent in 2022: $1,751 (lower quartile is $1,505, upper quartile is over $2,000)
Median rent asked for vacant for-rent units in 2022: $2,041
Median gross rent in El Sobrante, CA in 2022: over $2,000
Housing units in El Sobrante with a mortgage: 2,358 (333 second mortgage, 0 home equity loan, 268 both second mortgage and home equity loan) Houses without a mortgage: 24
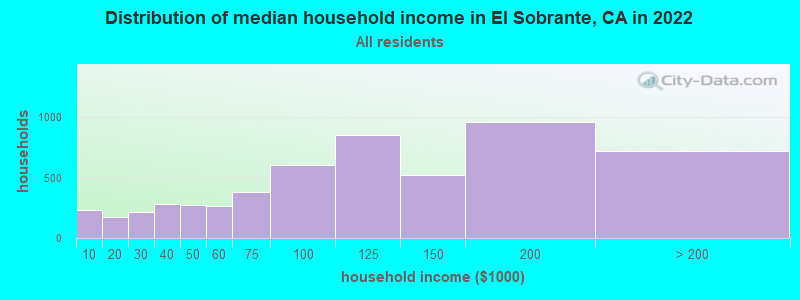
Median household income for houses/condos with a mortgage: $127,423
Median household income for apartments without a mortgage: $111,635
Size of family households: 1,417 2-persons, 984 3-persons, 1,136 4-persons, 326 5-persons, 116 6-persons, 152 7-or-more-persons.
Size of nonfamily households: 925 1-person, 378 2-persons, 65 3-persons.
1,634 married couples with children.
779 single-parent households (238 men, 541 women).
60.5% of residents of El Sobrante speak English at home.
19.7% of residents speak Spanish at home (56% speak English very well, 21% speak English well, 17% speak English not well, 5% don't speak English at all).
8.8% of residents speak other Indo-European language at home (53% speak English very well, 26% speak English well, 20% speak English not well).
10.0% of residents speak Asian or Pacific Island language at home (58% speak English very well, 26% speak English well, 8% speak English not well, 8% don't speak English at all).
1.1% of residents speak other language at home (81% speak English very well, 5% speak English well, 14% speak English not well).
Foreign born population: 4,554 (29.5%)
(51.8% of them are naturalized citizens)
Percentage of workers working in this county: 54.9% Number of people working at home: 1,231 (16.6% of all workers)
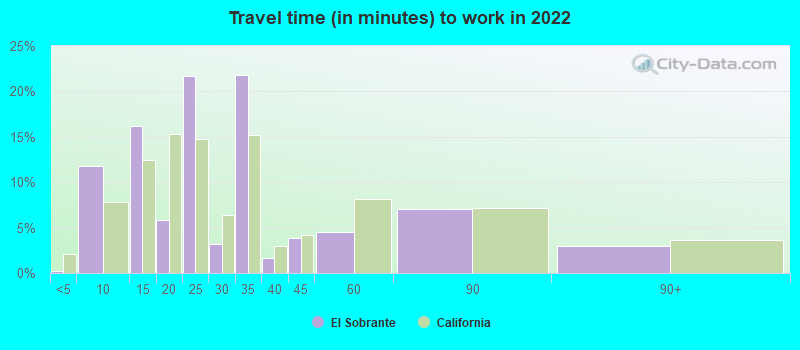
Travel time to work (commute)
Less than 5 minutes: 63
5 to 9 minutes: 248
10 to 14 minutes: 455
15 to 19 minutes: 791
20 to 24 minutes: 977
25 to 29 minutes: 199
30 to 34 minutes: 1,134
35 to 39 minutes: 251
40 to 44 minutes: 331
45 to 59 minutes: 604
60 to 89 minutes: 895
90 or more minutes: 179
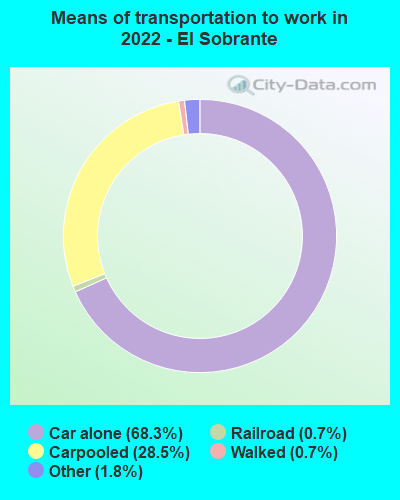
Means of transportation to work:
Drove a car alone: 1,225 (41.2%)
Carpooled: 571 (19.2%)
Light rail, streetcar or trolley: 8 (0.3%)
Taxi: 35 (1.2%)
Walked: 17 (0.6%)
Worked at home: 1,231 (41.4%)
Unemployment by race in 2022
Unemployment rate for White non-Hispanic residents
4.5%Males
2.1%Females
Unemployment rate for Black residents
5.5%Males
8.8%Females
Unemployment rate for Asian residents
1.1%Males
1.3%Females
Unemployment rate for other race residents
12.3%Males
Unemployment rate for two or more race residents
3.7%Males
12.2%Females
Unemployment rate for Hispanic or Latino residents
5.5%Males
7.7%Females
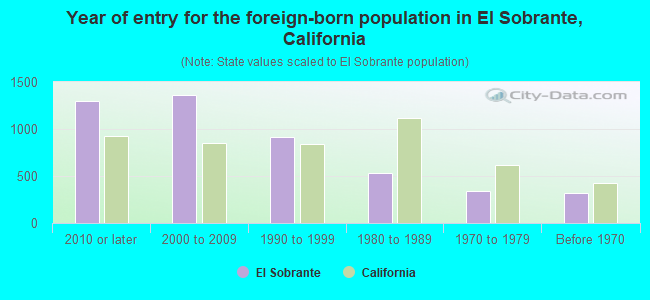
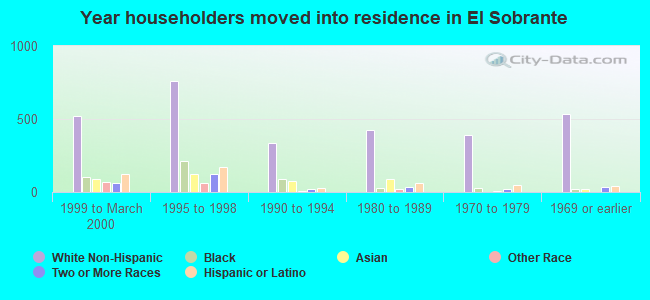
Year of entry for the foreign-born population in El Sobrante, California
1,2932010 or later
1,3632000 to 2009
9191990 to 1999
5361980 to 1989
3361970 to 1979
323Before 1970
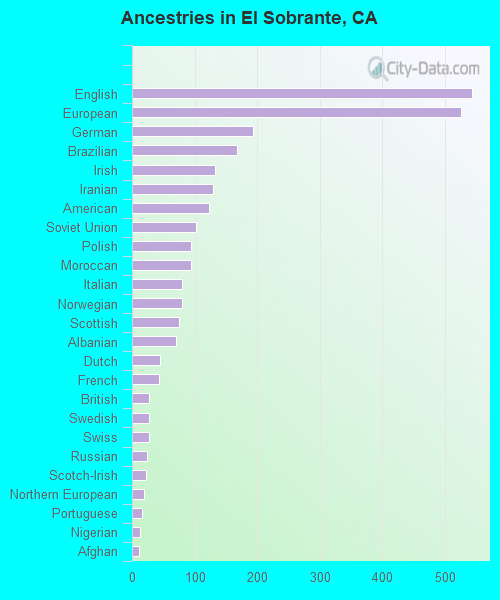
First ancestries reported:
English: 544 (5.8%)
European: 526 (5.6%)
German: 194 (2.1%)
Brazilian: 168 (1.8%)
Irish: 133 (1.4%)
Iranian: 130 (1.4%)
American: 124 (1.3%)
Soviet Union: 103 (1.1%)
Polish: 95 (1.0%)
Moroccan: 94 (1.0%)
Italian: 80 (0.8%)
Norwegian: 80 (0.8%)
Scottish: 75 (0.8%)
Albanian: 70 (0.7%)
Dutch: 45 (0.5%)
French: 43 (0.5%)
British: 27 (0.3%)
Swedish: 27 (0.3%)
Swiss: 27 (0.3%)
Russian: 24 (0.3%)
Scotch-Irish: 22 (0.2%)
Northern European: 19 (0.2%)
Portuguese: 16 (0.2%)
Nigerian: 13 (0.1%)
Afghan: 12 (0.1%)
Lithuanian: 10 (0.1%)
Cape Verdean: 10 (0.1%)
New Zealander: 8 (0.08%)
Jamaican: 8 (0.08%)
Assyrian: 7 (0.07%)
Most common places of birth for foreign-born residents (%):
Mexico
El Sobrante:
21.6% (932)
California:
37.2% (3,881,193)
China, excluding Hong Kong and Taiwan
El Sobrante:
8.4% (361)
California:
6.6% (684,672)
Philippines
El Sobrante:
8.3% (356)
California:
7.8% (818,297)
India
El Sobrante:
7.5% (324)
California:
5.2% (539,184)
El Salvador
El Sobrante:
7.2% (309)
California:
4.2% (440,287)
Nicaragua
El Sobrante:
4.0% (172)
California:
0.6% (58,161)
Pakistan
El Sobrante:
3.9% (168)
California:
0.5% (49,399)
Nepal
El Sobrante:
3.6% (157)
California:
0.2% (16,541)
Brazil
El Sobrante:
3.4% (147)
California:
0.5% (53,222)
Peru
El Sobrante:
3.0% (130)
California:
0.7% (74,025)
Other South Central Asia
El Sobrante:
2.6% (114)
California:
0.0% (2,667)
Other Eastern Europe
El Sobrante:
1.9% (82)
California:
0.2% (17,699)
Iran
El Sobrante:
1.8% (79)
California:
2.0% (206,004)
Costa Rica
El Sobrante:
1.7% (74)
California:
0.1% (12,623)
Bahamas
El Sobrante:
1.7% (73)
California:
0.0% (668)
Guatemala
El Sobrante:
1.6% (68)
California:
2.8% (290,436)
Place of birth for U.S.-born residents:
This state: 8,130
Other state: 2,529
Northeast: 441
Midwest: 647
South: 981
West: 447
91.3% of El Sobrante residents lived in the same house 1 years ago. Out of people who lived in different houses, 41.1% lived in this county. Out of people who lived in different counties, 93.2% lived in California.
El Sobrante:
91.3%
State average:
88.9%
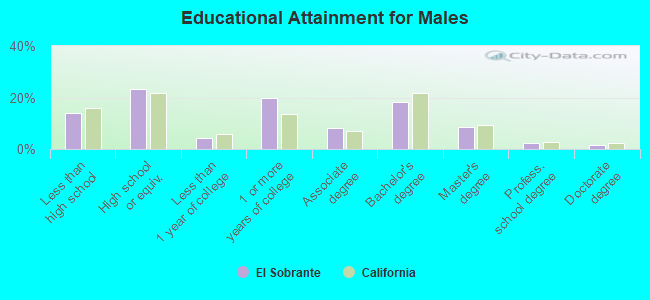
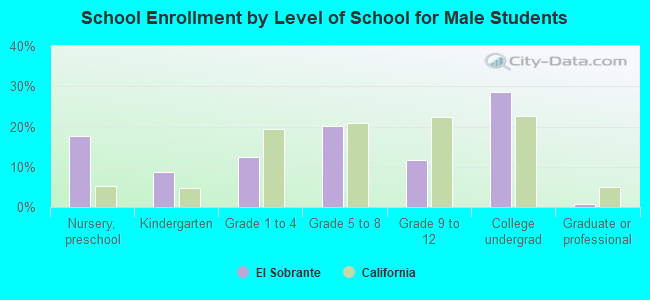
Education attainment for males 25 years and older:
No schooling: 240
Nursery to 4th grade: 110
5th and 6th grade: 14
7th and 8th grade: 5
9th grade: 36
10th grade: 30
11th grade: 57
12th grade, no diploma: 317
High school graduate (or equivalency): 1,362
Less than 1 year of college: 243
Some college more than 1 year, no degree: 1,155
Associate degree: 470
Bachelor's degree: 1,079
Master's degree: 509
Professional school degree: 136
Doctorate degree: 93
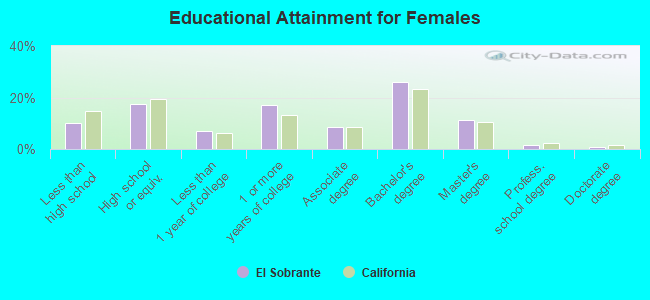
Education attainment for females 25 years and older:
No schooling: 173
Nursery to 4th grade: 17
5th and 6th grade: 52
7th and 8th grade: 1
9th grade: 75
10th grade: 38
11th grade: 121
12th grade, no diploma: 99
High school graduate (or equivalency): 1,018
Less than 1 year of college: 403
Some college more than 1 year, no degree: 981
Associate degree: 484
Bachelor's degree: 1,512
Master's degree: 659
Professional school degree: 99
Doctorate degree: 43
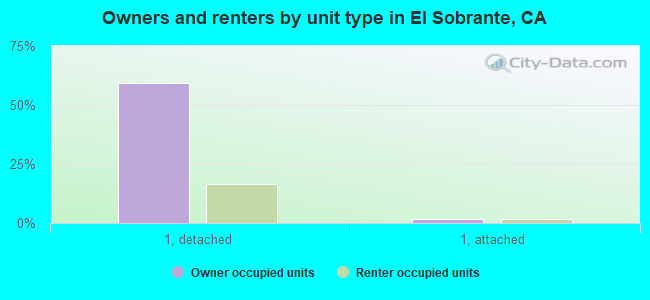
Housing units in structures:
One, detached: 4,196
One, attached: 249
Two: 123
3 or 4: 258
5 to 9: 209
10 to 19: 170
20 to 49: 362
50 or more: 209
Mobile homes: 39
Boats, RVs, vans, etc.: 10
Housing units lacking complete plumbing facilities in 2022: 1.3%
Housing units lacking complete kitchen facilities in 2022: 0.9%
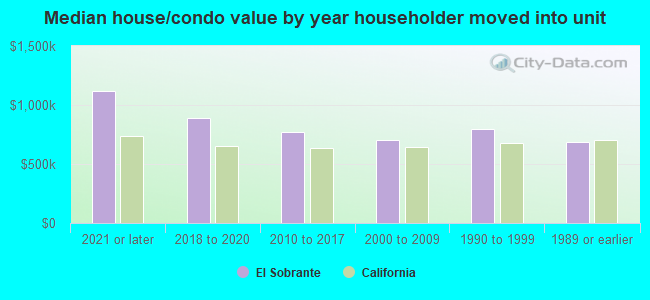
House/condo owner moved in on average 17 years ago