Elberta, UT (Utah) Houses and Residents
| Elberta: | |
| Utah: |
Mean price in 2022:
Detached houses: $379,335
Here: $379,335 State: $607,750
Total population: 256 (Urban population: 0, Rural population: 216 (all nonfarm))
Houses: 78 (69 occupied: 69 owner occupied, 0 renter occupied)
| % of renters here: | 0% |
| State: | 29% |
Housing density: 6 houses/condos per square mile
Median price asked for vacant for-sale houses and condos in 2022 in this county: $1,282,768.
Median gross rent in Elberta, UT in 2022: $-692,731,828
Housing units in Elberta with a mortgage: 60 (0 second mortgage, 0 home equity loan, 0 both second mortgage and home equity loan)
Houses without a mortgage: 0
Compare current foreclosures near Elberta, UT:
| Photo | Address | Area | Beds / Baths | Price | Details |
|---|---|---|---|---|---|

|
#1
N Orchard Ln
Santaquin, UT 84655
|
565 sq. feet
|
1 baths 2 beds |
show details | |

|
#2
S Chrisman Dr
Salem, UT 84653
|
2,838 sq. feet
|
3 baths 6 beds |
show details | |

|
#3
E 180 N
Santaquin, UT 84655
|
- sq. feet
|
2 baths 3 beds |
show details | |

|
#4
Stonebrook Ln
Santaquin, UT 84655
|
1,486 sq. feet
|
2 baths 3 beds |
show details | |

|
#5
N 500 E
Payson, UT 84651
|
2,876 sq. feet
|
2 baths 4 beds |
show details | |

|
#6
W 400 S
Payson, UT 84651
|
1,534 sq. feet
|
3 baths 3 beds |
show details | |

|
#7
E 1290 S
Payson, UT 84651
|
3,993 sq. feet
|
3 baths 3 beds |
show details | |

|
#8
N 250 W
Payson, UT 84651
|
3,380 sq. feet
|
4 baths 4 beds |
show details | |

|
#9
W 300 N
Payson, UT 84651
|
872 sq. feet
|
1 baths 2 beds |
show details | |

|
#10
S 200 E
Payson, UT 84651
|
1,147 sq. feet
|
1 baths 3 beds |
show details |
| Photo | Address | Area | Beds / Baths | Price | Details |
|---|---|---|---|---|---|

|
#11
E 300 N
Payson, UT 84651
|
1,616 sq. feet
|
2 baths 3 beds |
show details | |

|
#12
E 600 S
Payson, UT 84651
|
1,760 sq. feet
|
3 baths 4 beds |
show details | |

|
#13
E 200 N
Payson, UT 84651
|
1,806 sq. feet
|
1 baths 4 beds |
show details | |

|
#14
Pommel Dr
Payson, UT 84651
|
1,060 sq. feet
|
2 baths 3 beds |
show details | |

|
#15
Tomahawk Dr
Payson, UT 84651
|
1,080 sq. feet
|
1 baths 3 beds |
show details | |

|
#16
S Loafer View Dr
Payson, UT 84651
|
1,962 sq. feet
|
3 baths 3 beds |
show details | |

|
#17
E 400 N
Payson, UT 84651
|
1,460 sq. feet
|
1 baths 3 beds |
show details | |

|
#18
S Canyon Rd
Santaquin, UT 84655
|
1,970 sq. feet
|
2 baths 3 beds |
show details | |

|
#19
S 1600 W
Payson, UT 84651
|
3,136 sq. feet
|
2 baths 6 beds |
show details | |

|
#20
Cougar Cir
Payson, UT 84651
|
1,627 sq. feet
|
2 baths 3 beds |
show details |
| Photo | Address | Area | Beds / Baths | Price | Details |
|---|---|---|---|---|---|

|
#21
W 760 S
Salem, UT 84653
|
1,313 sq. feet
|
2 baths 3 beds |
show details | |

|
#22
E 960 S
Salem, UT 84653
|
3,465 sq. feet
|
3 baths 3 beds |
show details | |

|
#23
E 320 N
Salem, UT 84653
|
2,536 sq. feet
|
2 baths 4 beds |
show details | |

|
#24
Spur Ct
Payson, UT 84651
|
1,738 sq. feet
|
2 baths 3 beds |
show details | |

|
#25
W 200 N
Payson, UT 84651
|
1,710 sq. feet
|
2 baths 3 beds |
show details | |

|
#26
S 580 W
Payson, UT 84651
|
2,028 sq. feet
|
2 baths 3 beds |
show details | |

|
#27
N Cherry Ln
Santaquin, UT 84655
|
2,468 sq. feet
|
3 baths 3 beds |
show details | |

|
#28
N 280 W
Santaquin, UT 84655
|
1,312 sq. feet
|
2 baths 3 beds |
show details | |

|
#29
E 400 N
Santaquin, UT 84655
|
1,345 sq. feet
|
2 baths 3 beds |
show details | |

|
#30
N Peach St
Santaquin, UT 84655
|
1,627 sq. feet
|
2 baths 3 beds |
show details |
| Photo | Address | Area | Beds / Baths | Price | Details |
|---|---|---|---|---|---|

|
#31
N Peach St
Santaquin, UT 84655
|
1,032 sq. feet
|
2 baths 3 beds |
show details | |

|
#32
N Peach St
Santaquin, UT 84655
|
936 sq. feet
|
1 baths 3 beds |
show details | |

|
#33
S 420 W
Salem, UT 84653
|
1,899 sq. feet
|
2 baths 3 beds |
show details | |

|
#34
S 910 W
Payson, UT 84651
|
1,641 sq. feet
|
2 baths 3 beds |
show details | |

|
#35
N 500 W, Trlr 51
Payson, UT 84651
|
- sq. feet
|
- baths - beds |
show details | |

|
#36
S Center St Apt 4
Santaquin, UT 84655
|
- sq. feet
|
- baths - beds |
show details | |

|
#37
N Lark Ridge Rd
Mona, UT 84645
|
- sq. feet
|
- baths - beds |
show details | |

|
#38
N 500 E
Salem, UT 84653
|
- sq. feet
|
- baths - beds |
show details | |

|
#39
S 200 E
Salem, UT 84653
|
- sq. feet
|
- baths - beds |
show details | |

|
#40
W Divide Dr
Santaquin, UT 84655
|
- sq. feet
|
- baths - beds |
show details |
| Photo | Address | Area | Beds / Baths | Price | Details |
|---|---|---|---|---|---|

|
#41
N 500 W
Santaquin, UT 84655
|
- sq. feet
|
- baths - beds |
show details | |

|
#42
W Dogwood Dr
Santaquin, UT 84655
|
- sq. feet
|
- baths - beds |
show details | |

|
#43
N 1310 E
Payson, UT 84651
|
- sq. feet
|
- baths - beds |
show details | |

|
#44
N 1280 E
Payson, UT 84651
|
- sq. feet
|
- baths - beds |
show details | |

|
#45
N 90 W
Santaquin, UT 84655
|
- sq. feet
|
- baths - beds |
show details | |

|
#46
E 50 S, # A
Payson, UT 84651
|
- sq. feet
|
- baths - beds |
show details | |

|
#47
E 100 S, Apt 135
Payson, UT 84651
|
- sq. feet
|
- baths - beds |
show details | |

|
#48
S Center St
Santaquin, UT 84655
|
- sq. feet
|
- baths - beds |
show details | |

|
#49
S Center St Apt 6
Santaquin, UT 84655
|
- sq. feet
|
- baths - beds |
show details | |

|
Check over 1 million property listings on Foreclosure.com!
|
browse all offers | |||

Latest news about housing in Elberta, UT collected exclusively by city-data.com from local newspapers, TV, and radio stations


Household type by relationship:
Households: 329- Male householders: 30 (0 living alone), Female householders: 36 (0 living alone)
30 spouses (30 opposite-sex spouses), 0 unmarried partners, (0 opposite-sex unmarried partners), 72 children (72 natural, 0 adopted, 0 stepchildren), 116 grandchildren, 0 brothers or sisters, 15 parents, 0 foster children, 26 other relatives, 0 non-relatives
Size of family households: 40 4-persons, 30 7-or-more-persons.
22 married couples with children.
0 single-parent households (0 men, 0 women).
99.3% of residents of Elberta speak English at home.
| Here: | 9.9 |
| State: | 7.6 |
| Here: | -666666666.0 |
| State: | 4.3 |

- Bedrooms in owner-occupied houses and condos in Elberta, Utah
- 0no bedroom
- 01 bedroom
- 02 bedrooms
- 323 bedrooms
- 04 bedrooms
- 385+ bedrooms

- Cars and other vehicles available in Elberta in owner-occupied houses/condos
- 0no vehicle
- 01 vehicle
- 02 vehicles
- 03 vehicles
- 704 vehicles
- 05+ vehicles

- Rooms in owner-occupied houses in Elberta, Utah
- 01 room
- 02 rooms
- 03 rooms
- 04 rooms
- 05 rooms
- 326 rooms
- 07 rooms
- 08 rooms
- 389+ rooms


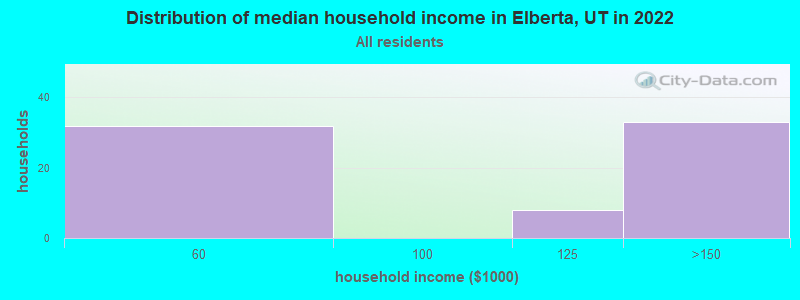
Elberta, UT household income distribution

- 32$50,000 to $59,999
- 8$100,000 to $124,999
- 33$125,000 to $149,999
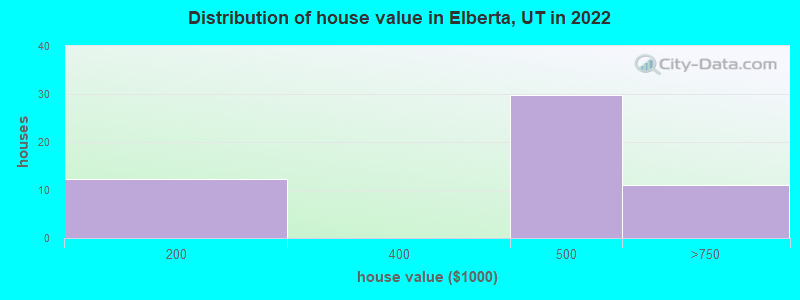
Home value of owner - occupied houses in 2022 in Elberta, UT
-
- 12$175,000 to $199,999
- 29$400,000 to $499,999
- 10$500,000 to $749,999

Percentage of workers working in this county: 100.0%
Number of people working at home: 0 (0.0% of all workers)
Travel time to work (commute)
- Less than 5 minutes: 5
- 5 to 9 minutes: 31
- 10 to 14 minutes: 13
- 15 to 19 minutes: 27
- 20 to 24 minutes: 0
- 25 to 29 minutes: 0
- 30 to 34 minutes: 10
- 35 to 39 minutes: 0
- 40 to 44 minutes: 29
- 45 to 59 minutes: 0
- 60 to 89 minutes: 0
- 90 or more minutes: 0
Means of transportation to work:
- Drove a car alone: 57 (80.3%)
- Carpooled: 14 (19.7%)


- Year of entry for the foreign-born population in Elberta, Utah
- 351995 to March 2000
- 01990 to 1994
- 21985 to 1989
- 01980 to 1984
- 11975 to 1979
- 01970 to 1974
- 01965 to 1969
- 0Before 1965
Most common places of birth for foreign-born residents (%):
| Elberta: | 100.0% (38) |
| Utah: | 41.9% (66,478) |
Place of birth for U.S.-born residents:
- This state: 274
- Other state: 45
- Northeast: 23
- Midwest: 0
- South: 0
- West: 22
64.3% of Elberta residents lived in the same house 1 years ago.
Out of people who lived in different houses, 49.0% lived in this county.
| Elberta: | 64.3% |
| State average: | 85.7% |
Education attainment for males 25 years and older:
- No schooling: 0
- Nursery to 4th grade: 0
- 5th and 6th grade: 0
- 7th and 8th grade: 0
- 9th grade: 0
- 10th grade: 0
- 11th grade: 0
- 12th grade, no diploma: 0
- High school graduate (or equivalency): 29
- Less than 1 year of college: 36
- Some college more than 1 year, no degree: 0
- Associate degree: 8
- Bachelor's degree: 0
- Master's degree: 0
- Professional school degree: 0
- Doctorate degree: 0

Education attainment for females 25 years and older:
- No schooling: 0
- Nursery to 4th grade: 0
- 5th and 6th grade: 0
- 7th and 8th grade: 0
- 9th grade: 0
- 10th grade: 0
- 11th grade: 0
- 12th grade, no diploma: 22
- High school graduate (or equivalency): 0
- Less than 1 year of college: 16
- Some college more than 1 year, no degree: 59
- Associate degree: 0
- Bachelor's degree: 0
- Master's degree: 0
- Professional school degree: 0
- Doctorate degree: 0


Housing units in structures:
- One, detached: 78
Housing units lacking complete kitchen facilities in 2022: 11.1%

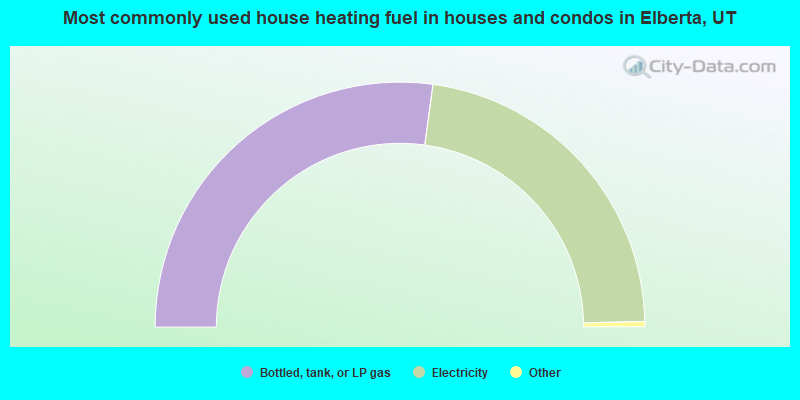
- 54.7%Bottled, tank, or LP gas
- 45.3%Electricity
Private vs. public school enrollment:
| Here: | 58.0% |
| Utah: | 7.2% |
| Here: | 0.0% |
| Utah: | 26.7% |


