Eldred, IL (Illinois) Houses and Residents
| Eldred: | $90,075 |
| Illinois: | $251,600 |
Mean price in 2022:
Detached houses: $82,639
Here: $82,639 State: $310,164 Mobile homes: $56,395
Here: $56,395 State: $78,855
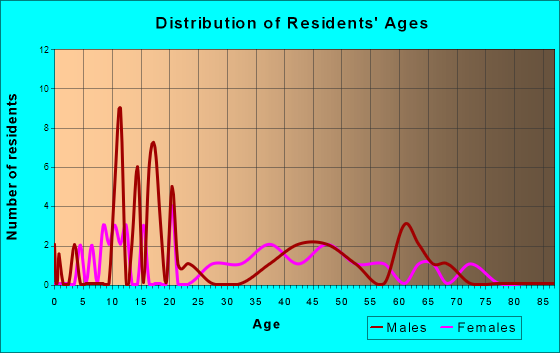
Total population: 196 (Urban population: 0, Rural population: 219 (all nonfarm))
Houses: 118 (93 occupied: 77 owner occupied, 17 renter occupied)
| % of renters here: | 18% |
| State: | 33% |
Housing density: 877 houses/condos per square mile
Median price asked for vacant for-sale houses and condos in 2022: $138,729.
Median gross rent in Eldred, IL in 2022: $-661,577,607
Housing units in Eldred with a mortgage: 29 (0 second mortgage, 0 home equity loan, 0 both second mortgage and home equity loan)
Houses without a mortgage: 0
Compare current foreclosures near Eldred, IL:
| Photo | Address | Area | Beds / Baths | Price | Details |
|---|---|---|---|---|---|

|
#1
N 5th St
Elsberry, MO 63343
|
840 sq. feet
|
1 baths 2 beds |
$48,500
|
show details |

|
#2
W Palm St
Roodhouse, IL 62082
|
- sq. feet
|
2 baths 4 beds |
$20,500
|
show details |

|
#3
Snedeker St
Jerseyville, IL 62052
|
- sq. feet
|
1 baths 2 beds |
$19,999
|
show details |

|
#4
N 2nd St
Elsberry, MO 63343
|
1,616 sq. feet
|
2 baths 6 beds |
show details | |

|
#5
David St
Elsberry, MO 63343
|
1,440 sq. feet
|
- baths 2 beds |
show details | |

|
#6
N 7th St
Elsberry, MO 63343
|
903 sq. feet
|
- baths 4 beds |
show details | |

|
#7
Mayes Ave
Elsberry, MO 63343
|
1,312 sq. feet
|
- baths 3 beds |
show details | |

|
#8
Highway B
Elsberry, MO 63343
|
- sq. feet
|
- baths - beds |
show details | |

|
#9
S 3rd St
Elsberry, MO 63343
|
- sq. feet
|
- baths - beds |
show details | |

|
#10
E Arch St
Jerseyville, IL 62052
|
- sq. feet
|
- baths - beds |
show details |
| Photo | Address | Area | Beds / Baths | Price | Details |
|---|---|---|---|---|---|

|
#11
Herron St
Hardin, IL 62047
|
- sq. feet
|
- baths - beds |
show details | |

|
#12
Short St
Jerseyville, IL 62052
|
- sq. feet
|
- baths - beds |
show details | |

|
#13
S Liberty St
Jerseyville, IL 62052
|
- sq. feet
|
- baths - beds |
show details | |

|
#14
2 Box 46
Hamburg, IL 62045
|
- sq. feet
|
- baths - beds |
show details | |

|
#15
N Liberty St Apt C1
Jerseyville, IL 62052
|
- sq. feet
|
- baths - beds |
show details | |

|
#16
Clay St
Jerseyville, IL 62052
|
- sq. feet
|
- baths - beds |
show details | |

|
#17
2 Box 2
Hamburg, IL 62045
|
- sq. feet
|
- baths - beds |
show details | |

|
#18
E Prairie St
Jerseyville, IL 62052
|
- sq. feet
|
- baths - beds |
show details | |

|
#19
S Liberty St
Jerseyville, IL 62052
|
- sq. feet
|
- baths - beds |
show details | |

|
#20
W Washington Ave
Roodhouse, IL 62082
|
- sq. feet
|
- baths - beds |
show details |
| Photo | Address | Area | Beds / Baths | Price | Details |
|---|---|---|---|---|---|

|
#21
N Jefferson St
Jerseyville, IL 62052
|
- sq. feet
|
- baths - beds |
show details | |

|
#22
S Main St
Carrollton, IL 62016
|
- sq. feet
|
- baths - beds |
show details | |

|
#23
W Spruce St
Jerseyville, IL 62052
|
- sq. feet
|
- baths - beds |
show details | |

|
#24
W Carpenter St
Jerseyville, IL 62052
|
- sq. feet
|
- baths - beds |
show details | |

|
#25
E Exchange St
Jerseyville, IL 62052
|
- sq. feet
|
- baths - beds |
show details | |

|
#26
Lovejoy St
Jerseyville, IL 62052
|
- sq. feet
|
- baths - beds |
show details | |

|
#27
W Spruce St
Jerseyville, IL 62052
|
- sq. feet
|
- baths - beds |
show details | |

|
#28
Roberts St
Jerseyville, IL 62052
|
- sq. feet
|
- baths - beds |
show details | |

|
#29
Dillman St
White Hall, IL 62092
|
- sq. feet
|
- baths - beds |
show details | |

|
#30
N Hancock St
White Hall, IL 62092
|
- sq. feet
|
- baths - beds |
show details |
| Photo | Address | Area | Beds / Baths | Price | Details |
|---|---|---|---|---|---|

|
#31
N Public Rd
Fieldon, IL 62031
|
- sq. feet
|
- baths - beds |
show details | |

|
#32
S Prairie St
Jerseyville, IL 62052
|
- sq. feet
|
- baths - beds |
show details | |

|
Check over 1 million property listings on Foreclosure.com!
|
browse all offers | |||


Median year apartment built: 1993
Household type by relationship:
Households: 165- Male householders: 42 (33 living alone), Female householders: 49 (17 living alone)
42 spouses (42 opposite-sex spouses), 0 unmarried partners, (0 opposite-sex unmarried partners), 24 children (24 natural, 0 adopted, 0 stepchildren), 1 grandchildren, 0 brothers or sisters, 3 parents, 0 foster children, 0 other relatives, 0 non-relatives
Size of family households: 35 2-persons, 1 3-persons, 4 4-persons.
Size of nonfamily households: 54 1-person, 1 2-persons.
8 married couples with children.
0 single-parent households (0 men, 0 women).
97.5% of residents of Eldred speak English at home.
2.5% of residents speak other Indo-European language at home (75% speak English very well, 25% speak English well).
Foreign born population: 4 (2.4%)
(100.0% of them are naturalized citizens)
| Here: | 5.3 |
| State: | 6.4 |
| Here: | 3.0 |
| State: | 4.1 |

- Bedrooms in owner-occupied houses and condos in Eldred, Illinois
- 0no bedroom
- 121 bedroom
- 442 bedrooms
- 163 bedrooms
- 54 bedrooms
- 05+ bedrooms

- Bedrooms in renter-occupied apartments in Eldred, Illinois
- 0no bedroom
- 111 bedroom
- 02 bedrooms
- 63 bedrooms
- 04 bedrooms
- 05+ bedrooms

- Cars and other vehicles available in Eldred in owner-occupied houses/condos
- 2no vehicle
- 301 vehicle
- 222 vehicles
- 203 vehicles
- 24 vehicles
- 15+ vehicles

- Cars and other vehicles available in Eldred in renter-occupied apartments
- 10no vehicle
- 61 vehicle
- 12 vehicles
- 03 vehicles
- 04 vehicles
- 05+ vehicles

- Rooms in owner-occupied houses in Eldred, Illinois
- 01 room
- 22 rooms
- 53 rooms
- 14 rooms
- 375 rooms
- 156 rooms
- 157 rooms
- 08 rooms
- 29+ rooms

- Rooms in renter-occupied apartments in Eldred, Illinois
- 01 room
- 52 rooms
- 63 rooms
- 04 rooms
- 05 rooms
- 66 rooms
- 07 rooms
- 08 rooms
- 09+ rooms


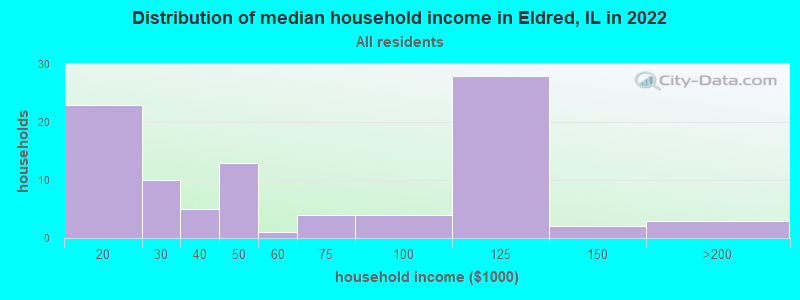
Eldred, IL household income distribution

- 23$10,000 to $19,999
- 10$20,000 to $29,999
- 5$30,000 to $39,999
- 13$40,000 to $49,999
- 1$50,000 to $59,999
- 4$60,000 to $74,999
- 4$75,000 to $99,999
- 28$100,000 to $124,999
- 2$125,000 to $149,999
- 3$150,000 to $199,999
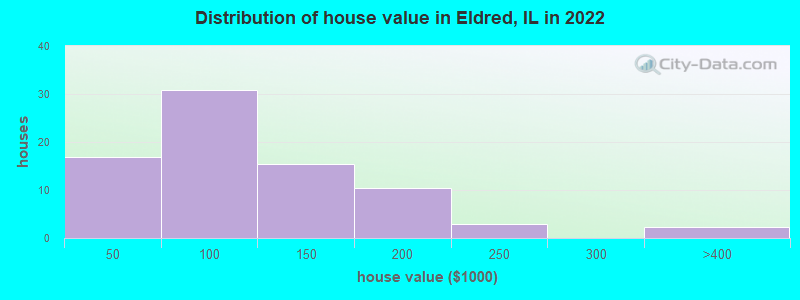
Home value of owner - occupied houses in 2022 in Eldred, IL
-
- 2Less than $10,000
- 5$10,000 to $14,999
- 6$15,000 to $19,999
- 2$20,000 to $24,999
- 2$50,000 to $59,999
- 9$60,000 to $69,999
- 2$70,000 to $79,999
- 16$80,000 to $89,999
- 15$100,000 to $124,999
- 10$150,000 to $174,999
- 2$200,000 to $249,999
- 2$300,000 to $399,999
Rent paid by renters in 2022 in Eldred, IL
-
- 5$200 to $249
- 1$350 to $399
- 5$750 to $799
- 6No cash rent


Percentage of workers working in this county: 30.9%
Number of people working at home: 2 (2.1% of all workers)
Travel time to work (commute)
- Less than 5 minutes: 3
- 5 to 9 minutes: 5
- 10 to 14 minutes: 1
- 15 to 19 minutes: 4
- 20 to 24 minutes: 1
- 25 to 29 minutes: 1
- 30 to 34 minutes: 0
- 35 to 39 minutes: 0
- 40 to 44 minutes: 8
- 45 to 59 minutes: 12
- 60 to 89 minutes: 43
- 90 or more minutes: 0
Means of transportation to work:
- Drove a car alone: 86 (81.1%)
- Carpooled: 13 (12.3%)
- Bicycle: 2 (1.9%)
- Walked: 5 (4.7%)


- Year of entry for the foreign-born population in Eldred, Illinois
- 02010 or later
- 12000 to 2009
- 31990 to 1999
- 01980 to 1989
- 01970 to 1979
- 0Before 1970

First ancestries reported:
- German: 47 (47.1%)
- Irish: 11 (11.0%)
- American: 10 (10.0%)
- Polish: 7 (7.0%)
- Welsh: 7 (7.0%)
- English: 5 (5.0%)
- Greek: 3 (3.0%)
- Portuguese: 2 (2.0%)
Most common places of birth for foreign-born residents (%):
| Eldred: | 50.0% (2) |
| Illinois: | 6.9% (124,474) |
Place of birth for U.S.-born residents:
- This state: 137
- Other state: 23
- Northeast: 1
- Midwest: 11
- South: 0
- West: 12
95.1% of Eldred residents lived in the same house 1 years ago.
Out of people who lived in different houses, 0.0% lived in this county.
Out of people who lived in different counties, 100.0% lived in Illinois.
| Eldred: | 95.1% |
| State average: | 88.3% |
Education attainment for males 25 years and older:
- No schooling: 0
- Nursery to 4th grade: 0
- 5th and 6th grade: 0
- 7th and 8th grade: 4
- 9th grade: 1
- 10th grade: 0
- 11th grade: 0
- 12th grade, no diploma: 0
- High school graduate (or equivalency): 61
- Less than 1 year of college: 0
- Some college more than 1 year, no degree: 17
- Associate degree: 1
- Bachelor's degree: 4
- Master's degree: 0
- Professional school degree: 0
- Doctorate degree: 0

Education attainment for females 25 years and older:
- No schooling: 0
- Nursery to 4th grade: 0
- 5th and 6th grade: 0
- 7th and 8th grade: 0
- 9th grade: 5
- 10th grade: 0
- 11th grade: 1
- 12th grade, no diploma: 1
- High school graduate (or equivalency): 36
- Less than 1 year of college: 0
- Some college more than 1 year, no degree: 6
- Associate degree: 2
- Bachelor's degree: 5
- Master's degree: 0
- Professional school degree: 0
- Doctorate degree: 0


Housing units in structures:
- One, detached: 99
- Two: 11
- Mobile homes: 8
Housing units lacking complete kitchen facilities in 2022: 17.8%
House/condo owner moved in on average 14 years ago
Renter moved in on average 16 years ago

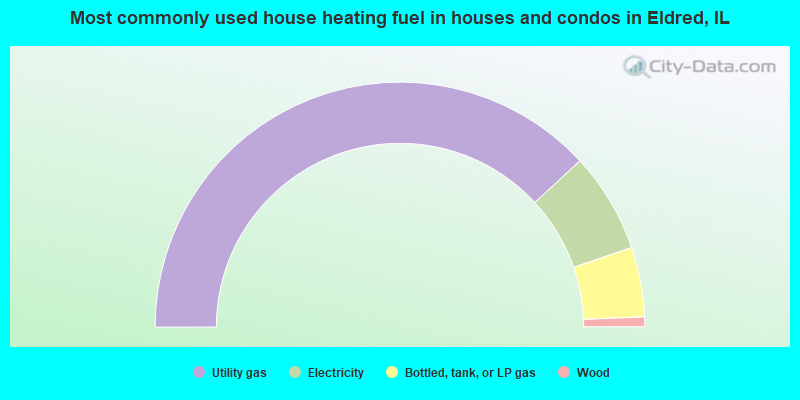
- 76.3%Utility gas
- 13.2%Electricity
- 9.2%Bottled, tank, or LP gas
- 1.3%Wood
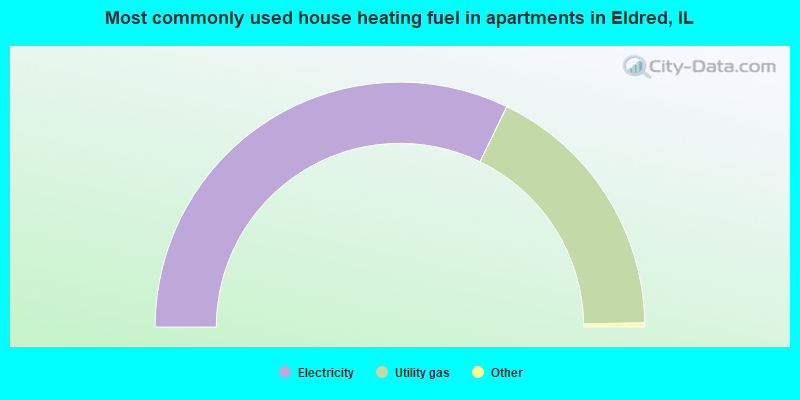
- 64.7%Electricity
- 35.3%Utility gas
Private vs. public school enrollment:
| Here: | 0.0% |
| Illinois: | 13.3% |
| Here: | 0.0% |
| Illinois: | 9.9% |
| Here: | 0.0% |
| Illinois: | 27.4% |


