Eldred, PA (Pennsylvania) Houses and Residents
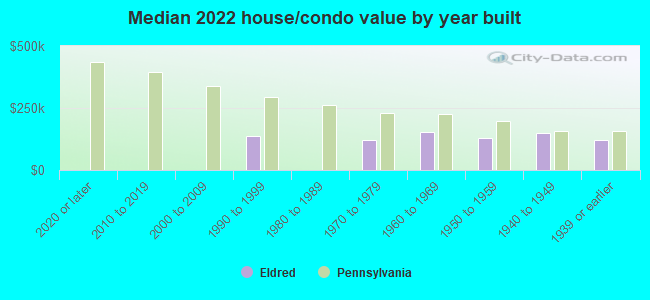
| Eldred: | $128,177 |
| Pennsylvania: | $245,500 |
Mean price in 2022:
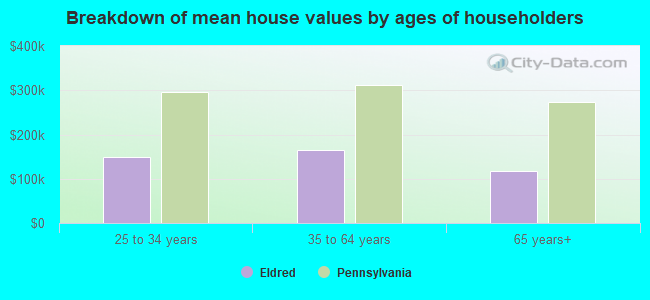
Detached houses: $148,695
Here: $148,695 State: $317,202 Mobile homes: $56,980
Here: $56,980 State: $92,414
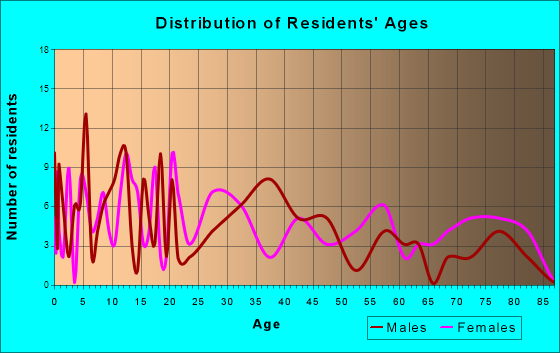
Total population: 813 (Urban population: 0, Rural population: 820 (all nonfarm))
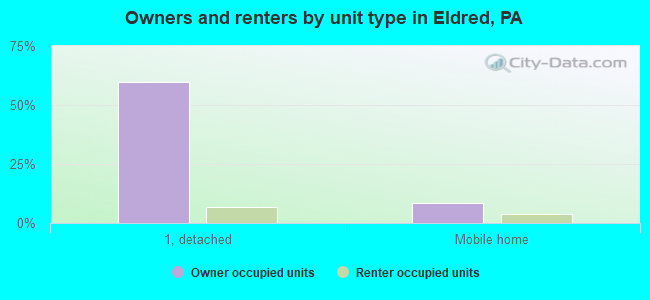
Houses: 311 (229 occupied: 157 owner occupied, 73 renter occupied)
| % of renters here: | 32% |
| State: | 31% |
Housing density: 355 houses/condos per square mile
Median price asked for vacant for-sale houses and condos in 2022 in this county: $109,723.
Median contract rent in 2022: $390 (lower quartile is $312, upper quartile is $508)
Median rent asked for vacant for-rent units in 2022: $425
Median gross rent in Eldred, PA in 2022: $399
Housing units in Eldred with a mortgage: 65 (14 second mortgage, 0 home equity loan, 4 both second mortgage and home equity loan)
Houses without a mortgage: 0
Median household income for houses/condos with a mortgage: $75,234
Median household income for apartments without a mortgage: $39,665
Median monthly housing costs: $515
Compare current foreclosures near Eldred, PA:
| Photo | Address | Area | Beds / Baths | Price | Details |
|---|---|---|---|---|---|

|
#1
Mccrea Brk
Eldred, PA 16731
|
- sq. feet
|
- baths - beds |
show details | |

|
#2
N Nookside Ln
Bradford, PA 16701
|
2,029 sq. feet
|
2 baths 4 beds |
show details | |

|
#3
Jackson Ave
Bradford, PA 16701
|
1,754 sq. feet
|
2 baths 4 beds |
show details | |

|
#4
W Henley St
Olean, NY 14760
|
1,916 sq. feet
|
1 baths 5 beds |
show details | |

|
#5
W Branch Rd
Allegany, NY 14706
|
1,400 sq. feet
|
1 baths 3 beds |
show details | |

|
#6
Hamilton Ave
Olean, NY 14760
|
1,128 sq. feet
|
1 baths 2 beds |
show details | |

|
#7
N 4th St
Olean, NY 14760
|
2,016 sq. feet
|
1 baths 3 beds |
show details | |

|
#8
Genesee St
Olean, NY 14760
|
1,429 sq. feet
|
1 baths 4 beds |
show details | |

|
#9
Genesee St
Olean, NY 14760
|
1,539 sq. feet
|
2 baths 3 beds |
show details | |

|
#10
N 8th St
Olean, NY 14760
|
1,116 sq. feet
|
1 baths 2 beds |
show details |
| Photo | Address | Area | Beds / Baths | Price | Details |
|---|---|---|---|---|---|

|
#11
Woodview Ct
Olean, NY 14760
|
2,520 sq. feet
|
2 baths 3 beds |
show details | |

|
#12
N 11th St
Olean, NY 14760
|
1,600 sq. feet
|
1 baths 3 beds |
show details | |

|
#13
N 8th St
Olean, NY 14760
|
891 sq. feet
|
1 baths 3 beds |
show details | |

|
#14
N 18th St
Olean, NY 14760
|
576 sq. feet
|
1 baths 1 beds |
show details | |

|
#15
N 13th St
Olean, NY 14760
|
1,392 sq. feet
|
1 baths 2 beds |
show details | |

|
#16
Irving St
Olean, NY 14760
|
1,255 sq. feet
|
1 baths 2 beds |
show details | |

|
#17
N 4th St
Olean, NY 14760
|
1,345 sq. feet
|
1 baths 3 beds |
show details | |

|
#18
Gleason Hollow Rd
Portville, NY 14770
|
576 sq. feet
|
1 baths 1 beds |
show details | |

|
#19
N 6th St
Olean, NY 14760
|
1,794 sq. feet
|
2 baths 3 beds |
show details | |

|
#20
N 11th St
Olean, NY 14760
|
1,418 sq. feet
|
1 baths 3 beds |
show details |
| Photo | Address | Area | Beds / Baths | Price | Details |
|---|---|---|---|---|---|

|
#21
E Highland Ave
Olean, NY 14760
|
880 sq. feet
|
1 baths 3 beds |
show details | |

|
#22
E Highland Ave
Olean, NY 14760
|
866 sq. feet
|
1 baths 2 beds |
show details | |

|
#23
Delaware Ave
Olean, NY 14760
|
616 sq. feet
|
2 baths 3 beds |
show details | |

|
#24
Washington St
Olean, NY 14760
|
3,124 sq. feet
|
2 baths 4 beds |
show details | |

|
#25
S 11th St
Olean, NY 14760
|
1,512 sq. feet
|
1 baths 4 beds |
show details | |

|
#26
Hamilton Ave
Olean, NY 14760
|
1,468 sq. feet
|
1 baths 3 beds |
show details | |

|
#27
E Water St
Olean, NY 14760
|
1,152 sq. feet
|
1 baths 3 beds |
show details | |

|
#28
Spruce St
Olean, NY 14760
|
1,769 sq. feet
|
2 baths 4 beds |
show details | |

|
#29
Union Valley Rd
Olean, NY 14760
|
864 sq. feet
|
1 baths 2 beds |
show details | |

|
#30
Congress Rd
Hinsdale, NY 14743
|
960 sq. feet
|
1 baths 2 beds |
show details |
| Photo | Address | Area | Beds / Baths | Price | Details |
|---|---|---|---|---|---|

|
#31
Parkside Dr
Limestone, NY 14753
|
1,188 sq. feet
|
2 baths 3 beds |
show details | |

|
#32
N Main St
Limestone, NY 14753
|
1,224 sq. feet
|
1 baths 2 beds |
show details | |

|
#33
Sherlock Hollow Rd
Hinsdale, NY 14743
|
1,054 sq. feet
|
1 baths 2 beds |
show details | |

|
#34
Nys Route 16
Hinsdale, NY 14743
|
1,996 sq. feet
|
1 baths 3 beds |
show details | |

|
#35
Olive St
Bolivar, NY 14715
|
1,176 sq. feet
|
1 baths 4 beds |
show details | |

|
#36
Route 16 # 16
Hinsdale, NY 14743
|
1,516 sq. feet
|
1 baths 3 beds |
show details | |

|
#37
Paton Dr
Limestone, NY 14753
|
1,524 sq. feet
|
1 baths 3 beds |
show details | |

|
#38
Parkside Dr
Limestone, NY 14753
|
976 sq. feet
|
1 baths 2 beds |
show details | |

|
#39
Church St
Limestone, NY 14753
|
1,152 sq. feet
|
1 baths 2 beds |
show details | |

|
#40
Loney Hollow Rd
Limestone, NY 14753
|
1,456 sq. feet
|
2 baths 3 beds |
show details |
| Photo | Address | Area | Beds / Baths | Price | Details |
|---|---|---|---|---|---|

|
#41
Irving St
Olean, NY 14760
|
1,460 sq. feet
|
1 baths 3 beds |
show details | |

|
#42
Buffalo Rd
Allegany, NY 14706
|
1,869 sq. feet
|
2 baths 3 beds |
show details | |

|
#43
Back Hinsdale Rd
Olean, NY 14760
|
1,300 sq. feet
|
2 baths 2 beds |
show details | |

|
#44
Linwood Dr
Cuba, NY 14727
|
2,052 sq. feet
|
2 baths 3 beds |
show details | |

|
#45
N 2nd St
Allegany, NY 14706
|
1,640 sq. feet
|
1 baths 3 beds |
show details | |

|
#46
N 1st St
Allegany, NY 14706
|
1,856 sq. feet
|
1 baths 3 beds |
show details | |

|
#47
Route 16 N
Olean, NY 14760
|
1,176 sq. feet
|
1 baths 3 beds |
show details | |

|
#48
Hayes Rd
Olean, NY 14760
|
1,188 sq. feet
|
1 baths 2 beds |
show details | |

|
#49
E Connell St
Olean, NY 14760
|
1,274 sq. feet
|
1 baths 4 beds |
show details | |

|
Check over 1 million property listings on Foreclosure.com!
|
browse all offers | |||

Latest news about housing in Eldred, PA collected exclusively by city-data.com from local newspapers, TV, and radio stations

 | Moving from Dallas, TX to NEPA (72 replies) |
| Towamensing Trails "20" Burglaries this Saturday! (30 replies) |
| Your Holiday Spirit~ What Christmas is to You! (71 replies) |
| Gone But "Not Forgotten" ~ What do you miss in NEPA? (39 replies) |
| Stroudsburg Photo Tour (First and Last Attempt) (41 replies) |
| IS Palmerton Leigh Valley or Southern Poconos? (14 replies) |
Median year apartment built: 1977
Household type by relationship:
Households: 413- Male householders: 75 (34 living alone), Female householders: 150 (93 living alone)
70 spouses (70 opposite-sex spouses), 6 unmarried partners, (6 opposite-sex unmarried partners), 78 children (55 natural, 22 adopted, 0 stepchildren), 16 grandchildren, 0 brothers or sisters, 3 parents, 0 foster children, 5 other relatives, 2 non-relatives
Size of family households: 51 2-persons, 21 3-persons, 8 4-persons, 1 5-persons, 8 7-or-more-persons.
Size of nonfamily households: 133 1-person, 8 2-persons.
33 married couples with children.
9 single-parent households (3 men, 6 women).
99.0% of residents of Eldred speak English at home.
0.5% of residents speak Spanish at home (100% speak English very well).
0.8% of residents speak other Indo-European language at home (100% speak English very well).
Foreign born population: 7 (1.7%)
(100.0% of them are naturalized citizens)
| Here: | 7.0 |
| State: | 6.8 |
| Here: | 3.3 |
| State: | 4.3 |
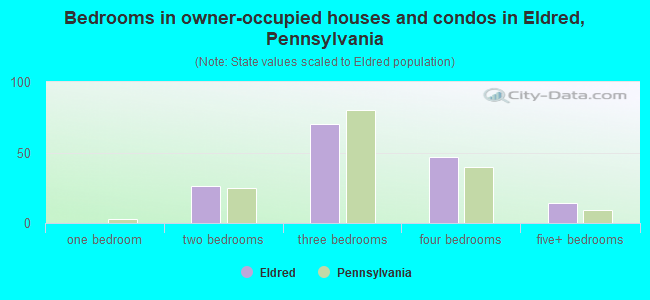
- Bedrooms in owner-occupied houses and condos in Eldred, Pennsylvania
- 0no bedroom
- 01 bedroom
- 272 bedrooms
- 703 bedrooms
- 474 bedrooms
- 145+ bedrooms
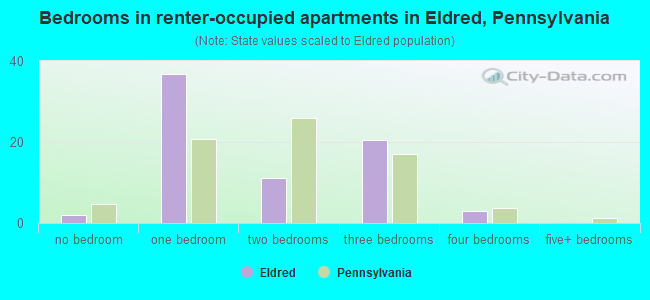
- Bedrooms in renter-occupied apartments in Eldred, Pennsylvania
- 2no bedroom
- 371 bedroom
- 112 bedrooms
- 203 bedrooms
- 34 bedrooms
- 05+ bedrooms
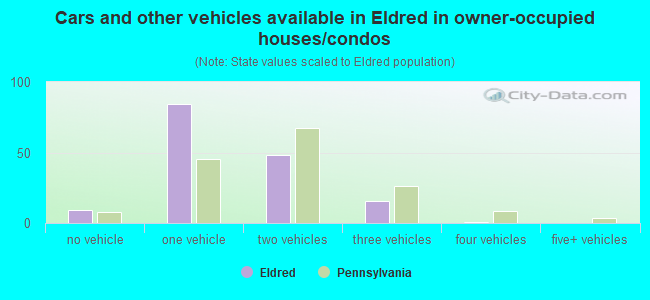
- Cars and other vehicles available in Eldred in owner-occupied houses/condos
- 9no vehicle
- 851 vehicle
- 482 vehicles
- 153 vehicles
- 14 vehicles
- 05+ vehicles
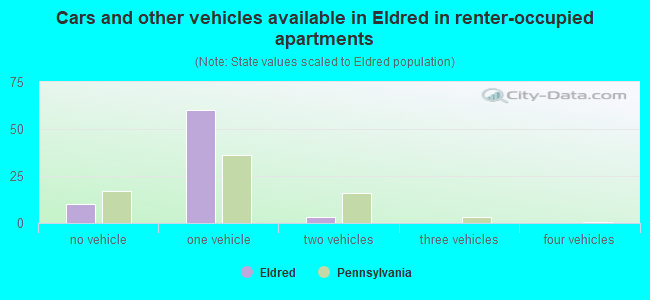
- Cars and other vehicles available in Eldred in renter-occupied apartments
- 10no vehicle
- 601 vehicle
- 32 vehicles
- 03 vehicles
- 04 vehicles
- 05+ vehicles
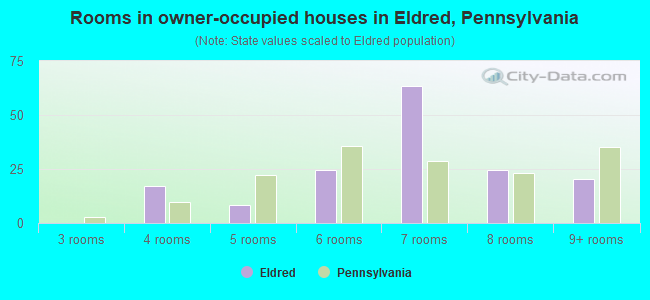
- Rooms in owner-occupied houses in Eldred, Pennsylvania
- 01 room
- 02 rooms
- 03 rooms
- 174 rooms
- 85 rooms
- 246 rooms
- 637 rooms
- 248 rooms
- 209+ rooms
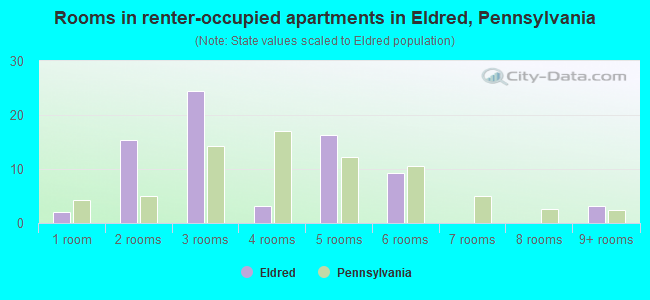
- Rooms in renter-occupied apartments in Eldred, Pennsylvania
- 21 room
- 152 rooms
- 243 rooms
- 34 rooms
- 165 rooms
- 96 rooms
- 07 rooms
- 08 rooms
- 39+ rooms
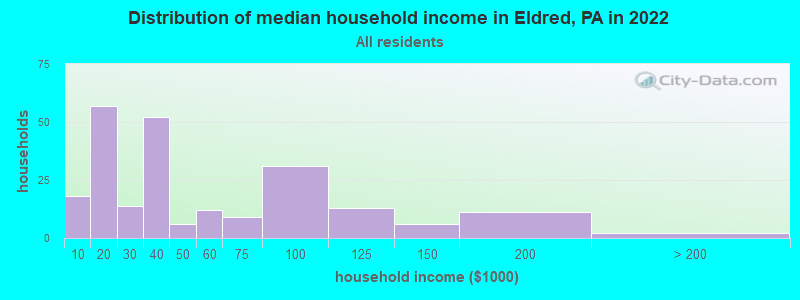
Eldred, PA household income distribution

- 18Less than $10,000
- 57$10,000 to $19,999
- 14$20,000 to $29,999
- 52$30,000 to $39,999
- 6$40,000 to $49,999
- 12$50,000 to $59,999
- 9$60,000 to $74,999
- 31$75,000 to $99,999
- 13$100,000 to $124,999
- 6$125,000 to $149,999
- 11$150,000 to $199,999
- 2$200,000 or more
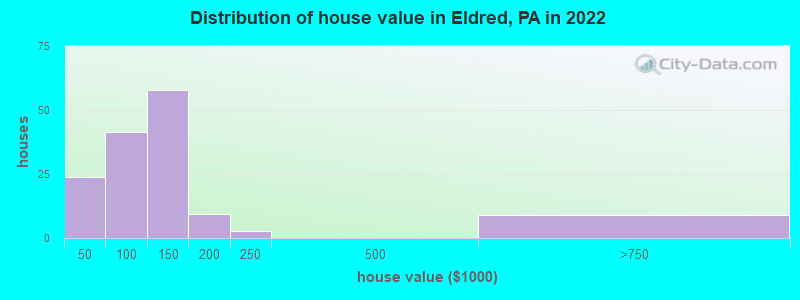
Home value of owner - occupied houses in 2022 in Eldred, PA
-
- 2Less than $10,000
- 9$10,000 to $14,999
- 2$20,000 to $24,999
- 9$40,000 to $49,999
- 3$60,000 to $69,999
- 9$70,000 to $79,999
- 2$80,000 to $89,999
- 15$90,000 to $99,999
- 18$100,000 to $124,999
- 39$125,000 to $149,999
- 3$150,000 to $174,999
- 6$175,000 to $199,999
- 2$200,000 to $249,999
- 8$500,000 to $749,999
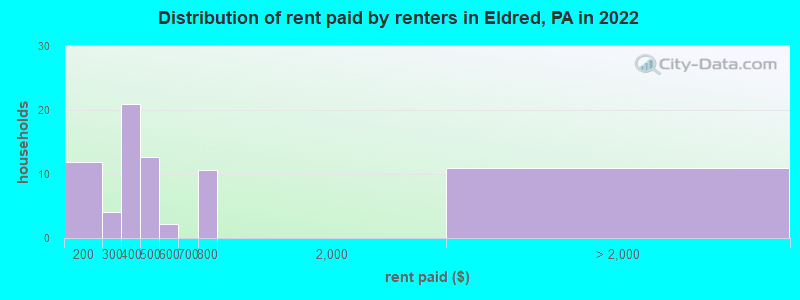
Rent paid by renters in 2022 in Eldred, PA
-
- 2$100 to $149
- 9$150 to $199
- 4$200 to $249
- 6$300 to $349
- 14$350 to $399
- 8$400 to $449
- 4$450 to $499
- 2$550 to $599
- 10$700 to $749
- 10No cash rent
Percentage of workers working in this county: 67.3%
Number of people working at home: 0 (0.0% of all workers)
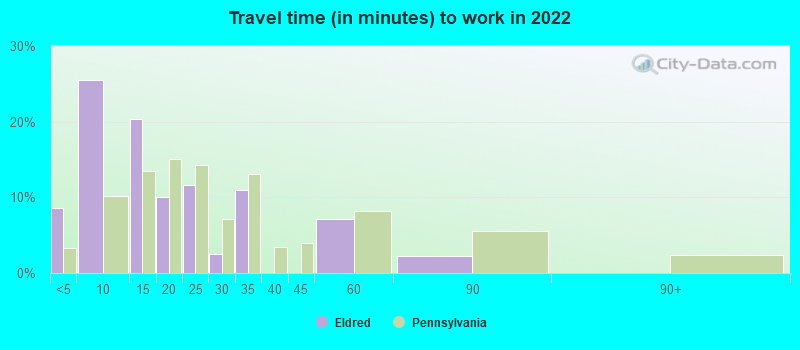
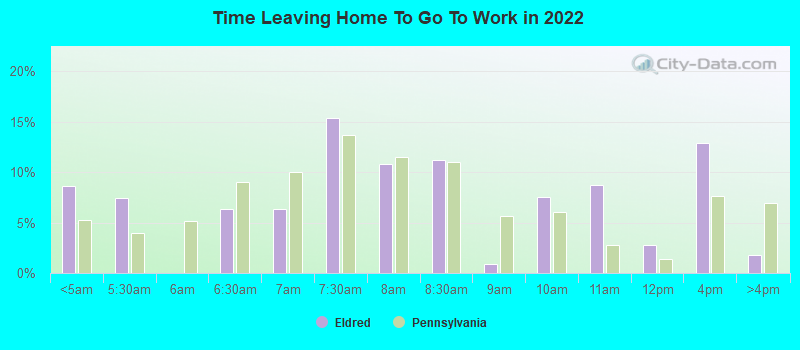
Travel time to work (commute)
- Less than 5 minutes: 3
- 5 to 9 minutes: 5
- 10 to 14 minutes: 12
- 15 to 19 minutes: 8
- 20 to 24 minutes: 19
- 25 to 29 minutes: 7
- 30 to 34 minutes: 20
- 35 to 39 minutes: 3
- 40 to 44 minutes: 7
- 45 to 59 minutes: 14
- 60 to 89 minutes: 0
- 90 or more minutes: 0
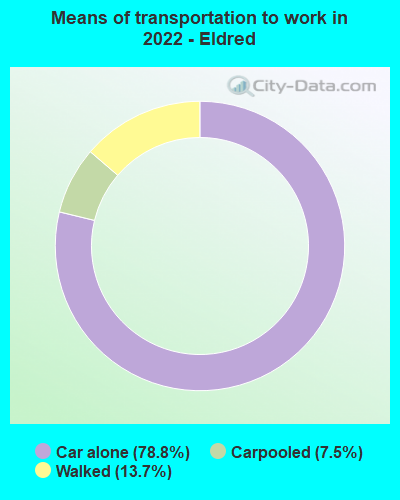
Means of transportation to work:
- Drove a car alone: 220 (73.6%)
- Carpooled: 20 (6.7%)
- Walked: 36 (12.0%)
- Unemployment by race in 2022
- Unemployment rate for White non-Hispanic residents
- 16.9%Males
- 4.5%Females
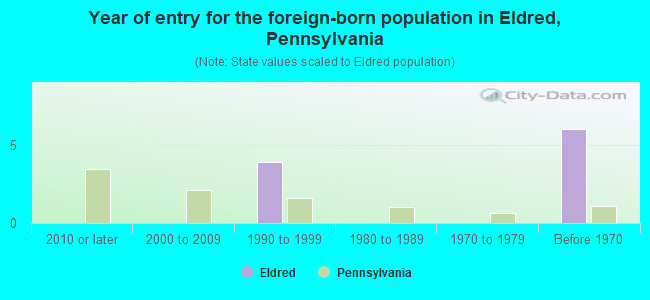
- Year of entry for the foreign-born population in Eldred, Pennsylvania
- 02010 or later
- 02000 to 2009
- 41990 to 1999
- 01980 to 1989
- 01970 to 1979
- 6Before 1970
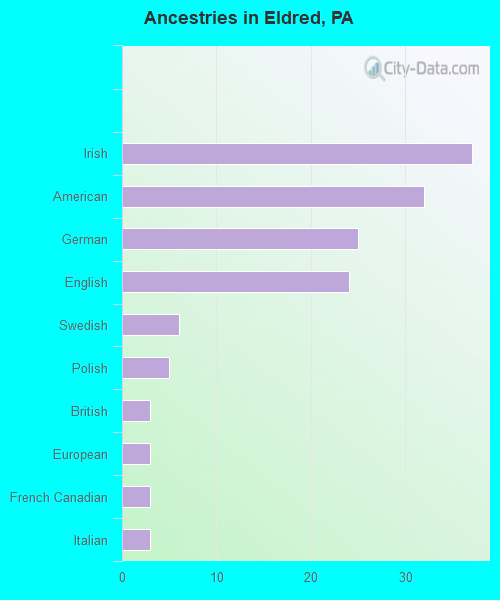
First ancestries reported:
- Irish: 37 (23.6%)
- American: 32 (20.4%)
- German: 25 (16.0%)
- English: 24 (15.3%)
- Swedish: 6 (3.8%)
- Polish: 5 (3.2%)
- British: 3 (1.9%)
- European: 3 (1.9%)
- French Canadian: 3 (1.9%)
- Italian: 3 (1.9%)
Most common places of birth for foreign-born residents (%):
| Eldred: | 57.1% (4) |
| Pennsylvania: | 7.2% (67,704) |
| Eldred: | 42.9% (3) |
| Pennsylvania: | 1.8% (17,032) |
Place of birth for U.S.-born residents:
- This state: 209
- Other state: 193
- Northeast: 182
- Midwest: 0
- South: 10
- West: 0
91.3% of Eldred residents lived in the same house 1 years ago.
Out of people who lived in different houses, 30.8% lived in this county.
Out of people who lived in different counties, 50.0% lived in Pennsylvania.
| Eldred: | 91.3% |
| State average: | 89.3% |
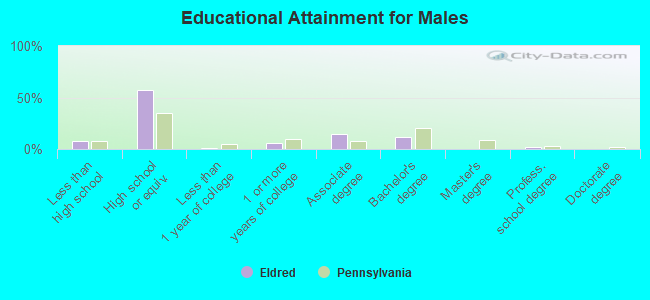
Education attainment for males 25 years and older:
- No schooling: 5
- Nursery to 4th grade: 0
- 5th and 6th grade: 0
- 7th and 8th grade: 0
- 9th grade: 0
- 10th grade: 5
- 11th grade: 0
- 12th grade, no diploma: 0
- High school graduate (or equivalency): 74
- Less than 1 year of college: 1
- Some college more than 1 year, no degree: 8
- Associate degree: 19
- Bachelor's degree: 15
- Master's degree: 0
- Professional school degree: 2
- Doctorate degree: 0
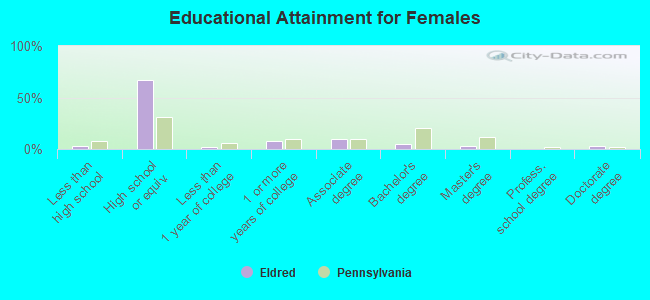
Education attainment for females 25 years and older:
- No schooling: 3
- Nursery to 4th grade: 0
- 5th and 6th grade: 0
- 7th and 8th grade: 0
- 9th grade: 0
- 10th grade: 0
- 11th grade: 2
- 12th grade, no diploma: 0
- High school graduate (or equivalency): 125
- Less than 1 year of college: 3
- Some college more than 1 year, no degree: 15
- Associate degree: 18
- Bachelor's degree: 9
- Master's degree: 6
- Professional school degree: 0
- Doctorate degree: 6
Housing units in structures:
- One, detached: 215
- Two: 15
- 3 or 4: 23
- 20 to 49: 29
- Mobile homes: 28
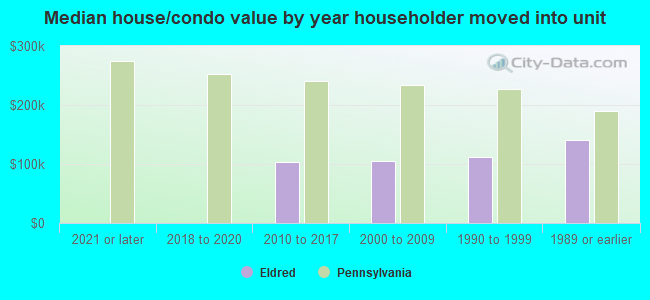
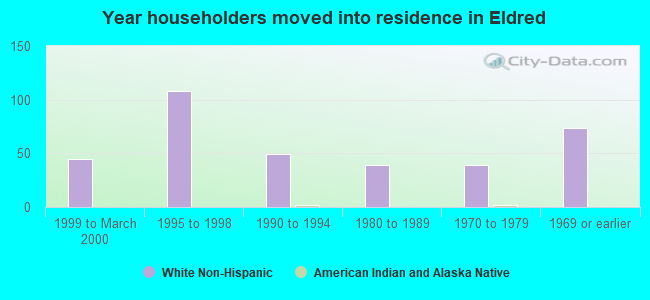
House/condo owner moved in on average 23 years ago
Renter moved in on average 11 years ago
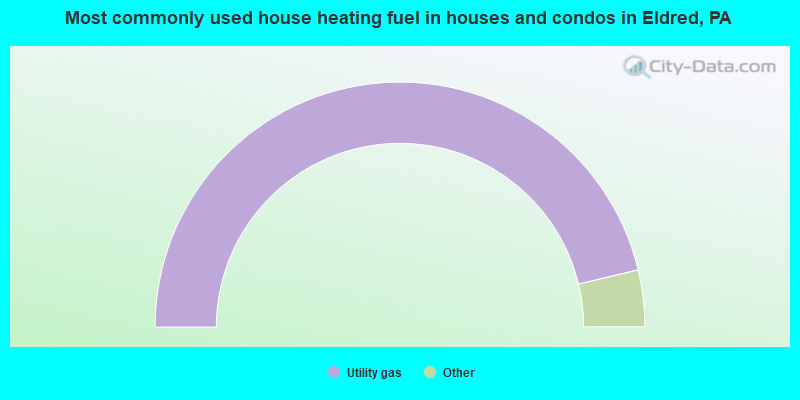
- 92.9%Utility gas
- 2.6%Coal or coke
- 2.6%Wood
- 1.9%Bottled, tank, or LP gas
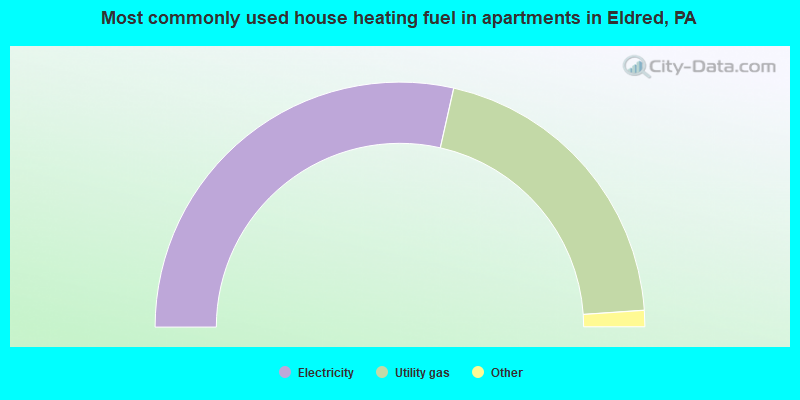
- 58.3%Electricity
- 41.7%Utility gas
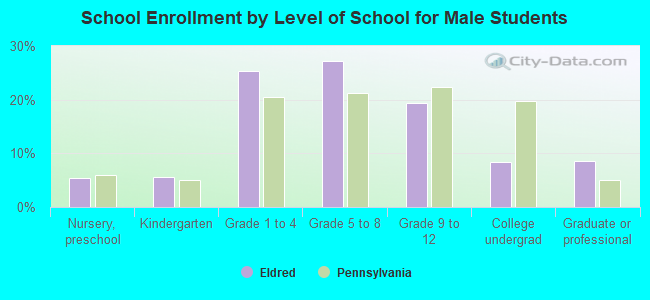
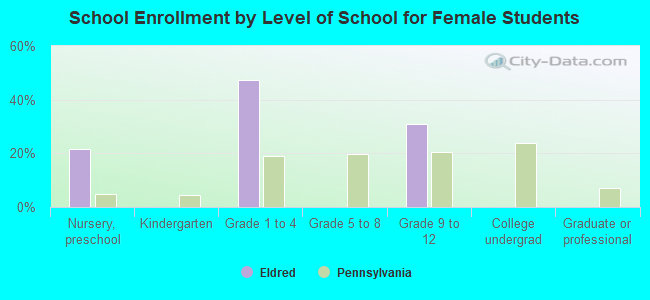
Private vs. public school enrollment:
| Here: | 8.3% |
| Pennsylvania: | 15.7% |
| Here: | 0.0% |
| Pennsylvania: | 13.4% |
| Here: | 100.0% |
| Pennsylvania: | 39.8% |