Eldridge, CA (California) Houses and Residents
| Eldridge: | $917,887 |
| California: | $715,900 |
Mean price in 2022:
Detached houses: $1,470,086
Here: $1,470,086 State: $988,808
Total population: 1,233 (All urban)
Houses: 336 (325 occupied: 230 owner occupied, 98 renter occupied)
| % of renters here: | 30% |
| State: | 44% |
Housing density: 526 houses/condos per square mile
Median price asked for vacant for-sale houses and condos in 2022 in this county: $439,673.
Median contract rent in 2022: $1,784 (lower quartile is $1,234, upper quartile is over $2,000)
Median gross rent in Eldridge, CA in 2022: $1,955
Housing units in Eldridge with a mortgage: 170 (47 second mortgage, 0 home equity loan, 49 both second mortgage and home equity loan)
Houses without a mortgage: 0
Median household income for houses/condos with a mortgage: $166,088
Median monthly housing costs: $2,110
Compare current foreclosures near Eldridge, CA:
| Photo | Address | Area | Beds / Baths | Price | Details |
|---|---|---|---|---|---|

|
#1
Petaluma Blvd S Apt 28
Petaluma, CA 94952
|
565 sq. feet
|
1 baths 1 beds |
$359,900
|
show details |

|
#2
Mcconnell Ave
Santa Rosa, CA 95404
|
1,216 sq. feet
|
2 baths 4 beds |
show details | |

|
#3
Corby Ave
Santa Rosa, CA 95407
|
836 sq. feet
|
1 baths 2 beds |
show details | |

|
#4
Jewett Rd
Petaluma, CA 94952
|
1,600 sq. feet
|
2 baths 4 beds |
show details | |

|
#5
Terrace Dr
Napa, CA 94559
|
2,140 sq. feet
|
2 baths 4 beds |
show details | |

|
#6
Carson St
Santa Rosa, CA 95403
|
1,408 sq. feet
|
2 baths 3 beds |
show details | |

|
#7
Ridgway Ave
Santa Rosa, CA 95401
|
1,603 sq. feet
|
2 baths 3 beds |
show details | |

|
#8
Meadowbrook Ct
Cotati, CA 94931
|
1,733 sq. feet
|
2 baths 2 beds |
show details | |

|
#9
Berry Ln
Napa, CA 94558
|
840 sq. feet
|
1 baths 3 beds |
show details | |

|
#10
Foothill Blvd
Calistoga, CA 94515
|
3,158 sq. feet
|
3 baths 4 beds |
show details |
| Photo | Address | Area | Beds / Baths | Price | Details |
|---|---|---|---|---|---|

|
#11
Alton Ln
Santa Rosa, CA 95403
|
1,422 sq. feet
|
2 baths 3 beds |
show details | |

|
#12
Harvest Ln
Santa Rosa, CA 95401
|
1,062 sq. feet
|
2 baths 2 beds |
show details | |

|
#13
Highway 12
Sonoma, CA 95476
|
1,170 sq. feet
|
2 baths 3 beds |
show details | |

|
#14
Montecito Ave
Santa Rosa, CA 95404
|
1,537 sq. feet
|
2 baths 2 beds |
show details | |

|
#15
Amanda Ct
Napa, CA 94559
|
1,823 sq. feet
|
3 baths 4 beds |
show details | |

|
#16
Melvin Ave
Sonoma, CA 95476
|
1,417 sq. feet
|
2 baths 3 beds |
show details | |

|
#17
Enterprise Rd
Glen Ellen, CA 95442
|
1,220 sq. feet
|
3 baths 3 beds |
show details | |

|
#18
Donahue Ave
Santa Rosa, CA 95401
|
1,587 sq. feet
|
3 baths 3 beds |
show details | |

|
#19
Golden Gate Ave
Santa Rosa, CA 95407
|
500 sq. feet
|
1 baths 2 beds |
show details | |

|
#20
Racquet Club Cir
Rohnert Park, CA 94928
|
1,162 sq. feet
|
2 baths 2 beds |
show details |
| Photo | Address | Area | Beds / Baths | Price | Details |
|---|---|---|---|---|---|

|
#21
Gate Way
Santa Rosa, CA 95401
|
1,218 sq. feet
|
2 baths 3 beds |
show details | |

|
#22
Glen Eagle Dr
Petaluma, CA 94952
|
6,762 sq. feet
|
3 baths 3 beds |
show details | |

|
#23
Malibu Cir
Santa Rosa, CA 95401
|
1,300 sq. feet
|
3 baths 3 beds |
show details | |

|
#24
Cypress Ave
Cotati, CA 94931
|
2,110 sq. feet
|
3 baths 3 beds |
show details | |

|
#25
Match Point Ave
Santa Rosa, CA 95407
|
2,942 sq. feet
|
3 baths 3 beds |
show details | |

|
#26
Bradford Ct
Santa Rosa, CA 95405
|
2,021 sq. feet
|
2 baths 3 beds |
show details | |

|
#27
S Wright Rd
Santa Rosa, CA 95407
|
1,274 sq. feet
|
1 baths 3 beds |
show details | |

|
#28
Shade Tree Ln
Santa Rosa, CA 95405
|
1,681 sq. feet
|
2 baths 2 beds |
show details | |

|
#29
Lavender Ter
Petaluma, CA 94952
|
2,618 sq. feet
|
3 baths 5 beds |
show details | |

|
#30
Antelope Ln
Santa Rosa, CA 95407
|
1,700 sq. feet
|
3 baths 4 beds |
show details |
| Photo | Address | Area | Beds / Baths | Price | Details |
|---|---|---|---|---|---|

|
#31
Anson Ct
Rohnert Park, CA 94928
|
1,200 sq. feet
|
2 baths 3 beds |
show details | |

|
#32
Blair Ave
Rohnert Park, CA 94928
|
1,436 sq. feet
|
2 baths 3 beds |
show details | |

|
#33
Tarton Dr
Santa Rosa, CA 95405
|
2,145 sq. feet
|
3 baths 4 beds |
show details | |

|
#34
Hollingsworth Cir
Rohnert Park, CA 94928
|
1,800 sq. feet
|
2 baths 3 beds |
show details | |

|
#35
Brookshire Cir
Santa Rosa, CA 95405
|
1,558 sq. feet
|
2 baths 4 beds |
show details | |

|
#36
Leo Dr
Santa Rosa, CA 95407
|
1,873 sq. feet
|
2 baths 3 beds |
show details | |

|
#37
Ludwig Ave
Santa Rosa, CA 95407
|
1,062 sq. feet
|
1 baths 2 beds |
show details | |

|
#38
Colgan Ave
Santa Rosa, CA 95404
|
1,340 sq. feet
|
1 baths 2 beds |
show details | |

|
#39
Stony Point Rd
Santa Rosa, CA 95407
|
1,844 sq. feet
|
3 baths 3 beds |
show details | |

|
#40
Shoreline Dr
Napa, CA 94558
|
1,653 sq. feet
|
2 baths 3 beds |
show details |
| Photo | Address | Area | Beds / Baths | Price | Details |
|---|---|---|---|---|---|

|
#41
Goldpan Cir
Santa Rosa, CA 95407
|
1,700 sq. feet
|
3 baths 3 beds |
show details | |

|
#42
Debbie Dr
Santa Rosa, CA 95407
|
1,077 sq. feet
|
2 baths 3 beds |
show details | |

|
#43
Saint Helena Rd
Santa Rosa, CA 95404
|
1,809 sq. feet
|
2 baths 3 beds |
show details | |

|
#44
Erland Rd
Santa Rosa, CA 95404
|
1,016 sq. feet
|
1 baths 2 beds |
show details | |

|
#45
Everglade Dr
Santa Rosa, CA 95409
|
1,344 sq. feet
|
2 baths 4 beds |
show details | |

|
#46
Ashwood Dr
Santa Rosa, CA 95407
|
1,287 sq. feet
|
1 baths 4 beds |
show details | |

|
#47
Wright St
Santa Rosa, CA 95404
|
1,208 sq. feet
|
1 baths 2 beds |
show details | |

|
#48
Parkside Dr
Santa Rosa, CA 95404
|
1,198 sq. feet
|
2 baths 3 beds |
show details | |

|
#49
Raccoon Ln
Santa Rosa, CA 95401
|
1,163 sq. feet
|
3 baths 2 beds |
show details | |

|
Check over 1 million property listings on Foreclosure.com!
|
browse all offers | |||

Latest news about housing in Eldridge, CA collected exclusively by city-data.com from local newspapers, TV, and radio stations

 | The Valley in the 60's,70's and 80's (196 replies) |

Median year apartment built: 1981
Household type by relationship:
Households: 721- Male householders: 173 (48 living alone), Female householders: 143 (8 living alone)
109 spouses (109 opposite-sex spouses), 87 unmarried partners, (87 opposite-sex unmarried partners), 166 children (166 natural, 0 adopted, 0 stepchildren), 0 grandchildren, 0 brothers or sisters, 0 parents, 0 foster children, 0 other relatives, 5 non-relatives
- In group quarters: 34
Size of family households: 124 2-persons, 26 3-persons, 10 4-persons, 15 5-persons.
Size of nonfamily households: 63 1-person, 91 2-persons.
34 married couples with children.
32 single-parent households (0 men, 32 women).
83.7% of residents of Eldridge speak English at home.
14.3% of residents speak Spanish at home (62% speak English very well, 38% speak English well).
1.7% of residents speak other Indo-European language at home (100% speak English very well).
Foreign born population: 55 (7.6%)
(87.3% of them are naturalized citizens)
| Here: | 6.0 |
| State: | 6.0 |
| Here: | 3.3 |
| State: | 3.9 |

- Bedrooms in owner-occupied houses and condos in Eldridge, California
- 0no bedroom
- 01 bedroom
- 352 bedrooms
- 1663 bedrooms
- 134 bedrooms
- 165+ bedrooms

- Bedrooms in renter-occupied apartments in Eldridge, California
- 6no bedroom
- 461 bedroom
- 132 bedrooms
- 333 bedrooms
- 04 bedrooms
- 05+ bedrooms

- Cars and other vehicles available in Eldridge in owner-occupied houses/condos
- 0no vehicle
- 321 vehicle
- 1082 vehicles
- 483 vehicles
- 434 vehicles
- 05+ vehicles

- Cars and other vehicles available in Eldridge in renter-occupied apartments
- 13no vehicle
- 351 vehicle
- 502 vehicles
- 03 vehicles
- 04 vehicles
- 05+ vehicles

- Rooms in owner-occupied houses in Eldridge, California
- 01 room
- 02 rooms
- 03 rooms
- 94 rooms
- 485 rooms
- 866 rooms
- 577 rooms
- 98 rooms
- 219+ rooms

- Rooms in renter-occupied apartments in Eldridge, California
- 61 room
- 172 rooms
- 293 rooms
- 64 rooms
- 255 rooms
- 06 rooms
- 157 rooms
- 08 rooms
- 09+ rooms


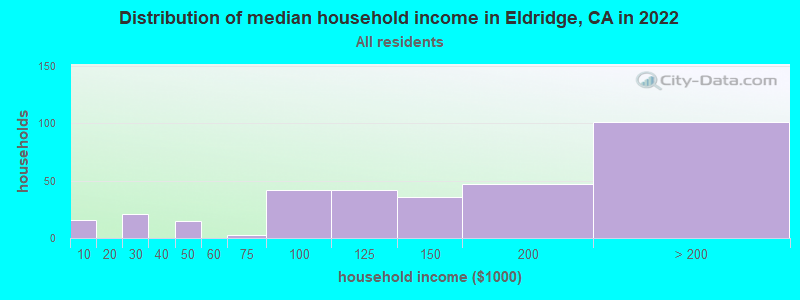
Eldridge, CA household income distribution

- 16Less than $10,000
- 21$20,000 to $29,999
- 15$40,000 to $49,999
- 3$60,000 to $74,999
- 42$75,000 to $99,999
- 42$100,000 to $124,999
- 36$125,000 to $149,999
- 47$150,000 to $199,999
- 101$200,000 or more
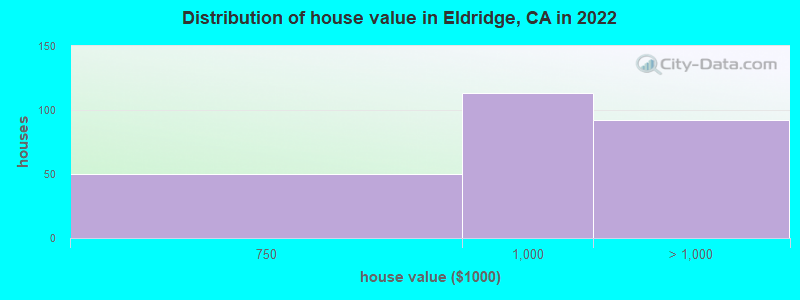
Home value of owner - occupied houses in 2022 in Eldridge, CA
-
- 50$500,000 to $749,999
- 113$750,000 to $999,999
- 91$1,500,000 to $1,999,999
Rent paid by renters in 2022 in Eldridge, CA
-
- 21$1,000 to $1,249
- 19$1,250 to $1,499
- 15$1,500 to $1,999
- 13$2,000 to $2,499
- 21$2,500 to $2,999
- 5$3,500 or more


Percentage of workers working in this county: 73.1%
Number of people working at home: 138 (35.0% of all workers)
Travel time to work (commute)
- Less than 5 minutes: 0
- 5 to 9 minutes: 8
- 10 to 14 minutes: 39
- 15 to 19 minutes: 0
- 20 to 24 minutes: 26
- 25 to 29 minutes: 0
- 30 to 34 minutes: 14
- 35 to 39 minutes: 5
- 40 to 44 minutes: 44
- 45 to 59 minutes: 79
- 60 to 89 minutes: 51
- 90 or more minutes: 0
Means of transportation to work:
- Drove a car alone: 594 (78.2%)
- Carpooled: 76 (10.0%)
- Bicycle: 8 (1.1%)
- Walked: 41 (5.4%)
- Other means: 19 (2.5%)
- Worked at home: 22 (2.9%)

- Unemployment by race in 2022
- Unemployment rate for White non-Hispanic residents
- 15.4%Males
- 12.1%Females

- Year of entry for the foreign-born population in Eldridge, California
- 82010 or later
- 02000 to 2009
- 141990 to 1999
- 961980 to 1989
- 81970 to 1979
- 37Before 1970

First ancestries reported:
- Irish: 51 (31.1%)
- German: 43 (26.2%)
- Italian: 19 (11.6%)
- European: 4 (2.4%)
- Scottish: 4 (2.4%)
Most common places of birth for foreign-born residents (%):
| Eldridge: | 41.8% (23) |
| California: | 37.2% (3,881,193) |
| Eldridge: | 34.5% (19) |
| California: | 0.5% (53,222) |
| Eldridge: | 12.7% (7) |
| California: | 0.7% (73,304) |
| Eldridge: | 7.3% (4) |
| California: | 4.2% (440,287) |
Place of birth for U.S.-born residents:
- This state: 388
- Other state: 279
- Northeast: 77
- Midwest: 96
- South: 23
- West: 77
96.0% of Eldridge residents lived in the same house 1 years ago.
Out of people who lived in different houses, 36.4% lived in this county.
Out of people who lived in different counties, 100.0% lived in California.
| Eldridge: | 96.0% |
| State average: | 88.9% |
Education attainment for males 25 years and older:
- No schooling: 4
- Nursery to 4th grade: 0
- 5th and 6th grade: 0
- 7th and 8th grade: 0
- 9th grade: 0
- 10th grade: 0
- 11th grade: 0
- 12th grade, no diploma: 0
- High school graduate (or equivalency): 61
- Less than 1 year of college: 22
- Some college more than 1 year, no degree: 89
- Associate degree: 0
- Bachelor's degree: 90
- Master's degree: 0
- Professional school degree: 0
- Doctorate degree: 13

Education attainment for females 25 years and older:
- No schooling: 0
- Nursery to 4th grade: 0
- 5th and 6th grade: 0
- 7th and 8th grade: 9
- 9th grade: 0
- 10th grade: 0
- 11th grade: 0
- 12th grade, no diploma: 8
- High school graduate (or equivalency): 0
- Less than 1 year of college: 54
- Some college more than 1 year, no degree: 54
- Associate degree: 42
- Bachelor's degree: 90
- Master's degree: 45
- Professional school degree: 16
- Doctorate degree: 0


Housing units in structures:
- One, detached: 265
- Two: 38
- 3 or 4: 7
- 5 to 9: 25
House/condo owner moved in on average 32 years ago
Renter moved in on average 11 years ago

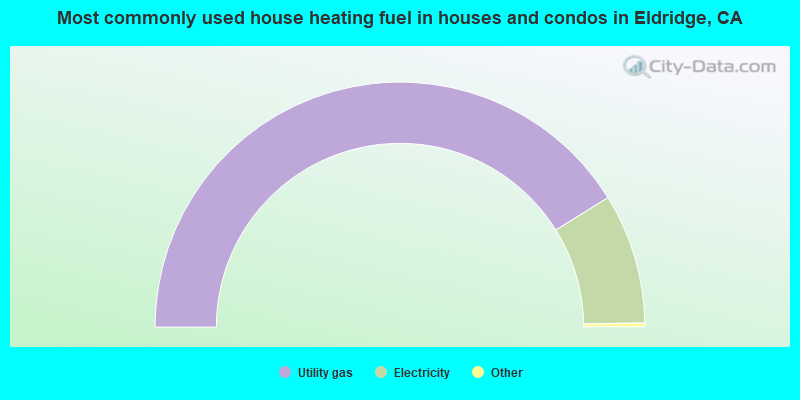
- 82.7%Utility gas
- 17.3%Electricity
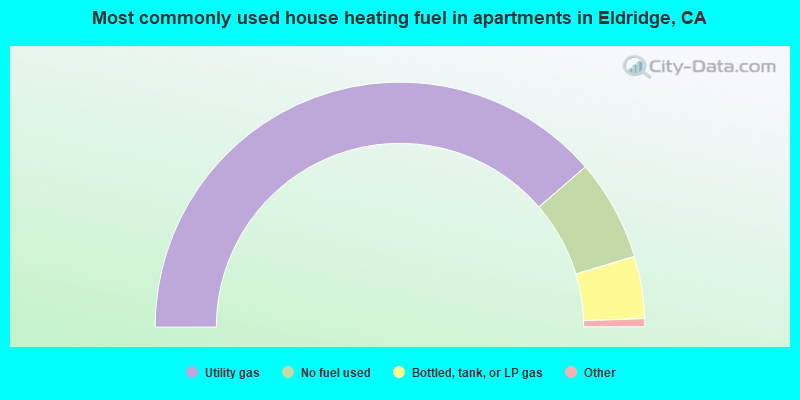
- 78.1%Utility gas
- 13.5%No fuel used
- 8.3%Bottled, tank, or LP gas
Private vs. public school enrollment:
| Here: | 0.0% |
| California: | 10.5% |
| Here: | 0.0% |
| California: | 8.5% |
| Here: | 0.0% |
| California: | 15.9% |


