Ellaville, GA (Georgia) Houses and Residents
| Ellaville: | $182,383 |
| Georgia: | $297,400 |
Mean price in 2022:
Detached houses: $175,154
Here: $175,154 State: $376,364 Mobile homes: $30,205
Here: $30,205 State: $102,413
Total population: 1,880 (Urban population: 0, Rural population: 1,659 (all nonfarm))
Houses: 769 (570 occupied: 387 owner occupied, 188 renter occupied)
| % of renters here: | 33% |
| State: | 34% |
Housing density: 242 houses/condos per square mile
Median price asked for vacant for-sale houses and condos in 2022: $118,605.
Median contract rent in 2022: $458 (lower quartile is $277, upper quartile is $616)
Median rent asked for vacant for-rent units in 2022: $891
Median gross rent in Ellaville, GA in 2022: $711
Housing units in Ellaville with a mortgage: 204 (6 second mortgage, 0 home equity loan, 6 both second mortgage and home equity loan)
Houses without a mortgage: 0
Median household income for houses/condos with a mortgage: $77,957
Median household income for apartments without a mortgage: $49,817
Median monthly housing costs: $807
Compare current foreclosures near Ellaville, GA:
| Photo | Address | Area | Beds / Baths | Price | Details |
|---|---|---|---|---|---|

|
#1
Reid Rd
Ellaville, GA 31806
|
1,440 sq. feet
|
2 baths 3 beds |
show details | |

|
#2
Ga Highway 153
Ellaville, GA 31806
|
1,403 sq. feet
|
2 baths 3 beds |
show details | |

|
#3
Harvey Cir
Ellaville, GA 31806
|
- sq. feet
|
2 baths 3 beds |
show details | |

|
#4
Northside Dr
Ellaville, GA 31806
|
- sq. feet
|
- baths - beds |
show details | |

|
#5
Ebenezer Rd
Ellaville, GA 31806
|
- sq. feet
|
- baths - beds |
show details | |

|
#6
Ga Highway 240 E
Ellaville, GA 31806
|
- sq. feet
|
- baths - beds |
show details | |

|
#7
Ga Highway 26 E
Ellaville, GA 31806
|
- sq. feet
|
- baths - beds |
show details | |

|
#8
Ga Highway 228
Ellaville, GA 31806
|
- sq. feet
|
- baths - beds |
show details | |

|
#9
Aaron Snipes Sr Dr
Americus, GA 31709
|
2,549 sq. feet
|
2 baths 4 beds |
show details | |

|
#10
Sharon Dr
Americus, GA 31709
|
1,534 sq. feet
|
2 baths 3 beds |
show details |
| Photo | Address | Area | Beds / Baths | Price | Details |
|---|---|---|---|---|---|

|
#11
Douglas Cir
Americus, GA 31709
|
1,104 sq. feet
|
1 baths 3 beds |
show details | |

|
#12
Sharon Cir
Americus, GA 31709
|
1,406 sq. feet
|
2 baths 3 beds |
show details | |

|
#13
Peachtree St
Americus, GA 31719
|
1,050 sq. feet
|
1 baths 3 beds |
show details | |

|
#14
Davenport St
Americus, GA 31719
|
1,134 sq. feet
|
1 baths 3 beds |
show details | |

|
#15
Laurel Cir
Americus, GA 31719
|
1,075 sq. feet
|
1 baths 3 beds |
show details | |

|
#16
N Lee St
Americus, GA 31719
|
1,150 sq. feet
|
1 baths 3 beds |
show details | |

|
#17
Academy St
Americus, GA 31709
|
1,352 sq. feet
|
1 baths 5 beds |
show details | |

|
#18
Allen St
Americus, GA 31719
|
994 sq. feet
|
2 baths 3 beds |
show details | |

|
#19
Park Row
Americus, GA 31719
|
1,178 sq. feet
|
1 baths 3 beds |
show details | |

|
#20
Ridge St
Americus, GA 31709
|
1,176 sq. feet
|
2 baths 3 beds |
show details |
| Photo | Address | Area | Beds / Baths | Price | Details |
|---|---|---|---|---|---|

|
#21
S Hampton St
Americus, GA 31709
|
1,204 sq. feet
|
1 baths 4 beds |
show details | |

|
#22
Habitat St
Americus, GA 31709
|
976 sq. feet
|
1 baths 3 beds |
show details | |

|
#23
S Jackson St
Americus, GA 31709
|
1,811 sq. feet
|
2 baths 3 beds |
show details | |

|
#24
Lorraine Ave
Americus, GA 31709
|
1,420 sq. feet
|
1 baths 3 beds |
show details | |

|
#25
Andrews Dr
Americus, GA 31719
|
1,375 sq. feet
|
1 baths 3 beds |
show details | |

|
#26
Barlow St
Americus, GA 31709
|
1,441 sq. feet
|
2 baths 3 beds |
show details | |

|
#27
S Lee St
Americus, GA 31709
|
3,563 sq. feet
|
2 baths 3 beds |
show details | |

|
#28
Sylvan Rd
Americus, GA 31709
|
1,144 sq. feet
|
1 baths 3 beds |
show details | |

|
#29
Fox Stephens Rd
Americus, GA 31719
|
2,120 sq. feet
|
2 baths 3 beds |
show details | |

|
#30
Springdale Dr
Americus, GA 31709
|
1,404 sq. feet
|
2 baths 3 beds |
show details |
| Photo | Address | Area | Beds / Baths | Price | Details |
|---|---|---|---|---|---|

|
#31
S Lee St
Americus, GA 31709
|
1,112 sq. feet
|
1 baths 2 beds |
show details | |

|
#32
Rose Ave
Americus, GA 31709
|
2,057 sq. feet
|
2 baths 3 beds |
show details | |

|
#33
S Dooly St
Montezuma, GA 31063
|
1,832 sq. feet
|
3 baths 4 beds |
show details | |

|
#34
Drayton Rd
Montezuma, GA 31063
|
1,152 sq. feet
|
2 baths 3 beds |
show details | |

|
#35
N Jackson St
Americus, GA 31719
|
968 sq. feet
|
1 baths 4 beds |
show details | |

|
#36
Sharon Cir
Americus, GA 31709
|
2,100 sq. feet
|
2 baths 3 beds |
show details | |

|
#37
Patton Dr
Americus, GA 31719
|
2,262 sq. feet
|
2 baths 3 beds |
show details | |

|
#38
Armory Dr
Americus, GA 31719
|
1,050 sq. feet
|
2 baths 3 beds |
show details | |

|
#39
Hosanna Cir
Americus, GA 31719
|
1,134 sq. feet
|
1 baths 4 beds |
show details | |

|
#40
Hosanna Cir
Americus, GA 31719
|
1,048 sq. feet
|
1 baths 3 beds |
show details |
| Photo | Address | Area | Beds / Baths | Price | Details |
|---|---|---|---|---|---|

|
#41
Patton Dr
Americus, GA 31719
|
1,521 sq. feet
|
2 baths 3 beds |
show details | |

|
#42
Hosanna Cir
Americus, GA 31719
|
1,232 sq. feet
|
1 baths 3 beds |
show details | |

|
#43
Hosanna Cir
Americus, GA 31719
|
1,125 sq. feet
|
1 baths 3 beds |
show details | |

|
#44
Armory Dr
Americus, GA 31719
|
1,620 sq. feet
|
2 baths 3 beds |
show details | |

|
#45
Hosanna Cir
Americus, GA 31719
|
1,125 sq. feet
|
1 baths 3 beds |
show details | |

|
#46
Hosanna Cir
Americus, GA 31719
|
1,125 sq. feet
|
1 baths 3 beds |
show details | |

|
#47
N Jackson St
Americus, GA 31719
|
1,026 sq. feet
|
1 baths 4 beds |
show details | |

|
#48
Lafayette St
Americus, GA 31719
|
864 sq. feet
|
1 baths 3 beds |
show details | |

|
#49
Horton Dr
Americus, GA 31719
|
1,409 sq. feet
|
1 baths - beds |
show details | |

|
Check over 1 million property listings on Foreclosure.com!
|
browse all offers | |||

Latest news about housing in Ellaville, GA collected exclusively by city-data.com from local newspapers, TV, and radio stations

 | BRAC and Kia Set to Make Columbus an Economic Oasis (154 replies) |
| Places to live midway between Columbus and Albany (6 replies) |

Median year apartment built: 1978
Household type by relationship:
Households: 1,518- Male householders: 189 (38 living alone), Female householders: 376 (121 living alone)
246 spouses (246 opposite-sex spouses), 14 unmarried partners, (14 opposite-sex unmarried partners), 535 children (500 natural, 9 adopted, 25 stepchildren), 26 grandchildren, 45 brothers or sisters, 33 parents, 0 foster children, 50 other relatives, 0 non-relatives
Size of family households: 158 2-persons, 168 3-persons, 64 4-persons, 4 5-persons, 13 6-persons.
Size of nonfamily households: 160 1-person, 7 2-persons.
218 married couples with children.
147 single-parent households (46 men, 101 women).
98.6% of residents of Ellaville speak English at home.
0.9% of residents speak Spanish at home (100% speak English very well).
Foreign born population: 10 (0.7%)
(60.0% of them are naturalized citizens)
| Here: | 6.9 |
| State: | 6.8 |
| Here: | 4.4 |
| State: | 4.6 |

- Bedrooms in owner-occupied houses and condos in Ellaville, Georgia
- 0no bedroom
- 01 bedroom
- 672 bedrooms
- 2043 bedrooms
- 534 bedrooms
- 635+ bedrooms

- Bedrooms in renter-occupied apartments in Ellaville, Georgia
- 5no bedroom
- 191 bedroom
- 1082 bedrooms
- 383 bedrooms
- 194 bedrooms
- 05+ bedrooms

- Cars and other vehicles available in Ellaville in owner-occupied houses/condos
- 8no vehicle
- 1411 vehicle
- 1062 vehicles
- 973 vehicles
- 204 vehicles
- 165+ vehicles

- Cars and other vehicles available in Ellaville in renter-occupied apartments
- 72no vehicle
- 861 vehicle
- 192 vehicles
- 123 vehicles
- 04 vehicles
- 05+ vehicles

- Rooms in owner-occupied houses in Ellaville, Georgia
- 01 room
- 02 rooms
- 03 rooms
- 514 rooms
- 695 rooms
- 606 rooms
- 377 rooms
- 1278 rooms
- 449+ rooms

- Rooms in renter-occupied apartments in Ellaville, Georgia
- 51 room
- 42 rooms
- 63 rooms
- 874 rooms
- 475 rooms
- 206 rooms
- 07 rooms
- 158 rooms
- 59+ rooms


Ellaville, GA household income distribution

- 60Less than $10,000
- 95$10,000 to $19,999
- 49$20,000 to $29,999
- 48$30,000 to $39,999
- 24$40,000 to $49,999
- 38$50,000 to $59,999
- 42$60,000 to $74,999
- 114$75,000 to $99,999
- 43$100,000 to $124,999
- 10$125,000 to $149,999
- 27$150,000 to $199,999
- 19$200,000 or more
Home value of owner - occupied houses in 2022 in Ellaville, GA
-
- 11Less than $10,000
- 6$10,000 to $14,999
- 6$15,000 to $19,999
- 2$25,000 to $29,999
- 17$30,000 to $34,999
- 29$40,000 to $49,999
- 8$50,000 to $59,999
- 3$80,000 to $89,999
- 5$90,000 to $99,999
- 25$100,000 to $124,999
- 30$125,000 to $149,999
- 47$150,000 to $174,999
- 23$175,000 to $199,999
- 73$200,000 to $249,999
- 7$250,000 to $299,999
- 5$500,000 to $749,999
Rent paid by renters in 2022 in Ellaville, GA
-
- 10Less than $100
- 17$100 to $149
- 3$200 to $249
- 12$250 to $299
- 11$350 to $399
- 33$400 to $449
- 6$450 to $499
- 22$500 to $549
- 8$550 to $599
- 14$600 to $649
- 5$700 to $749
- 9$750 to $799
- 4$800 to $899
- 15No cash rent


Percentage of workers working in this county: 30.8%
Number of people working at home: 38 (7.6% of all workers)
Travel time to work (commute)
- Less than 5 minutes: 43
- 5 to 9 minutes: 4
- 10 to 14 minutes: 75
- 15 to 19 minutes: 65
- 20 to 24 minutes: 81
- 25 to 29 minutes: 19
- 30 to 34 minutes: 75
- 35 to 39 minutes: 0
- 40 to 44 minutes: 4
- 45 to 59 minutes: 9
- 60 to 89 minutes: 41
- 90 or more minutes: 19
Means of transportation to work:
- Drove a car alone: 618 (74.5%)
- Carpooled: 146 (17.6%)
- Walked: 4 (0.5%)
- Worked at home: 38 (4.6%)

- Unemployment by race in 2022
- Unemployment rate for White non-Hispanic residents
- 1.1%Females
- Unemployment rate for Black residents
- 32.6%Females

- Year of entry for the foreign-born population in Ellaville, Georgia
- 52010 or later
- 02000 to 2009
- 61990 to 1999
- 01980 to 1989
- 01970 to 1979
- 2Before 1970
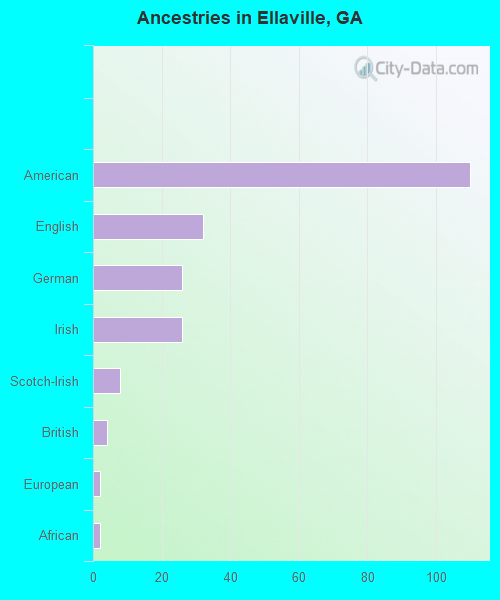
First ancestries reported:
- American: 110 (12.5%)
- English: 32 (3.6%)
- German: 26 (3.0%)
- Irish: 26 (3.0%)
- Scotch-Irish: 8 (0.9%)
- British: 4 (0.5%)
- European: 2 (0.2%)
- African: 2 (0.2%)
Most common places of birth for foreign-born residents (%):
| Ellaville: | 40.0% (4) |
| Georgia: | 1.7% (18,651) |
| Ellaville: | 40.0% (4) |
| Georgia: | 4.6% (51,270) |
Place of birth for U.S.-born residents:
- This state: 1,269
- Other state: 217
- Northeast: 13
- Midwest: 55
- South: 131
- West: 19
92.2% of Ellaville residents lived in the same house 1 years ago.
Out of people who lived in different houses, 11.6% lived in this county.
Out of people who lived in different counties, 100.0% lived in Georgia.
| Ellaville: | 92.2% |
| State average: | 86.6% |
Education attainment for males 25 years and older:
- No schooling: 5
- Nursery to 4th grade: 0
- 5th and 6th grade: 0
- 7th and 8th grade: 0
- 9th grade: 20
- 10th grade: 4
- 11th grade: 14
- 12th grade, no diploma: 2
- High school graduate (or equivalency): 195
- Less than 1 year of college: 7
- Some college more than 1 year, no degree: 46
- Associate degree: 39
- Bachelor's degree: 74
- Master's degree: 4
- Professional school degree: 6
- Doctorate degree: 0

Education attainment for females 25 years and older:
- No schooling: 36
- Nursery to 4th grade: 0
- 5th and 6th grade: 0
- 7th and 8th grade: 14
- 9th grade: 22
- 10th grade: 21
- 11th grade: 17
- 12th grade, no diploma: 39
- High school graduate (or equivalency): 154
- Less than 1 year of college: 25
- Some college more than 1 year, no degree: 81
- Associate degree: 81
- Bachelor's degree: 67
- Master's degree: 43
- Professional school degree: 9
- Doctorate degree: 0


Housing units in structures:
- One, detached: 469
- One, attached: 6
- Two: 51
- 5 to 9: 23
- 10 to 19: 3
- 20 to 49: 5
- 50 or more: 4
- Mobile homes: 206
Housing units lacking complete kitchen facilities in 2022: 1.1%
House/condo owner moved in on average 12 years ago
Renter moved in on average 4 years ago

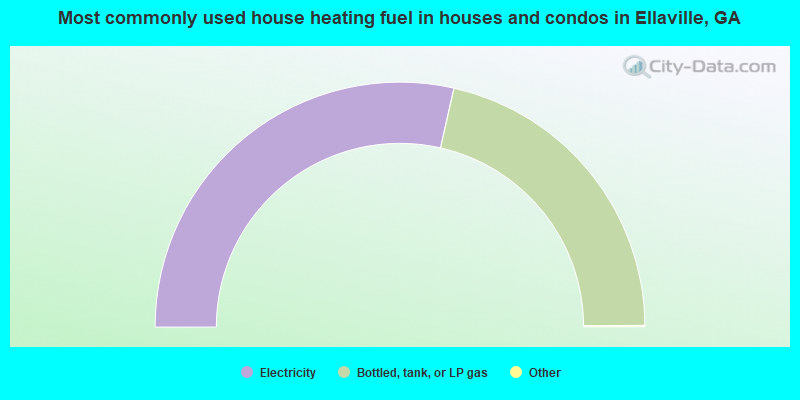
- 57.2%Electricity
- 42.8%Bottled, tank, or LP gas

- 68.7%Electricity
- 30.2%Bottled, tank, or LP gas
- 1.1%Utility gas
Private vs. public school enrollment:
| Here: | 0.0% |
| Georgia: | 12.1% |
| Here: | 0.0% |
| Georgia: | 10.8% |
| Here: | 0.0% |
| Georgia: | 17.1% |


