Ellenburg, NY (New York) Houses and Residents
| Ellenburg: | $132,512 |
| New York: | $400,400 |
Total population: 1,743 (Urban population: 0, Rural population: 1,788 (130 farm, 1,658 nonfarm))
Houses: 938 (700 occupied: 569 owner occupied, 131 renter occupied)
| % of renters here: | 19% |
| State: | 46% |
Housing density: 9 houses/condos per square mile
Median price asked for vacant for-sale houses and condos in 2022 in this county: $109,243.
Median contract rent in 2022: $611 (lower quartile is $419, upper quartile is $781)
Median rent asked for vacant for-rent units in 2022: $848
Median gross rent in Ellenburg, NY in 2022: $784
Housing units in Ellenburg with a mortgage: 170 (11 second mortgage, 20 home equity loan, 0 both second mortgage and home equity loan)
Houses without a mortgage: 158
Compare current foreclosures near Ellenburg, NY:
| Photo | Address | Area | Beds / Baths | Price | Details |
|---|---|---|---|---|---|

|
#1
Star Rd
Ellenburg, NY 12933
|
2,052 sq. feet
|
2 baths 3 beds |
$150,000
|
show details |

|
#2
Smith Street
Dannemora, NY 12929
|
- sq. feet
|
2 baths 3 beds |
show details | |

|
#3
Rand Hill Rd
Altona, NY 12910
|
1,559 sq. feet
|
1 baths 3 beds |
show details | |

|
#4
Pikeville Rd
Burke, NY 12917
|
1,924 sq. feet
|
2 baths 4 beds |
show details | |

|
#5
Picketts Corners Rd
Saranac, NY 12981
|
957 sq. feet
|
1 baths 2 beds |
show details | |

|
#6
General Leroy Manor Rd
Morrisonville, NY 12962
|
1,288 sq. feet
|
1 baths 3 beds |
show details | |

|
#7
Gene Lefevre Rd
Morrisonville, NY 12962
|
1,848 sq. feet
|
1 baths 3 beds |
show details | |

|
#8
Sancomb Rd
Chateaugay, NY 12920
|
- sq. feet
|
- baths - beds |
show details | |

|
#9
Franklin St
Chateaugay, NY 12920
|
- sq. feet
|
- baths - beds |
show details | |

|
#10
State Route 11
Chateaugay, NY 12920
|
- sq. feet
|
- baths - beds |
show details |
| Photo | Address | Area | Beds / Baths | Price | Details |
|---|---|---|---|---|---|

|
#11
County Route 23
Chateaugay, NY 12920
|
- sq. feet
|
- baths - beds |
show details | |

|
#12
Smith St
Saranac, NY 12981
|
- sq. feet
|
- baths - beds |
show details | |

|
#13
Rt 11
Mooers Forks, NY 12959
|
- sq. feet
|
- baths - beds |
show details | |

|
#14
Henry Rd
Malone, NY 12953
|
- sq. feet
|
- baths - beds |
show details | |

|
Check over 1 million property listings on Foreclosure.com!
|
browse all offers | |||
Latest news about housing in Ellenburg, NY collected exclusively by city-data.com from local newspapers, TV, and radio stations

 | smaller Upstate NY cities and towns/African American communities (6001 replies) |
| The Adirondacks vs. Vermont (40 replies) |
| Schoharie County Wind Farm Notification (45 replies) |

Household type by relationship:
Households: 74,975- In family households: 58,983 (13,644 male householders, 6,108 female householders)
14,746 spouses, 19,293 children (17,801 natural, 411 adopted, 1,081 stepchildren), 1,138 grandchildren, 426 brothers or sisters, 440 parents, foster children, 484 other relatives, 2,428 non-relatives
- In nonfamily households: 15,992 (5,731 male householders (3,962 living alone)), 6,099 female householders (4,718 living alone)), 4,162 nonrelatives
- In group quarters: 7,153 (4,025 institutionalized population)
12,265 married couples with children.
4,595 single-parent households (1,328 men, 3,267 women).
94.2% of residents of Ellenburg speak English at home.
2.0% of residents speak Spanish at home (62% speak English very well, 26% speak English well, 12% speak English not well).
3.5% of residents speak other Indo-European language at home (73% speak English very well, 18% speak English well, 5% speak English not well, 3% don't speak English at all).
0.2% of residents speak Asian or Pacific Island language at home (50% speak English very well, 50% speak English well).
Foreign born population: 54 (3.1%)
(37.0% of them are naturalized citizens)
| Here: | 6.3 |
| State: | 6.3 |
| Here: | 4.3 |
| State: | 3.8 |

- Bedrooms in owner-occupied houses and condos in Ellenburg, New York
- 0no bedroom
- 161 bedroom
- 1272 bedrooms
- 2813 bedrooms
- 984 bedrooms
- 475+ bedrooms

- Bedrooms in renter-occupied apartments in Ellenburg, New York
- 2no bedroom
- 421 bedroom
- 482 bedrooms
- 293 bedrooms
- 64 bedrooms
- 45+ bedrooms

- Cars and other vehicles available in Ellenburg in owner-occupied houses/condos
- 23no vehicle
- 1441 vehicle
- 2622 vehicles
- 1023 vehicles
- 164 vehicles
- 225+ vehicles

- Cars and other vehicles available in Ellenburg in renter-occupied apartments
- 35no vehicle
- 581 vehicle
- 342 vehicles
- 43 vehicles
- 04 vehicles
- 05+ vehicles

- Rooms in owner-occupied houses in Ellenburg, New York
- 01 room
- 52 rooms
- 183 rooms
- 584 rooms
- 1405 rooms
- 1136 rooms
- 1167 rooms
- 648 rooms
- 559+ rooms

- Rooms in renter-occupied apartments in Ellenburg, New York
- 21 room
- 62 rooms
- 233 rooms
- 344 rooms
- 375 rooms
- 166 rooms
- 27 rooms
- 18 rooms
- 109+ rooms


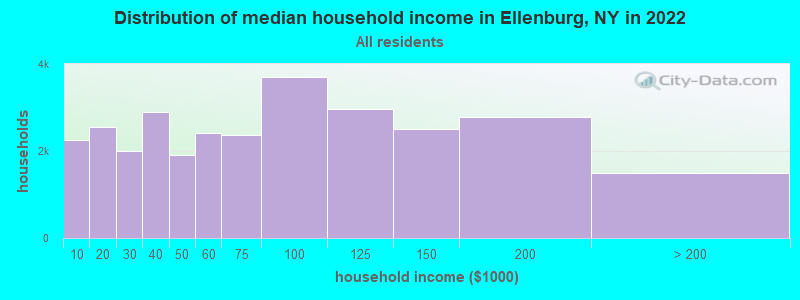
Ellenburg, NY household income distribution

- 2,258Less than $10,000
- 2,551$10,000 to $19,999
- 2,001$20,000 to $29,999
- 2,903$30,000 to $39,999
- 1,919$40,000 to $49,999
- 2,403$50,000 to $59,999
- 2,376$60,000 to $74,999
- 3,701$75,000 to $99,999
- 2,973$100,000 to $124,999
- 2,504$125,000 to $149,999
- 2,791$150,000 to $199,999
- 1,489$200,000 or more
Percentage of workers working in this county: 78.9%
Number of people working at home: 101 (12.0% of all workers)
Travel time to work (commute)
- Less than 5 minutes: 48
- 5 to 9 minutes: 94
- 10 to 14 minutes: 52
- 15 to 19 minutes: 38
- 20 to 24 minutes: 40
- 25 to 29 minutes: 28
- 30 to 34 minutes: 154
- 35 to 39 minutes: 37
- 40 to 44 minutes: 60
- 45 to 59 minutes: 87
- 60 to 89 minutes: 36
- 90 or more minutes: 19
Means of transportation to work:
- Drove a car alone: 565 (72.0%)
- Carpooled: 89 (11.3%)
- Bus or trolley bus: 3 (0.4%)
- Railroad: 4 (0.5%)
- Walked: 24 (3.1%)
- Other means: 8 (1.0%)
- Worked at home: 92 (11.7%)


- Year of entry for the foreign-born population in Ellenburg, New York
- 01995 to March 2000
- 111990 to 1994
- 41985 to 1989
- 91980 to 1984
- 21975 to 1979
- 81970 to 1974
- 41965 to 1969
- 16Before 1965

First ancestries reported:
- French: 579 (30.9%)
- Irish: 272 (14.5%)
- French Canadian: 214 (11.4%)
- Other: 191 (10.2%)
- English: 190 (10.1%)
- United States: 158 (8.4%)
- German: 59 (3.1%)
- Italian: 56 (3.0%)
- Dutch: 47 (2.5%)
- Scottish: 37 (2.0%)
- Scotch-Irish: 23 (1.2%)
- Lithuanian: 13 (0.7%)
- Norwegian: 11 (0.6%)
- Polish: 9 (0.5%)
- Swedish: 5 (0.3%)
- Welsh: 3 (0.2%)
- Portuguese: 2 (0.1%)
- Russian: 2 (0.1%)
- Subsaharan African: 2 (0.1%)
- Danish: 1 (0.05%)
- Greek: 1 (0.05%)
Most common places of birth for foreign-born residents (%):
| Ellenburg: | 57.4% (31) |
| New York: | 1.4% (54,876) |
| Ellenburg: | 7.4% (4) |
| New York: | 3.8% (147,729) |
| Ellenburg: | 7.4% (4) |
| New York: | 3.0% (117,238) |
| Ellenburg: | 7.4% (4) |
| New York: | 0.3% (13,114) |
| Ellenburg: | 5.6% (3) |
| New York: | 0.2% (6,545) |
| Ellenburg: | 3.7% (2) |
| New York: | 1.8% (69,327) |
| Ellenburg: | 3.7% (2) |
| New York: | 6.0% (233,766) |
| Ellenburg: | 3.7% (2) |
| New York: | 2.5% (97,933) |
| Ellenburg: | 3.7% (2) |
| New York: | 0.2% (7,400) |
Place of birth for U.S.-born residents:
- This state: 1,495
- Other state: 226
- Northeast: 159
- Midwest: 20
- South: 26
- West: 21
74% of Ellenburg residents lived in the same house 5 years ago.
Out of people who lived in different houses, 61% lived in this county.
Out of people who lived in different counties, 51% lived in New York.
Education attainment for males 25 years and older:
- No schooling: 4
- Nursery to 4th grade: 2
- 5th and 6th grade: 5
- 7th and 8th grade: 56
- 9th grade: 17
- 10th grade: 31
- 11th grade: 33
- 12th grade, no diploma: 9
- High school graduate (or equivalency): 252
- Less than 1 year of college: 25
- Some college more than 1 year, no degree: 56
- Associate degree: 52
- Bachelor's degree: 22
- Master's degree: 25
- Professional school degree: 6
- Doctorate degree: 2

Education attainment for females 25 years and older:
- No schooling: 7
- Nursery to 4th grade: 0
- 5th and 6th grade: 6
- 7th and 8th grade: 51
- 9th grade: 25
- 10th grade: 44
- 11th grade: 18
- 12th grade, no diploma: 9
- High school graduate (or equivalency): 250
- Less than 1 year of college: 32
- Some college more than 1 year, no degree: 71
- Associate degree: 32
- Bachelor's degree: 46
- Master's degree: 24
- Professional school degree: 4
- Doctorate degree: 2


Housing units in structures:
- One, detached: 688
- One, attached: 16
- Two: 21
- 3 or 4: 18
- 10 to 19: 28
- 20 to 49: 4
- 50 or more: 2
- Mobile homes: 161
Median worth of mobile homes: $74,565
Housing units lacking complete kitchen facilities: 1.0%

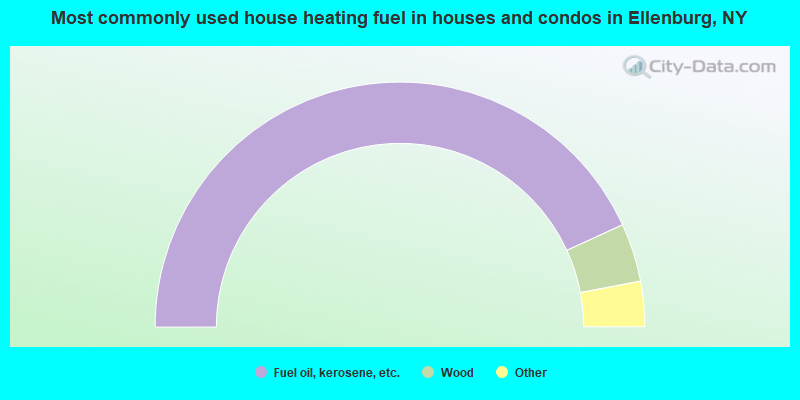
- 86.3%Fuel oil, kerosene, etc.
- 7.7%Wood
- 3.5%Electricity
- 2.1%Bottled, tank, or LP gas
- 0.4%Coal or coke
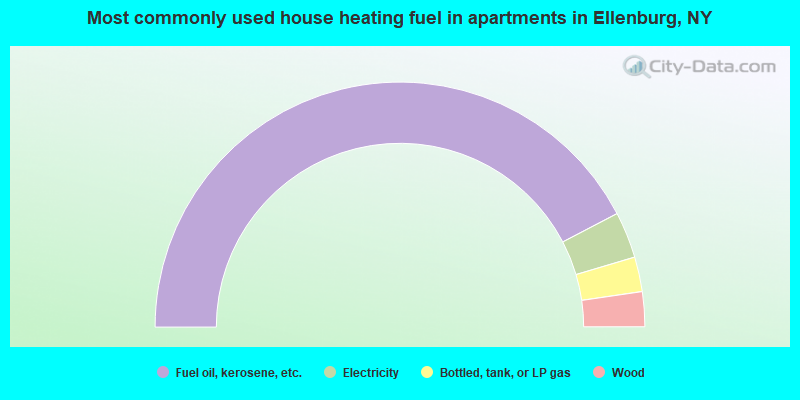
- 84.7%Fuel oil, kerosene, etc.
- 6.1%Electricity
- 4.6%Bottled, tank, or LP gas
- 4.6%Wood
Private vs. public school enrollment:
| Here: | 0.9% |
| New York: | 14.0% |
| Here: | 6.2% |
| New York: | 13.2% |
| Here: | 3.4% |
| New York: | 38.2% |


