Ellport, PA (Pennsylvania) Houses and Residents
| Ellport: | $138,410 |
| Pennsylvania: | $245,500 |
Mean price in 2022:
Detached houses: $133,190
Here: $133,190 State: $317,202
Total population: 1,148 (Urban population: 1,145, Rural population: 0)
Houses: 477 (467 occupied: 408 owner occupied, 56 renter occupied)
| % of renters here: | 12% |
| State: | 31% |
Housing density: 1,098 houses/condos per square mile
Median price asked for vacant for-sale houses and condos in 2022 in this county: $114,008.
Median contract rent in 2022: $622 (lower quartile is $516, upper quartile is $644)
Median rent asked for vacant for-rent units in 2022: $833
Median gross rent in Ellport, PA in 2022: $798
Housing units in Ellport with a mortgage: 218 (15 second mortgage, 0 home equity loan, 12 both second mortgage and home equity loan)
Houses without a mortgage: 15
Median household income for houses/condos with a mortgage: $78,613
Median household income for apartments without a mortgage: $77,302
Median monthly housing costs: $828
Compare current foreclosures near Ellport, PA:
| Photo | Address | Area | Beds / Baths | Price | Details |
|---|---|---|---|---|---|

|
#1
Main St
New Middletown, OH 44442
|
1,144 sq. feet
|
1 baths 3 beds |
$189,900
|
show details |

|
#2
Darlington Rd
Wampum, PA 16157
|
1,212 sq. feet
|
2 baths 3 beds |
$194,500
|
show details |

|
#3
Ryan Ave
New Castle, PA 16101
|
864 sq. feet
|
1 baths 3 beds |
$34,900
|
show details |

|
#4
Sunset Boulavard
Aliquippa, PA 15001
|
- sq. feet
|
1 baths 3 beds |
show details | |

|
#5
Midland Beaver Rd
Industry, PA 15052
|
- sq. feet
|
1 baths 2 beds |
show details | |

|
#6
Erie St
Edinburg, PA 16116
|
1,114 sq. feet
|
1 baths 3 beds |
show details | |

|
#7
Pollock Ave
New Castle, PA 16101
|
1,792 sq. feet
|
1 baths 3 beds |
show details | |

|
#8
Beaver Dam Rd
New Galilee, PA 16141
|
1,088 sq. feet
|
1 baths 3 beds |
show details | |

|
#9
Chestnut St
New Castle, PA 16101
|
1,232 sq. feet
|
1 baths 2 beds |
show details | |

|
#10
9th St
Beaver Falls, PA 15010
|
1,408 sq. feet
|
1 baths 3 beds |
show details |
| Photo | Address | Area | Beds / Baths | Price | Details |
|---|---|---|---|---|---|

|
#11
Neshannock Blvd
New Castle, PA 16101
|
1,440 sq. feet
|
2 baths 3 beds |
show details | |

|
#12
32nd Ave
New Brighton, PA 15066
|
1,608 sq. feet
|
1 baths 3 beds |
show details | |

|
#13
Foster Rd
Beaver Falls, PA 15010
|
1,456 sq. feet
|
1 baths 3 beds |
show details | |

|
#14
E Clark St
East Palestine, OH 44413
|
1,386 sq. feet
|
1 baths 3 beds |
show details | |

|
#15
Park St
Rochester, PA 15074
|
1,360 sq. feet
|
1 baths 3 beds |
show details | |

|
#16
Church St
Prospect, PA 16052
|
1,560 sq. feet
|
1 baths 3 beds |
show details | |

|
#17
5th Ave
Freedom, PA 15042
|
1,456 sq. feet
|
1 baths 3 beds |
show details | |

|
#18
Webster St
Rochester, PA 15074
|
1,120 sq. feet
|
2 baths 3 beds |
show details | |

|
#19
State St
Baden, PA 15005
|
1,011 sq. feet
|
1 baths 2 beds |
show details | |

|
#20
4th Avenue
Koppel, PA 16136
|
672 sq. feet
|
2 baths 2 beds |
show details |
| Photo | Address | Area | Beds / Baths | Price | Details |
|---|---|---|---|---|---|

|
#21
Washington St
Aliquippa, PA 15001
|
1,800 sq. feet
|
1 baths 3 beds |
show details | |

|
#22
Red Fox Ct
Baden, PA 15005
|
- sq. feet
|
2 baths 4 beds |
show details | |

|
#23
E Maitland Ln
New Castle, PA 16105
|
1,482 sq. feet
|
2 baths 3 beds |
show details | |

|
#24
Williams Ave
Rochester, PA 15074
|
- sq. feet
|
2 baths 3 beds |
show details | |

|
#25
18th St
Beaver Falls, PA 15010
|
920 sq. feet
|
1 baths 3 beds |
show details | |

|
#26
16th Ave
Beaver Falls, PA 15010
|
817 sq. feet
|
1 baths 2 beds |
show details | |

|
#27
41st Ave
New Brighton, PA 15066
|
1,060 sq. feet
|
1 baths 3 beds |
show details | |

|
#28
Falls Ave
New Castle, PA 16105
|
1,860 sq. feet
|
2 baths 4 beds |
show details | |

|
#29
3rd Ave
New Brighton, PA 15066
|
1,774 sq. feet
|
1 baths 3 beds |
show details | |

|
#30
Main Ave
New Brighton, PA 15066
|
1,796 sq. feet
|
1 baths 2 beds |
show details |
| Photo | Address | Area | Beds / Baths | Price | Details |
|---|---|---|---|---|---|

|
#31
Franklin Ave
Ellwood City, PA 16117
|
1,948 sq. feet
|
1 baths 4 beds |
show details | |

|
#32
Cherokee Dr
Beaver Falls, PA 15010
|
- sq. feet
|
2 baths 3 beds |
show details | |

|
#33
Blackhawk Rd
Beaver Falls, PA 15010
|
1,794 sq. feet
|
2 baths 3 beds |
show details | |

|
#34
N Cascade St
New Castle, PA 16101
|
2,048 sq. feet
|
2 baths 3 beds |
show details | |

|
#35
Webster St
Rochester, PA 15074
|
1,792 sq. feet
|
1 baths 3 beds |
show details | |

|
#36
Irvin Ave
Rochester, PA 15074
|
1,164 sq. feet
|
1 baths 2 beds |
show details | |

|
#37
2nd Ave
Beaver, PA 15009
|
1,200 sq. feet
|
1 baths 3 beds |
show details | |

|
#38
New York Ave
Rochester, PA 15074
|
1,656 sq. feet
|
1 baths 3 beds |
show details | |

|
#39
Primrose Pl
New Castle, PA 16101
|
2,104 sq. feet
|
2 baths 3 beds |
show details | |

|
#40
N Cascade St
New Castle, PA 16101
|
976 sq. feet
|
1 baths 1 beds |
show details |
| Photo | Address | Area | Beds / Baths | Price | Details |
|---|---|---|---|---|---|

|
#41
Georgetown Rd
Beaver Falls, PA 15010
|
1,356 sq. feet
|
1 baths 2 beds |
show details | |

|
#42
Glen Eden Rd
Zelienople, PA 16063
|
1,200 sq. feet
|
1 baths 2 beds |
show details | |

|
#43
Duss Ave
Rochester, PA 15074
|
1,232 sq. feet
|
1 baths 3 beds |
show details | |

|
#44
State Route 170
East Palestine, OH 44413
|
960 sq. feet
|
1 baths 3 beds |
show details | |

|
#45
Harrison St
New Castle, PA 16101
|
1,699 sq. feet
|
1 baths 3 beds |
show details | |

|
#46
E Long Ave
New Castle, PA 16101
|
1,406 sq. feet
|
1 baths 3 beds |
show details | |

|
#47
Frew Mill Rd
New Castle, PA 16101
|
1,152 sq. feet
|
2 baths 3 beds |
show details | |

|
#48
E Reynolds St
New Castle, PA 16101
|
992 sq. feet
|
1 baths 2 beds |
show details | |

|
#49
E Reynolds St
New Castle, PA 16101
|
1,677 sq. feet
|
2 baths 3 beds |
show details | |

|
Check over 1 million property listings on Foreclosure.com!
|
browse all offers | |||

Latest news about housing in Ellport, PA collected exclusively by city-data.com from local newspapers, TV, and radio stations

 | New Castle? (30 replies) |

Median year apartment built: 1955
Household type by relationship:
Households: 1,063- Male householders: 183 (47 living alone), Female householders: 278 (78 living alone)
227 spouses (224 opposite-sex spouses), 34 unmarried partners, (24 opposite-sex unmarried partners), 264 children (258 natural, 3 adopted, 1 stepchildren), 29 grandchildren, 20 brothers or sisters, 2 parents, 0 foster children, 0 other relatives, 21 non-relatives
Size of family households: 173 2-persons, 64 3-persons, 29 4-persons, 20 5-persons, 16 6-persons.
Size of nonfamily households: 133 1-person, 17 2-persons, 5 3-persons.
58 married couples with children.
78 single-parent households (5 men, 73 women).
98.8% of residents of Ellport speak English at home.
0.9% of residents speak other Indo-European language at home (67% speak English very well, 33% speak English well).
Foreign born population: 2 (0.2%)
(150.0% of them are naturalized citizens)
| Here: | 6.5 |
| State: | 6.8 |
| Here: | 4.6 |
| State: | 4.3 |

- Bedrooms in owner-occupied houses and condos in Ellport, Pennsylvania
- 4no bedroom
- 211 bedroom
- 622 bedrooms
- 2583 bedrooms
- 484 bedrooms
- 165+ bedrooms

- Bedrooms in renter-occupied apartments in Ellport, Pennsylvania
- 0no bedroom
- 231 bedroom
- 292 bedrooms
- 53 bedrooms
- 04 bedrooms
- 05+ bedrooms

- Cars and other vehicles available in Ellport in owner-occupied houses/condos
- 7no vehicle
- 1131 vehicle
- 1612 vehicles
- 953 vehicles
- 324 vehicles
- 05+ vehicles

- Cars and other vehicles available in Ellport in renter-occupied apartments
- 7no vehicle
- 411 vehicle
- 62 vehicles
- 33 vehicles
- 04 vehicles
- 05+ vehicles

- Rooms in owner-occupied houses in Ellport, Pennsylvania
- 41 room
- 32 rooms
- 83 rooms
- 374 rooms
- 535 rooms
- 1106 rooms
- 1087 rooms
- 288 rooms
- 589+ rooms

- Rooms in renter-occupied apartments in Ellport, Pennsylvania
- 01 room
- 02 rooms
- 103 rooms
- 164 rooms
- 135 rooms
- 156 rooms
- 07 rooms
- 08 rooms
- 39+ rooms


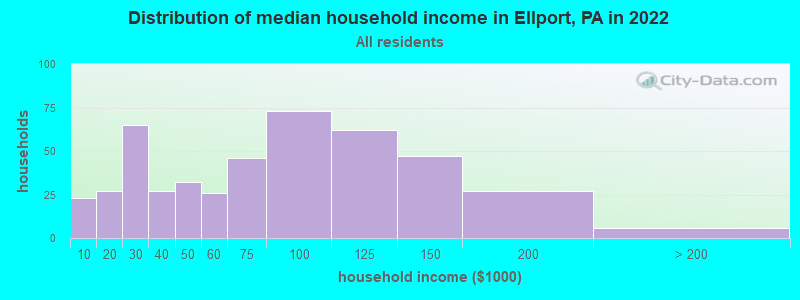
Ellport, PA household income distribution

- 23Less than $10,000
- 27$10,000 to $19,999
- 65$20,000 to $29,999
- 27$30,000 to $39,999
- 32$40,000 to $49,999
- 26$50,000 to $59,999
- 46$60,000 to $74,999
- 73$75,000 to $99,999
- 62$100,000 to $124,999
- 47$125,000 to $149,999
- 27$150,000 to $199,999
- 6$200,000 or more
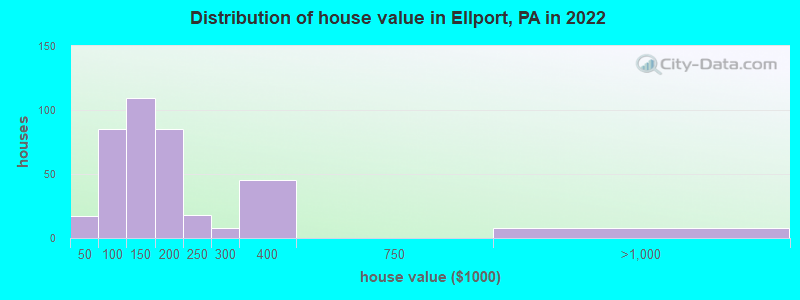
Home value of owner - occupied houses in 2022 in Ellport, PA
-
- 4Less than $10,000
- 3$15,000 to $19,999
- 4$35,000 to $39,999
- 4$40,000 to $49,999
- 5$50,000 to $59,999
- 14$60,000 to $69,999
- 9$70,000 to $79,999
- 33$80,000 to $89,999
- 17$90,000 to $99,999
- 43$100,000 to $124,999
- 65$125,000 to $149,999
- 48$150,000 to $174,999
- 36$175,000 to $199,999
- 17$200,000 to $249,999
- 8$250,000 to $299,999
- 44$300,000 to $399,999
- 8$750,000 to $999,999
Rent paid by renters in 2022 in Ellport, PA
-
- 13$500 to $549
- 2$550 to $599
- 21$600 to $649
- 8$650 to $699
- 12No cash rent


Percentage of workers working in this county: 40.2%
Number of people working at home: 58 (11.7% of all workers)
Travel time to work (commute)
- Less than 5 minutes: 17
- 5 to 9 minutes: 67
- 10 to 14 minutes: 47
- 15 to 19 minutes: 13
- 20 to 24 minutes: 52
- 25 to 29 minutes: 20
- 30 to 34 minutes: 87
- 35 to 39 minutes: 21
- 40 to 44 minutes: 6
- 45 to 59 minutes: 37
- 60 to 89 minutes: 21
- 90 or more minutes: 10
Means of transportation to work:
- Drove a car alone: 405 (89.6%)
- Carpooled: 29 (6.4%)
- Bus or trolley bus: 2 (0.4%)
- Walked: 7 (1.5%)
- Worked at home: 9 (2.0%)

- Unemployment by race in 2022
- Unemployment rate for White non-Hispanic residents
- 2.5%Males
- 3.8%Females

- Year of entry for the foreign-born population in Ellport, Pennsylvania
- 02010 or later
- 02000 to 2009
- 31990 to 1999
- 31980 to 1989
- 01970 to 1979
- 20Before 1970

First ancestries reported:
- German: 139 (27.8%)
- Italian: 129 (25.8%)
- English: 53 (10.6%)
- Hungarian: 20 (4.0%)
- Irish: 18 (3.6%)
- American: 16 (3.2%)
- Scottish: 11 (2.2%)
- Polish: 6 (1.2%)
- European: 5 (1.0%)
- Ukrainian: 3 (0.6%)
- British: 2 (0.4%)
- French: 2 (0.4%)
- Pennsylvania German: 2 (0.4%)
- Romanian: 2 (0.4%)
- Russian: 2 (0.4%)
- Scotch-Irish: 2 (0.4%)
- Slavic: 2 (0.4%)
- Slovak: 2 (0.4%)
- Croatian: 1 (0.2%)
Most common places of birth for foreign-born residents (%):
| Ellport: | 66.7% (2) |
| Pennsylvania: | 1.6% (15,272) |
Place of birth for U.S.-born residents:
- This state: 963
- Other state: 91
- Northeast: 7
- Midwest: 23
- South: 48
- West: 10
95.3% of Ellport residents lived in the same house 1 years ago.
Out of people who lived in different houses, 39.3% lived in this county.
Out of people who lived in different counties, 100.0% lived in Pennsylvania.
| Ellport: | 95.3% |
| State average: | 89.3% |
Education attainment for males 25 years and older:
- No schooling: 0
- Nursery to 4th grade: 0
- 5th and 6th grade: 0
- 7th and 8th grade: 0
- 9th grade: 4
- 10th grade: 3
- 11th grade: 36
- 12th grade, no diploma: 2
- High school graduate (or equivalency): 166
- Less than 1 year of college: 42
- Some college more than 1 year, no degree: 24
- Associate degree: 54
- Bachelor's degree: 28
- Master's degree: 14
- Professional school degree: 7
- Doctorate degree: 6

Education attainment for females 25 years and older:
- No schooling: 0
- Nursery to 4th grade: 0
- 5th and 6th grade: 0
- 7th and 8th grade: 0
- 9th grade: 0
- 10th grade: 5
- 11th grade: 2
- 12th grade, no diploma: 10
- High school graduate (or equivalency): 184
- Less than 1 year of college: 20
- Some college more than 1 year, no degree: 39
- Associate degree: 58
- Bachelor's degree: 86
- Master's degree: 22
- Professional school degree: 0
- Doctorate degree: 0


Housing units in structures:
- One, detached: 451
- One, attached: 4
- Two: 2
- 3 or 4: 1
- 10 to 19: 9
- Mobile homes: 5
Housing units lacking complete kitchen facilities in 2022: 0.6%
House/condo owner moved in on average 20 years ago
Renter moved in on average 11 years ago

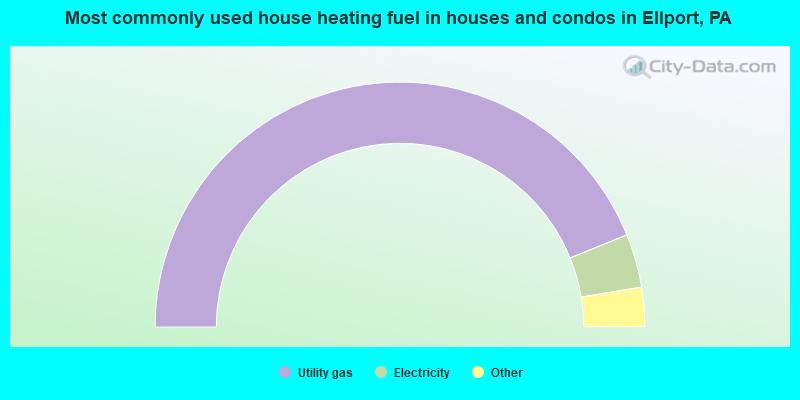
- 88.1%Utility gas
- 7.1%Electricity
- 3.9%Fuel oil, kerosene, etc.
- 1.0%No fuel used
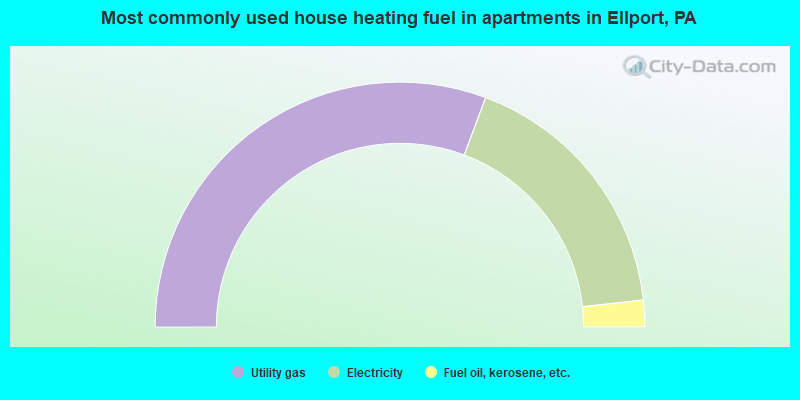
- 61.4%Utility gas
- 35.1%Electricity
- 3.5%Fuel oil, kerosene, etc.
Private vs. public school enrollment:
| Here: | 0.0% |
| Pennsylvania: | 15.7% |
| Here: | 0.0% |
| Pennsylvania: | 13.4% |
| Here: | 10.8% |
| Pennsylvania: | 39.8% |


