Ellwood City, PA (Pennsylvania) Houses and Residents
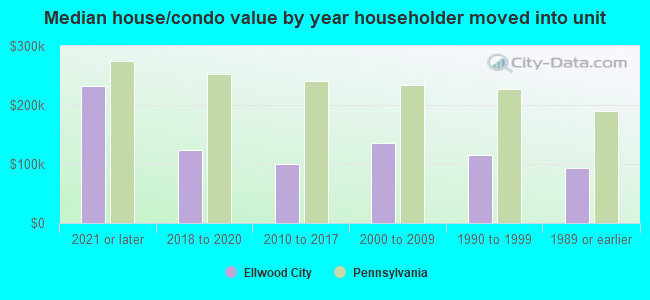
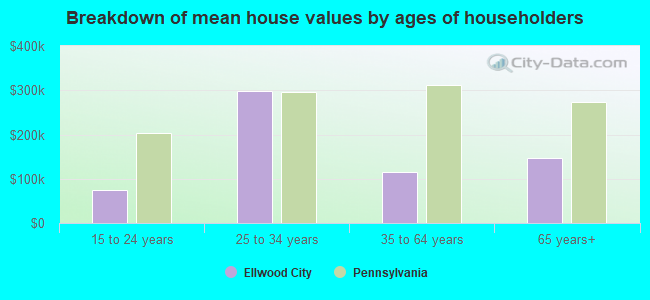
| Ellwood City: | $115,028 |
| Pennsylvania: | $245,500 |
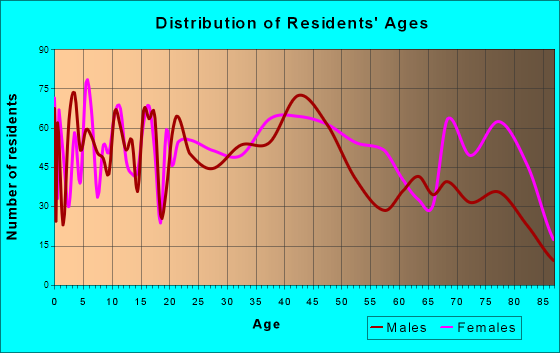
Total population: 7,682 (All urban)
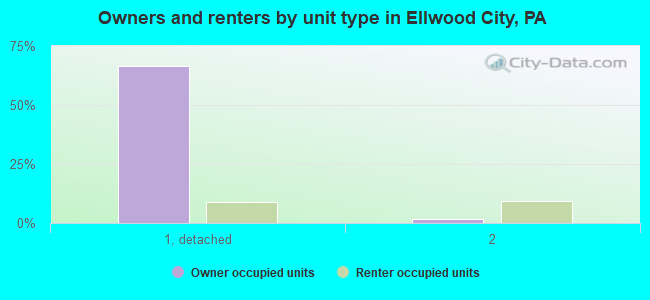
Houses: 4,115 (3,745 occupied: 2,597 owner occupied, 1,126 renter occupied)
| % of renters here: | 30% |
| State: | 31% |
Housing density: 1,760 houses/condos per square mile
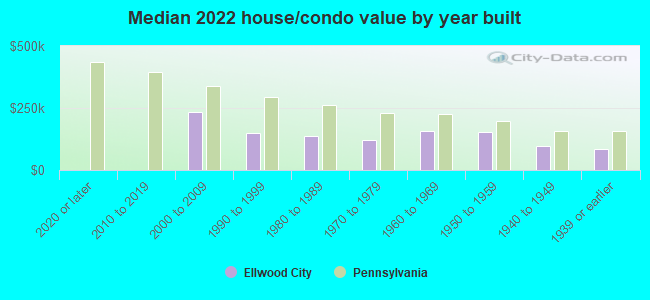
Median price asked for vacant for-sale houses and condos in 2022: $147,467.
Median contract rent in 2022: $611 (lower quartile is $453, upper quartile is $709)
Median rent asked for vacant for-rent units in 2022: $752
Median gross rent in Ellwood City, PA in 2022: $809
Housing units in Ellwood City with a mortgage: 1,469 (134 second mortgage, 0 home equity loan, 136 both second mortgage and home equity loan)
Houses without a mortgage: 90
Median household income for houses/condos with a mortgage: $75,524
Median household income for apartments without a mortgage: $53,484
Median monthly housing costs: $826
Compare current foreclosures near Ellwood City, PA:
| Photo | Address | Area | Beds / Baths | Price | Details |
|---|---|---|---|---|---|

|
#1
Franklin Ave
Ellwood City, PA 16117
|
1,948 sq. feet
|
1 baths 4 beds |
show details | |

|
#2
Sunset Blvd
Ellwood City, PA 16117
|
1,001 sq. feet
|
1 baths 3 beds |
show details | |

|
#3
Duncan Ave
Ellwood City, PA 16117
|
768 sq. feet
|
1 baths 1 beds |
show details | |

|
#4
Franklin Ave
Ellwood City, PA 16117
|
1,948 sq. feet
|
1 baths 3 beds |
show details | |

|
#5
Ellwood Rd
Ellwood City, PA 16117
|
1,232 sq. feet
|
1 baths 3 beds |
show details | |

|
#6
Ridgevue Dr
Ellwood City, PA 16117
|
1,516 sq. feet
|
1 baths 3 beds |
show details | |

|
#7
Mill Bridge Rd
Ellwood City, PA 16117
|
1,654 sq. feet
|
1 baths 3 beds |
show details | |

|
#8
Crescent Ave
Ellwood City, PA 16117
|
1,939 sq. feet
|
2 baths 3 beds |
show details | |

|
#9
Chewton Wurtemburg Rd
Ellwood City, PA 16117
|
1,056 sq. feet
|
1 baths 3 beds |
show details | |

|
#10
Smiley St
Ellwood City, PA 16117
|
2,004 sq. feet
|
1 baths 3 beds |
show details |
| Photo | Address | Area | Beds / Baths | Price | Details |
|---|---|---|---|---|---|

|
#11
Perry St
Ellwood City, PA 16117
|
848 sq. feet
|
1 baths 2 beds |
show details | |

|
#12
Hazel Ave
Ellwood City, PA 16117
|
1,320 sq. feet
|
1 baths 4 beds |
show details | |

|
#13
Todd Ave
Ellwood City, PA 16117
|
1,775 sq. feet
|
1 baths 3 beds |
show details | |

|
#14
Pershing St
Ellwood City, PA 16117
|
5,304 sq. feet
|
2 baths 4 beds |
show details | |

|
#15
Inmetco Dr
Ellwood City, PA 16117
|
- sq. feet
|
- baths - beds |
show details | |

|
#16
Orchard Ave
Ellwood City, PA 16117
|
- sq. feet
|
- baths - beds |
show details | |

|
#17
Crescent Ave Apt 309
Ellwood City, PA 16117
|
- sq. feet
|
- baths - beds |
show details | |

|
#18
Massachusetts St
Ellwood City, PA 16117
|
- sq. feet
|
- baths - beds |
show details | |

|
#19
4th St Apt C
Ellwood City, PA 16117
|
- sq. feet
|
- baths - beds |
show details | |

|
#20
Creston Ave
Ellwood City, PA 16117
|
- sq. feet
|
- baths - beds |
show details |
| Photo | Address | Area | Beds / Baths | Price | Details |
|---|---|---|---|---|---|

|
#21
2nd St # 1
Ellwood City, PA 16117
|
- sq. feet
|
- baths - beds |
show details | |

|
#22
Lawrence Ave # 2
Ellwood City, PA 16117
|
- sq. feet
|
- baths - beds |
show details | |

|
#23
Darlington Rd
Wampum, PA 16157
|
1,212 sq. feet
|
2 baths 3 beds |
$194,500
|
show details |

|
#24
Main St
New Middletown, OH 44442
|
1,144 sq. feet
|
1 baths 3 beds |
$189,900
|
show details |

|
#25
Ryan Ave
New Castle, PA 16101
|
864 sq. feet
|
1 baths 3 beds |
$34,900
|
show details |

|
#26
16th Ave
Beaver Falls, PA 15010
|
817 sq. feet
|
1 baths 2 beds |
show details | |

|
#27
18th St
Beaver Falls, PA 15010
|
920 sq. feet
|
1 baths 3 beds |
show details | |

|
#28
Beaver Dam Rd
New Galilee, PA 16141
|
1,088 sq. feet
|
1 baths 3 beds |
show details | |

|
#29
Sunset Boulavard
Aliquippa, PA 15001
|
- sq. feet
|
1 baths 3 beds |
show details | |

|
#30
Main Ave
New Brighton, PA 15066
|
1,796 sq. feet
|
1 baths 2 beds |
show details |
| Photo | Address | Area | Beds / Baths | Price | Details |
|---|---|---|---|---|---|

|
#31
Midland Beaver Rd
Industry, PA 15052
|
- sq. feet
|
1 baths 2 beds |
show details | |

|
#32
41st Ave
New Brighton, PA 15066
|
1,060 sq. feet
|
1 baths 3 beds |
show details | |

|
#33
Erie St
Edinburg, PA 16116
|
1,114 sq. feet
|
1 baths 3 beds |
show details | |

|
#34
5th Ave
Freedom, PA 15042
|
1,456 sq. feet
|
1 baths 3 beds |
show details | |

|
#35
Church St
Prospect, PA 16052
|
1,560 sq. feet
|
1 baths 3 beds |
show details | |

|
#36
3rd Ave
New Brighton, PA 15066
|
1,774 sq. feet
|
1 baths 3 beds |
show details | |

|
#37
32nd Ave
New Brighton, PA 15066
|
1,608 sq. feet
|
1 baths 3 beds |
show details | |

|
#38
Cherokee Dr
Beaver Falls, PA 15010
|
- sq. feet
|
2 baths 3 beds |
show details | |

|
#39
Neshannock Blvd
New Castle, PA 16101
|
1,440 sq. feet
|
2 baths 3 beds |
show details | |

|
#40
4th Avenue
Koppel, PA 16136
|
672 sq. feet
|
2 baths 2 beds |
show details |
| Photo | Address | Area | Beds / Baths | Price | Details |
|---|---|---|---|---|---|

|
#41
Falls Ave
New Castle, PA 16105
|
1,860 sq. feet
|
2 baths 4 beds |
show details | |

|
#42
Washington St
Aliquippa, PA 15001
|
1,800 sq. feet
|
1 baths 3 beds |
show details | |

|
#43
Park St
Rochester, PA 15074
|
1,360 sq. feet
|
1 baths 3 beds |
show details | |

|
#44
E Maitland Ln
New Castle, PA 16105
|
1,482 sq. feet
|
2 baths 3 beds |
show details | |

|
#45
Chestnut St
New Castle, PA 16101
|
1,232 sq. feet
|
1 baths 2 beds |
show details | |

|
#46
Williams Ave
Rochester, PA 15074
|
- sq. feet
|
2 baths 3 beds |
show details | |

|
#47
Webster St
Rochester, PA 15074
|
1,120 sq. feet
|
2 baths 3 beds |
show details | |

|
#48
State St
Baden, PA 15005
|
1,011 sq. feet
|
1 baths 2 beds |
show details | |

|
#49
Pollock Ave
New Castle, PA 16101
|
1,792 sq. feet
|
1 baths 3 beds |
show details | |

|
Check over 1 million property listings on Foreclosure.com!
|
browse all offers | |||


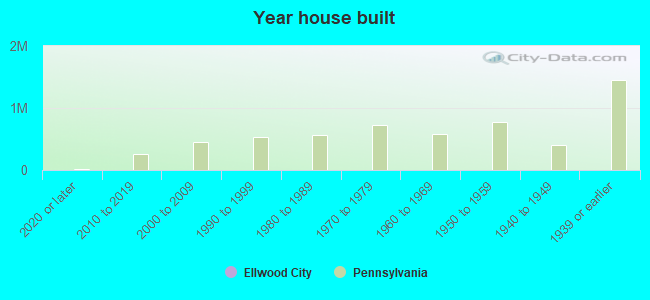
Median year apartment built: 1955
Household type by relationship:
Households: 7,589- Male householders: 1,850 (669 living alone), Female householders: 1,851 (688 living alone)
1,422 spouses (1,406 opposite-sex spouses), 205 unmarried partners, (205 opposite-sex unmarried partners), 1,813 children (1,760 natural, 28 adopted, 24 stepchildren), 141 grandchildren, 43 brothers or sisters, 22 parents, 0 foster children, 20 other relatives, 173 non-relatives
- In group quarters: 43
Size of family households: 1,256 2-persons, 488 3-persons, 339 4-persons, 33 5-persons, 23 6-persons.
Size of nonfamily households: 1,445 1-person, 98 2-persons, 36 4-persons.
503 married couples with children.
640 single-parent households (168 men, 472 women).
97.1% of residents of Ellwood City speak English at home.
1.5% of residents speak Spanish at home (100% speak English very well).
1.0% of residents speak other Indo-European language at home (43% speak English very well, 43% speak English well, 14% speak English not well).
Foreign born population: 48 (0.6%)
(133.3% of them are naturalized citizens)
| Here: | 6.2 |
| State: | 6.8 |
| Here: | 4.1 |
| State: | 4.3 |

- Bedrooms in owner-occupied houses and condos in Ellwood City, Pennsylvania
- 0no bedroom
- 1131 bedroom
- 6472 bedrooms
- 1,5423 bedrooms
- 2794 bedrooms
- 175+ bedrooms
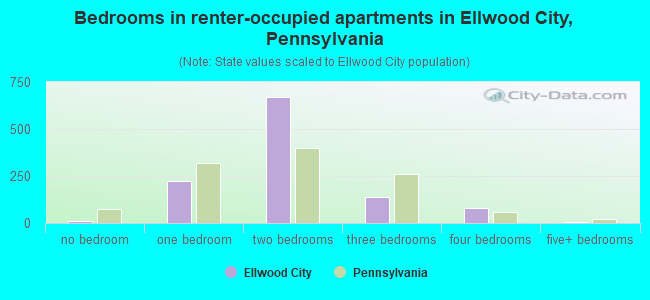
- Bedrooms in renter-occupied apartments in Ellwood City, Pennsylvania
- 11no bedroom
- 2231 bedroom
- 6692 bedrooms
- 1373 bedrooms
- 804 bedrooms
- 75+ bedrooms
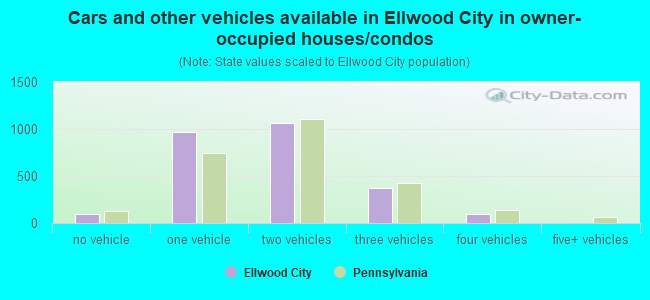
- Cars and other vehicles available in Ellwood City in owner-occupied houses/condos
- 91no vehicle
- 9691 vehicle
- 1,0652 vehicles
- 3713 vehicles
- 984 vehicles
- 45+ vehicles
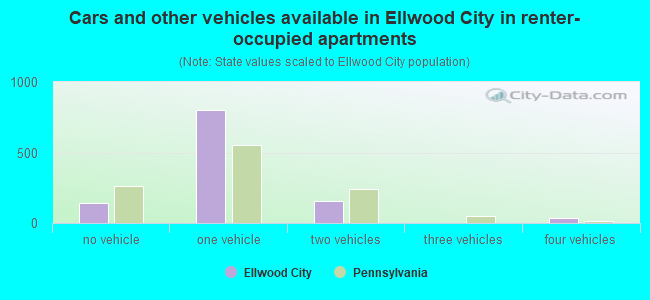
- Cars and other vehicles available in Ellwood City in renter-occupied apartments
- 141no vehicle
- 8001 vehicle
- 1542 vehicles
- 03 vehicles
- 324 vehicles
- 05+ vehicles
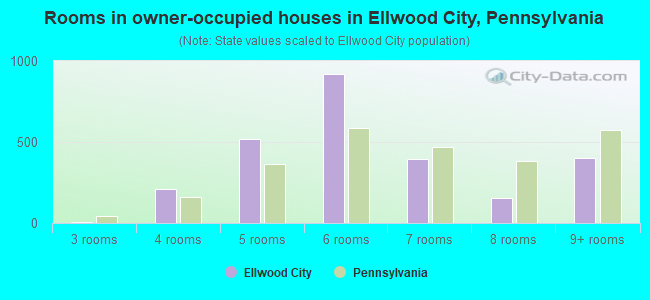
- Rooms in owner-occupied houses in Ellwood City, Pennsylvania
- 01 room
- 02 rooms
- 73 rooms
- 2084 rooms
- 5175 rooms
- 9176 rooms
- 3967 rooms
- 1528 rooms
- 4019+ rooms
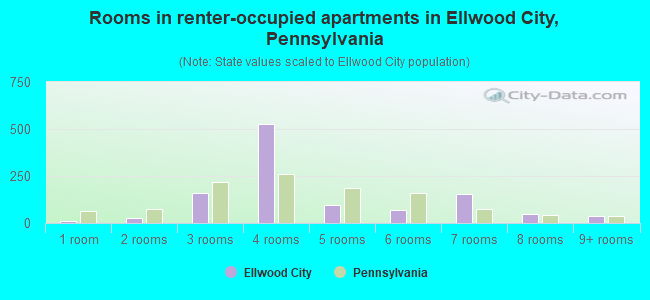
- Rooms in renter-occupied apartments in Ellwood City, Pennsylvania
- 111 room
- 292 rooms
- 1583 rooms
- 5254 rooms
- 955 rooms
- 706 rooms
- 1527 rooms
- 488 rooms
- 399+ rooms
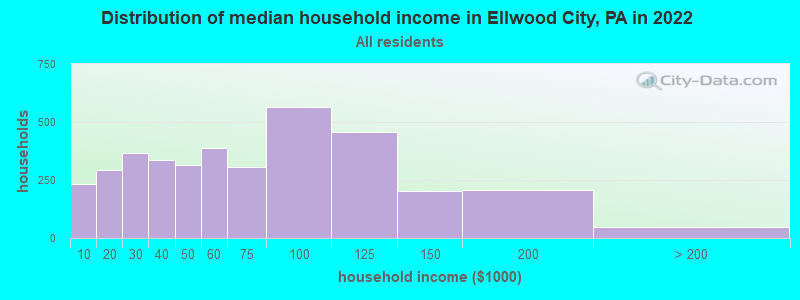
Ellwood City, PA household income distribution

- 234Less than $10,000
- 295$10,000 to $19,999
- 368$20,000 to $29,999
- 336$30,000 to $39,999
- 314$40,000 to $49,999
- 388$50,000 to $59,999
- 304$60,000 to $74,999
- 565$75,000 to $99,999
- 458$100,000 to $124,999
- 203$125,000 to $149,999
- 209$150,000 to $199,999
- 49$200,000 or more
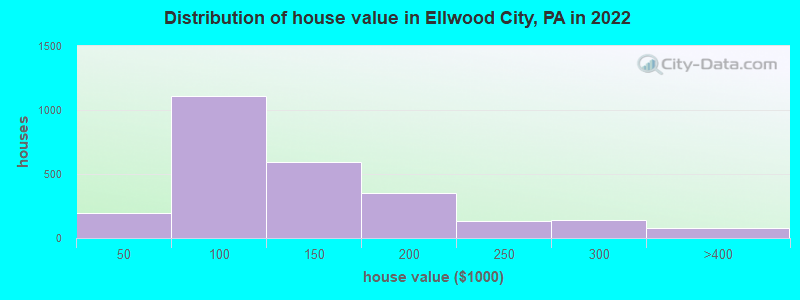
Home value of owner - occupied houses in 2022 in Ellwood City, PA
-
- 56Less than $10,000
- 6$10,000 to $14,999
- 54$35,000 to $39,999
- 80$40,000 to $49,999
- 137$50,000 to $59,999
- 354$60,000 to $69,999
- 113$70,000 to $79,999
- 302$80,000 to $89,999
- 121$90,000 to $99,999
- 254$100,000 to $124,999
- 339$125,000 to $149,999
- 216$150,000 to $174,999
- 136$175,000 to $199,999
- 131$200,000 to $249,999
- 137$250,000 to $299,999
- 80$300,000 to $399,999
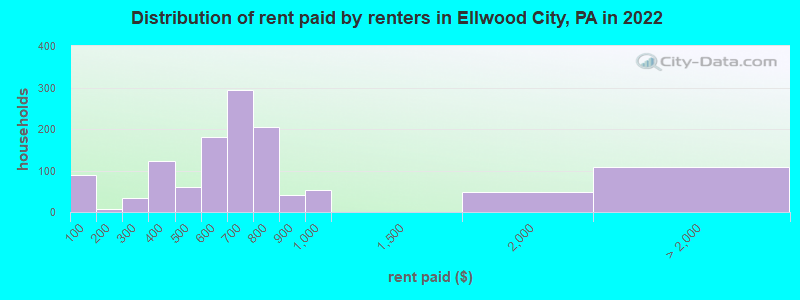
Rent paid by renters in 2022 in Ellwood City, PA
-
- 88Less than $100
- 8$150 to $199
- 34$250 to $299
- 54$300 to $349
- 68$350 to $399
- 11$400 to $449
- 48$450 to $499
- 138$500 to $549
- 41$550 to $599
- 277$600 to $649
- 17$650 to $699
- 134$700 to $749
- 71$750 to $799
- 42$800 to $899
- 51$900 to $999
- 47$1,500 to $1,999
- 108No cash rent
Percentage of workers working in this county: 43.2%
Number of people working at home: 418 (10.0% of all workers)
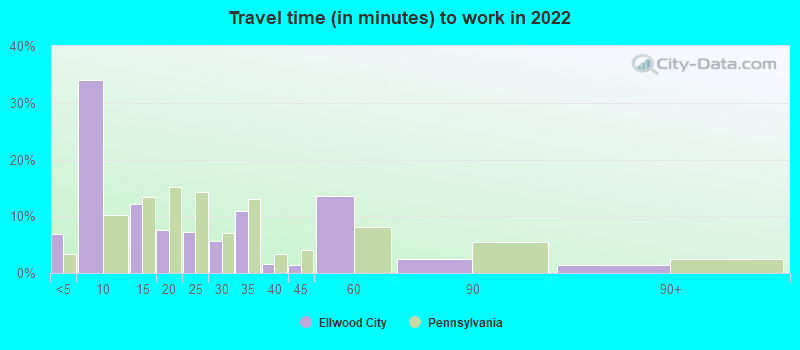
Travel time to work (commute)
- Less than 5 minutes: 182
- 5 to 9 minutes: 625
- 10 to 14 minutes: 382
- 15 to 19 minutes: 376
- 20 to 24 minutes: 503
- 25 to 29 minutes: 226
- 30 to 34 minutes: 304
- 35 to 39 minutes: 57
- 40 to 44 minutes: 256
- 45 to 59 minutes: 296
- 60 to 89 minutes: 220
- 90 or more minutes: 54
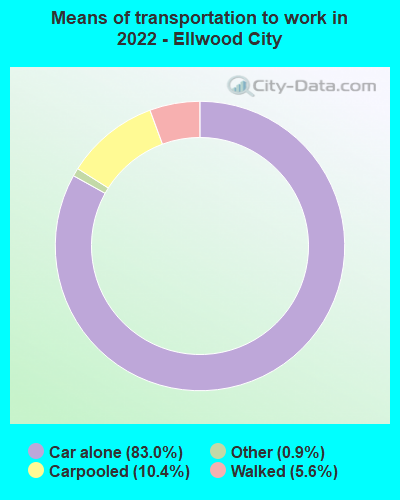
Means of transportation to work:
- Drove a car alone: 2,120 (71.5%)
- Carpooled: 264 (8.9%)
- Taxi: 27 (0.9%)
- Walked: 144 (4.9%)
- Worked at home: 418 (14.1%)
- Unemployment by race in 2022
- Unemployment rate for White non-Hispanic residents
- 8.9%Males
- 2.5%Females
- Unemployment rate for two or more race residents
- 19.3%Males
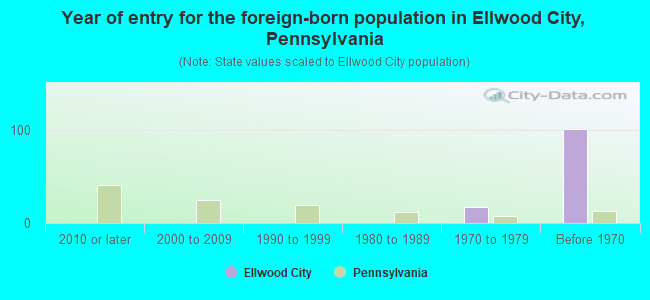
- Year of entry for the foreign-born population in Ellwood City, Pennsylvania
- 02010 or later
- 02000 to 2009
- 01990 to 1999
- 01980 to 1989
- 171970 to 1979
- 101Before 1970
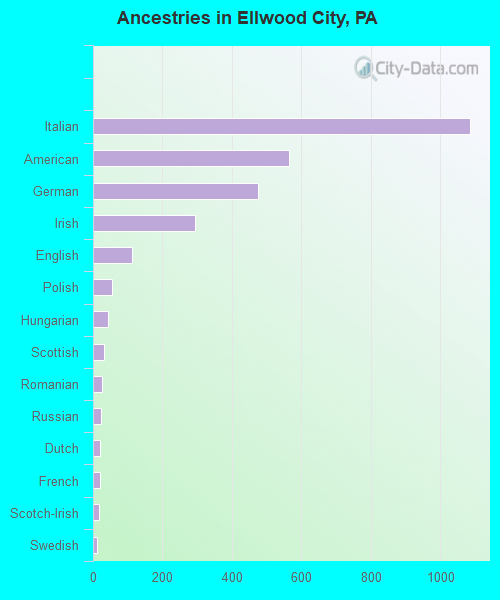
First ancestries reported:
- Italian: 1,086 (34.1%)
- American: 565 (17.7%)
- German: 476 (14.9%)
- Irish: 294 (9.2%)
- English: 113 (3.5%)
- Polish: 55 (1.7%)
- Hungarian: 44 (1.4%)
- Scottish: 31 (1.0%)
- Romanian: 27 (0.8%)
- Russian: 23 (0.7%)
- Dutch: 19 (0.6%)
- French: 19 (0.6%)
- Scotch-Irish: 18 (0.6%)
- Swedish: 12 (0.4%)
- Ukrainian: 9 (0.3%)
- Croatian: 8 (0.3%)
- European: 7 (0.2%)
- French Canadian: 7 (0.2%)
- Czechoslovakian: 3 (0.09%)
Most common places of birth for foreign-born residents (%):
| Ellwood City: | 54.2% (32) |
| Pennsylvania: | 0.1% (1,152) |
| Ellwood City: | 16.9% (10) |
| Pennsylvania: | 1.3% (12,172) |
| Ellwood City: | 15.3% (9) |
| Pennsylvania: | 1.9% (18,065) |
Place of birth for U.S.-born residents:
- This state: 6,682
- Other state: 689
- Northeast: 45
- Midwest: 219
- South: 352
- West: 77
87.9% of Ellwood City residents lived in the same house 1 years ago.
Out of people who lived in different houses, 33.8% lived in this county.
Out of people who lived in different counties, 34.5% lived in Pennsylvania.
| Ellwood City: | 87.9% |
| State average: | 89.3% |
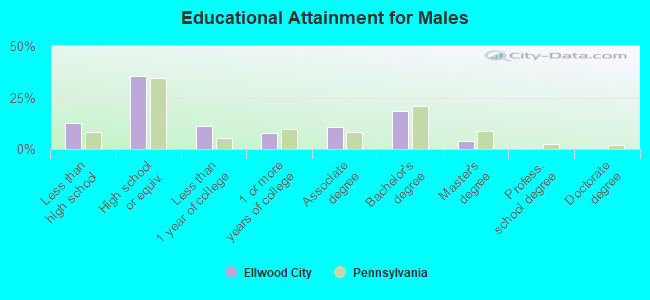
Education attainment for males 25 years and older:
- No schooling: 0
- Nursery to 4th grade: 0
- 5th and 6th grade: 0
- 7th and 8th grade: 80
- 9th grade: 12
- 10th grade: 21
- 11th grade: 214
- 12th grade, no diploma: 15
- High school graduate (or equivalency): 959
- Less than 1 year of college: 303
- Some college more than 1 year, no degree: 215
- Associate degree: 288
- Bachelor's degree: 499
- Master's degree: 107
- Professional school degree: 3
- Doctorate degree: 0
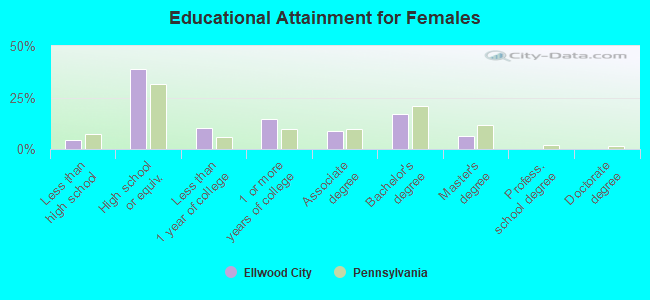
Education attainment for females 25 years and older:
- No schooling: 0
- Nursery to 4th grade: 4
- 5th and 6th grade: 0
- 7th and 8th grade: 7
- 9th grade: 0
- 10th grade: 10
- 11th grade: 69
- 12th grade, no diploma: 35
- High school graduate (or equivalency): 1,131
- Less than 1 year of college: 291
- Some college more than 1 year, no degree: 430
- Associate degree: 250
- Bachelor's degree: 493
- Master's degree: 190
- Professional school degree: 0
- Doctorate degree: 4
Housing units in structures:
- One, detached: 3,082
- One, attached: 204
- Two: 320
- 3 or 4: 201
- 5 to 9: 144
- 50 or more: 150
- Mobile homes: 9
Housing units lacking complete kitchen facilities in 2022: 2.8%
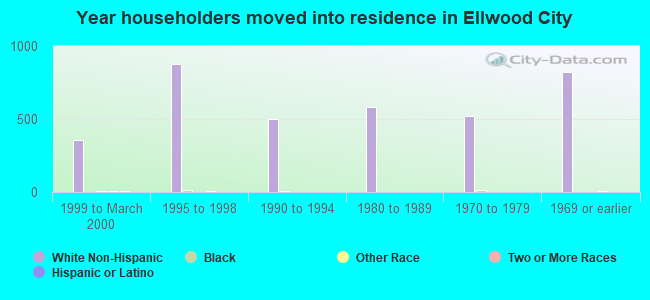
House/condo owner moved in on average 16 years ago
Renter moved in on average 2 years ago
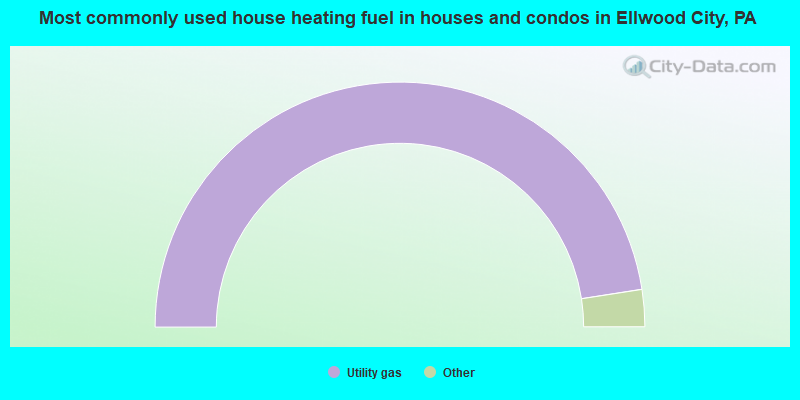
- 95.1%Utility gas
- 2.0%Bottled, tank, or LP gas
- 1.4%Electricity
- 0.7%Coal or coke
- 0.5%No fuel used
- 0.4%Other fuel
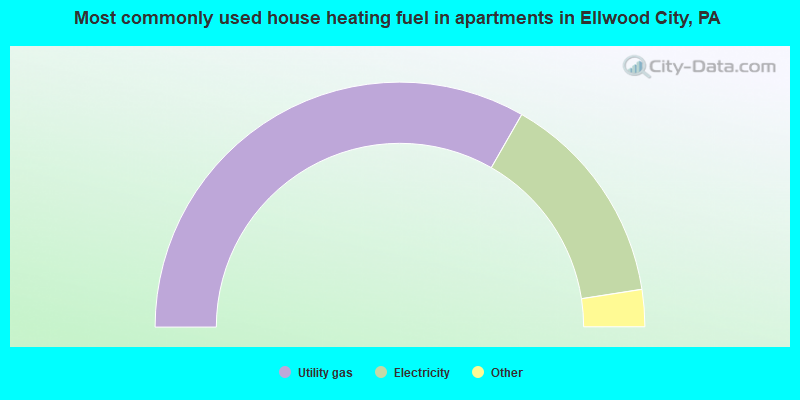
- 66.7%Utility gas
- 28.6%Electricity
- 3.2%Other fuel
- 1.6%Bottled, tank, or LP gas
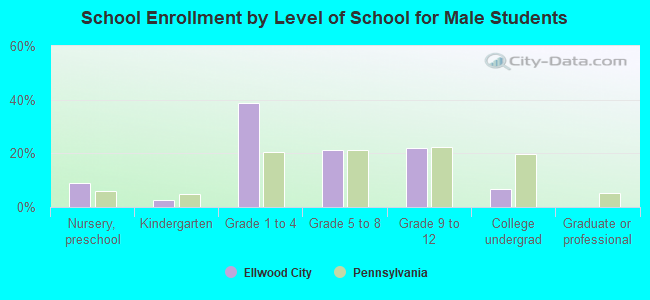
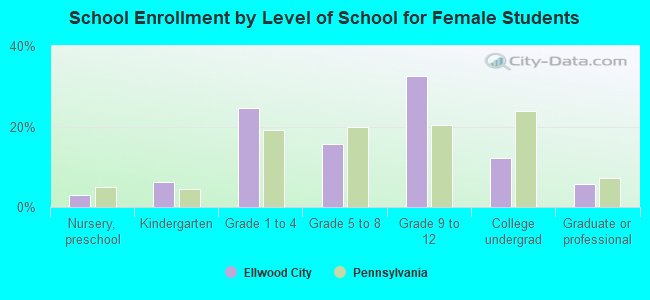
Private vs. public school enrollment:
| Here: | 6.0% |
| Pennsylvania: | 15.7% |
| Here: | 0.0% |
| Pennsylvania: | 13.4% |
| Here: | 40.6% |
| Pennsylvania: | 39.8% |