Elma, WA (Washington) Houses and Residents
| Elma: | $374,096 |
| Washington: | $569,500 |
Mean price in 2022:
Detached houses: $309,114
Here: $309,114 State: $734,307 Mobile homes: $235,463
Here: $235,463 State: $218,362
Total population: 3,018 (Urban population: 2,903 (all inside urban clusters), Rural population: 52 (all nonfarm))
Houses: 1,413 (1,288 occupied: 848 owner occupied, 477 renter occupied)
| % of renters here: | 36% |
| State: | 36% |
Housing density: 840 houses/condos per square mile
Median price asked for vacant for-sale houses and condos in 2022 in this county: $220,515.
Median contract rent in 2022: $834 (lower quartile is $631, upper quartile is $932)
Median rent asked for vacant for-rent units in 2022: $874
Median gross rent in Elma, WA in 2022: $931
Housing units in Elma with a mortgage: 439 (63 second mortgage, 0 home equity loan, 43 both second mortgage and home equity loan)
Houses without a mortgage: 0
Median household income for houses/condos with a mortgage: $88,681
Median household income for apartments without a mortgage: $84,251
Median monthly housing costs: $923
Compare current foreclosures near Elma, WA:
| Photo | Address | Area | Beds / Baths | Price | Details |
|---|---|---|---|---|---|

|
#1
Monte Elma Rd
Elma, WA 98541
|
- sq. feet
|
3 baths 4 beds |
show details | |

|
#2
N 12th St
Elma, WA 98541
|
- sq. feet
|
2 baths 3 beds |
show details | |

|
#3
W Star Lake Dr
Elma, WA 98541
|
960 sq. feet
|
2 baths 2 beds |
show details | |

|
#4
W Main St
Elma, WA 98541
|
- sq. feet
|
1 baths 2 beds |
show details | |

|
#5
Oakhurst Dr
Elma, WA 98541
|
- sq. feet
|
2 baths 3 beds |
show details | |

|
#6
W Martin St
Elma, WA 98541
|
- sq. feet
|
- baths - beds |
show details | |

|
#7
Monte Elma Rd
Elma, WA 98541
|
- sq. feet
|
- baths - beds |
show details | |

|
#8
Williams Creek Rd
Oakville, WA 98568
|
1,920 sq. feet
|
2 baths 4 beds |
show details | |

|
#9
W Oak Meadows Rd
Mccleary, WA 98557
|
1,620 sq. feet
|
2 baths 3 beds |
show details | |

|
#10
Summit Lake Shore Rd N 1
Olympia, WA 98502
|
822 sq. feet
|
1 baths 1 beds |
show details |
| Photo | Address | Area | Beds / Baths | Price | Details |
|---|---|---|---|---|---|

|
#11
W Loertscher Rd
Shelton, WA 98584
|
1,404 sq. feet
|
2 baths 3 beds |
show details | |

|
#12
Summit Lake Rd NW
Olympia, WA 98502
|
1,232 sq. feet
|
- baths - beds |
show details | |

|
#13
Summit Lake Shore Rd NW
Olympia, WA 98502
|
- sq. feet
|
- baths - beds |
show details | |

|
#14
E Pioneer Ave
Montesano, WA 98563
|
- sq. feet
|
- baths - beds |
show details | |

|
#15
N Summit Rd
Mccleary, WA 98557
|
- sq. feet
|
- baths - beds |
show details | |

|
#16
Summit Lake Shore Rd NW
Olympia, WA 98502
|
- sq. feet
|
- baths - beds |
show details | |

|
#17
W Eagle St
Oakville, WA 98568
|
- sq. feet
|
- baths - beds |
show details | |

|
#18
Camp Creek Rd
Montesano, WA 98563
|
- sq. feet
|
- baths - beds |
show details | |

|
#19
E Elma Ave
Montesano, WA 98563
|
- sq. feet
|
- baths - beds |
show details | |

|
#20
Solki Rd
Aberdeen, WA 98520
|
- sq. feet
|
- baths - beds |
show details |
| Photo | Address | Area | Beds / Baths | Price | Details |
|---|---|---|---|---|---|

|
#21
W Oak St
Mccleary, WA 98557
|
- sq. feet
|
- baths - beds |
show details | |

|
#22
Central Park Dr
Aberdeen, WA 98520
|
- sq. feet
|
- baths - beds |
show details | |

|
#23
River Rd
Aberdeen, WA 98520
|
- sq. feet
|
- baths - beds |
show details | |

|
#24
Blaine Rd
Aberdeen, WA 98520
|
- sq. feet
|
- baths - beds |
show details | |

|
#25
Wynooche Valley Rd
Montesano, WA 98563
|
- sq. feet
|
- baths - beds |
show details | |

|
#26
S 6th St
Mccleary, WA 98557
|
- sq. feet
|
- baths - beds |
show details | |

|
#27
S 10th St
Montesano, WA 98563
|
- sq. feet
|
- baths - beds |
show details | |

|
#28
S 10th St
Montesano, WA 98563
|
- sq. feet
|
- baths - beds |
show details | |

|
#29
W Broadway Ave
Montesano, WA 98563
|
- sq. feet
|
- baths - beds |
show details | |

|
Check over 1 million property listings on Foreclosure.com!
|
browse all offers | |||

Latest news about housing in Elma, WA collected exclusively by city-data.com from local newspapers, TV, and radio stations

 | Ocean Shores, WA Real Estate (66 replies) |
| Affordable housing in Western WA? (54 replies) |
| Real Estate Prices are Unaffordable for Senior Citizen (41 replies) |
| Affordable homes? (27 replies) |
| Disabled, Camping on the Olympic Peninsula, and Housing. (47 replies) |
| Coastal living in western WA? Aberdeen? (50 replies) |

Median year apartment built: 1965
Household type by relationship:
Households: 3,487- Male householders: 680 (212 living alone), Female householders: 606 (232 living alone)
615 spouses (615 opposite-sex spouses), 70 unmarried partners, (70 opposite-sex unmarried partners), 957 children (936 natural, 0 adopted, 21 stepchildren), 200 grandchildren, 31 brothers or sisters, 52 parents, 0 foster children, 46 other relatives, 151 non-relatives
- In group quarters: 73
Size of family households: 385 2-persons, 100 3-persons, 77 4-persons, 35 5-persons, 41 6-persons, 85 7-or-more-persons.
Size of nonfamily households: 498 1-person, 54 2-persons.
437 married couples with children.
106 single-parent households (26 men, 80 women).
88.5% of residents of Elma speak English at home.
10.2% of residents speak Spanish at home (68% speak English very well, 2% speak English well, 30% speak English not well).
0.6% of residents speak other Indo-European language at home (100% speak English very well).
Foreign born population: 138 (4.0%)
(63.8% of them are naturalized citizens)
| Here: | 6.4 |
| State: | 6.5 |
| Here: | 4.1 |
| State: | 3.9 |

- Bedrooms in owner-occupied houses and condos in Elma, Washington
- 0no bedroom
- 611 bedroom
- 1582 bedrooms
- 3853 bedrooms
- 1594 bedrooms
- 855+ bedrooms

- Bedrooms in renter-occupied apartments in Elma, Washington
- 0no bedroom
- 561 bedroom
- 3602 bedrooms
- 623 bedrooms
- 04 bedrooms
- 05+ bedrooms

- Cars and other vehicles available in Elma in owner-occupied houses/condos
- 13no vehicle
- 2291 vehicle
- 3892 vehicles
- 693 vehicles
- 1144 vehicles
- 355+ vehicles

- Cars and other vehicles available in Elma in renter-occupied apartments
- 56no vehicle
- 3331 vehicle
- 892 vehicles
- 03 vehicles
- 04 vehicles
- 05+ vehicles

- Rooms in owner-occupied houses in Elma, Washington
- 01 room
- 142 rooms
- 343 rooms
- 494 rooms
- 765 rooms
- 2946 rooms
- 1157 rooms
- 1188 rooms
- 1509+ rooms

- Rooms in renter-occupied apartments in Elma, Washington
- 01 room
- 02 rooms
- 333 rooms
- 2444 rooms
- 1265 rooms
- 136 rooms
- 137 rooms
- 08 rooms
- 499+ rooms


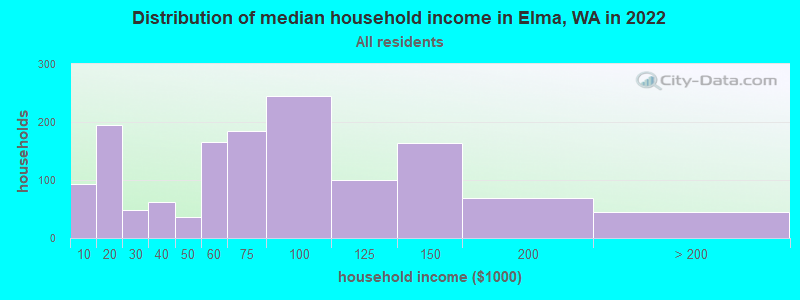
Elma, WA household income distribution

- 93Less than $10,000
- 194$10,000 to $19,999
- 49$20,000 to $29,999
- 62$30,000 to $39,999
- 37$40,000 to $49,999
- 165$50,000 to $59,999
- 185$60,000 to $74,999
- 245$75,000 to $99,999
- 100$100,000 to $124,999
- 164$125,000 to $149,999
- 69$150,000 to $199,999
- 45$200,000 or more
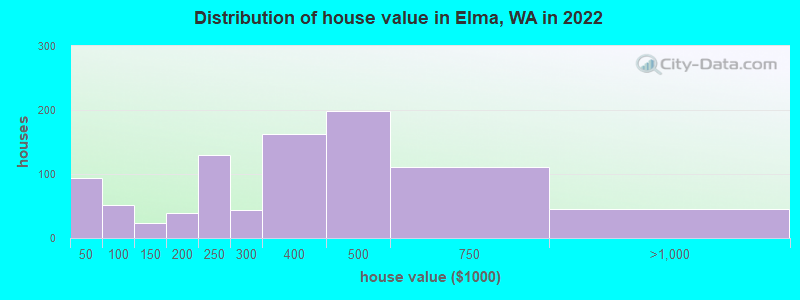
Home value of owner - occupied houses in 2022 in Elma, WA
-
- 93$15,000 to $19,999
- 30$70,000 to $79,999
- 22$90,000 to $99,999
- 22$125,000 to $149,999
- 15$150,000 to $174,999
- 23$175,000 to $199,999
- 130$200,000 to $249,999
- 43$250,000 to $299,999
- 163$300,000 to $399,999
- 197$400,000 to $499,999
- 111$500,000 to $749,999
- 45$750,000 to $999,999
Rent paid by renters in 2022 in Elma, WA
-
- 109$100 to $149
- 26$600 to $649
- 29$700 to $749
- 49$750 to $799
- 110$800 to $899
- 13$900 to $999
- 36$1,000 to $1,249
- 20$1,250 to $1,499
- 11$2,000 to $2,499
- 7No cash rent


Percentage of workers working in this county: 71.9%
Number of people working at home: 183 (12.7% of all workers)
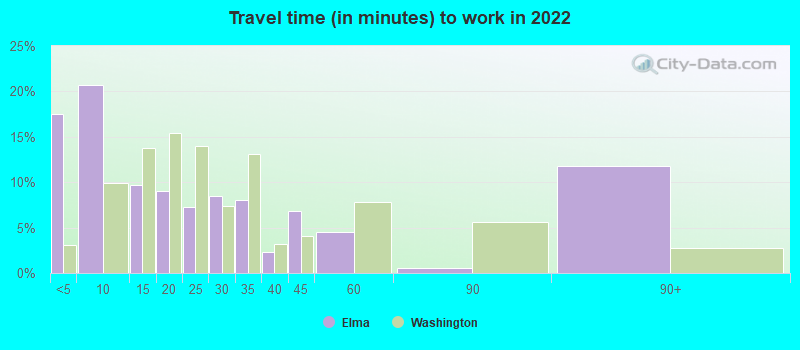
Travel time to work (commute)
- Less than 5 minutes: 359
- 5 to 9 minutes: 62
- 10 to 14 minutes: 185
- 15 to 19 minutes: 83
- 20 to 24 minutes: 147
- 25 to 29 minutes: 9
- 30 to 34 minutes: 197
- 35 to 39 minutes: 61
- 40 to 44 minutes: 60
- 45 to 59 minutes: 59
- 60 to 89 minutes: 157
- 90 or more minutes: 0
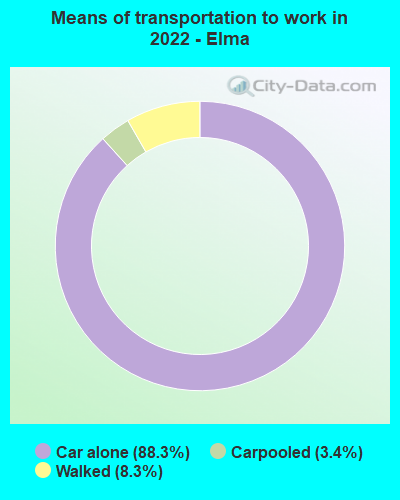
Means of transportation to work:
- Drove a car alone: 1,679 (78.6%)
- Carpooled: 66 (3.1%)
- Walked: 160 (7.5%)
- Worked at home: 183 (8.6%)

- Unemployment by race in 2022
- Unemployment rate for White non-Hispanic residents
- 6.9%Males
- 4.0%Females
- Unemployment rate for Hispanic or Latino residents
- 2.7%Males

- Year of entry for the foreign-born population in Elma, Washington
- 02010 or later
- 412000 to 2009
- 631990 to 1999
- 51980 to 1989
- 191970 to 1979
- 15Before 1970

First ancestries reported:
- Irish: 525 (23.5%)
- German: 244 (10.9%)
- English: 191 (8.6%)
- Polish: 168 (7.5%)
- Norwegian: 117 (5.2%)
- Swedish: 88 (3.9%)
- Croatian: 73 (3.3%)
- Scotch-Irish: 52 (2.3%)
- Portuguese: 37 (1.7%)
- European: 27 (1.2%)
- American: 18 (0.8%)
Most common places of birth for foreign-born residents (%):
| Elma: | 88.9% (104) |
| Washington: | 21.1% (241,655) |
| Elma: | 5.1% (6) |
| Washington: | 6.3% (71,661) |
| Elma: | 3.4% (4) |
| Washington: | 1.2% (13,745) |
Place of birth for U.S.-born residents:
- This state: 2,507
- Other state: 835
- Northeast: 31
- Midwest: 224
- South: 124
- West: 448
88.6% of Elma residents lived in the same house 1 years ago.
Out of people who lived in different houses, 29.8% lived in this county.
Out of people who lived in different counties, 86.7% lived in Washington.
| Elma: | 88.6% |
| State average: | 85.2% |
Education attainment for males 25 years and older:
- No schooling: 63
- Nursery to 4th grade: 0
- 5th and 6th grade: 29
- 7th and 8th grade: 0
- 9th grade: 203
- 10th grade: 0
- 11th grade: 58
- 12th grade, no diploma: 16
- High school graduate (or equivalency): 420
- Less than 1 year of college: 73
- Some college more than 1 year, no degree: 169
- Associate degree: 32
- Bachelor's degree: 144
- Master's degree: 11
- Professional school degree: 0
- Doctorate degree: 15

Education attainment for females 25 years and older:
- No schooling: 0
- Nursery to 4th grade: 0
- 5th and 6th grade: 78
- 7th and 8th grade: 0
- 9th grade: 0
- 10th grade: 36
- 11th grade: 4
- 12th grade, no diploma: 0
- High school graduate (or equivalency): 342
- Less than 1 year of college: 100
- Some college more than 1 year, no degree: 214
- Associate degree: 80
- Bachelor's degree: 296
- Master's degree: 45
- Professional school degree: 0
- Doctorate degree: 0


Housing units in structures:
- One, detached: 861
- One, attached: 39
- Two: 60
- 3 or 4: 67
- 5 to 9: 97
- 10 to 19: 57
- 20 to 49: 95
- Mobile homes: 112
- Boats, RVs, vans, etc.: 21
Housing units lacking complete kitchen facilities in 2022: 0.8%
House/condo owner moved in on average 15 years ago
Renter moved in on average 5 years ago

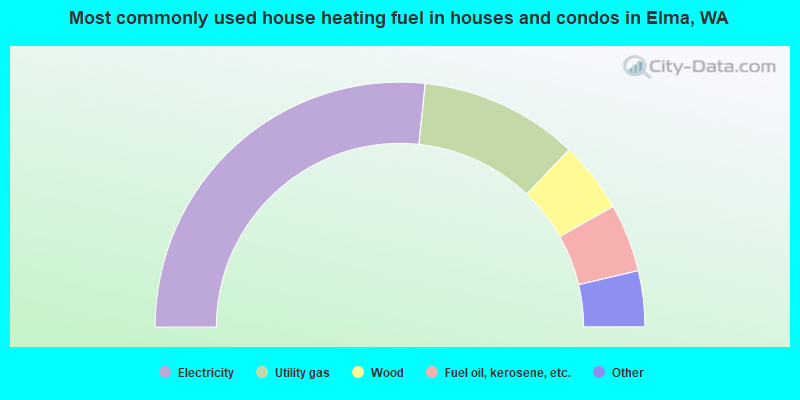
- 53.4%Electricity
- 21.0%Utility gas
- 9.4%Wood
- 9.0%Fuel oil, kerosene, etc.
- 3.6%Other fuel
- 2.6%Bottled, tank, or LP gas
- 1.0%No fuel used
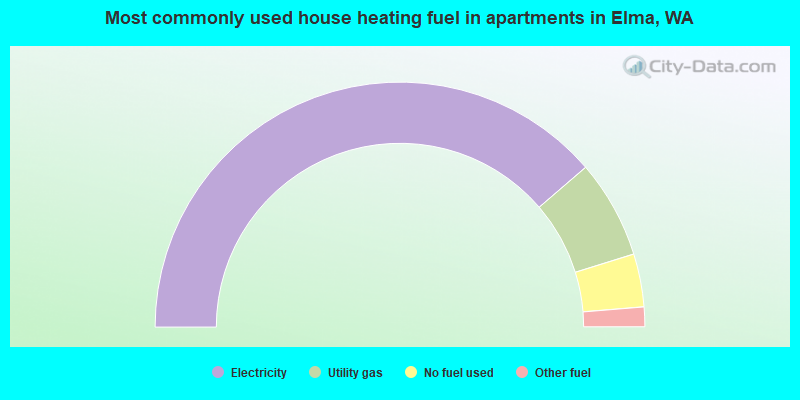
- 77.4%Electricity
- 13.0%Utility gas
- 7.0%No fuel used
- 2.6%Other fuel
Private vs. public school enrollment:
| Here: | 0.0% |
| Washington: | 12.4% |
| Here: | 0.0% |
| Washington: | 9.2% |
| Here: | 0.0% |
| Washington: | 16.5% |


