Elmira, NY (New York) Houses and Residents
| Elmira: | $87,269 |
| New York: | $400,400 |
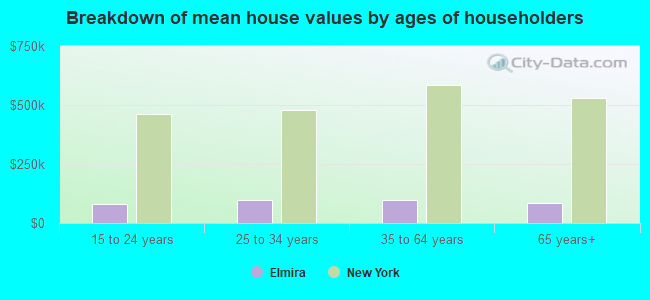
Mean price in 2022:
Detached houses: $115,068
Here: $115,068 State: $476,719 Townhouses or other attached units: $250,386
Here: $250,386 State: $699,270 In 2-unit structures: $92,810
Here: $92,810 State: $713,077 In 3-to-4-unit structures: $91,466
Here: $91,466 State: $764,568
Total population: 28,647 (All urban)
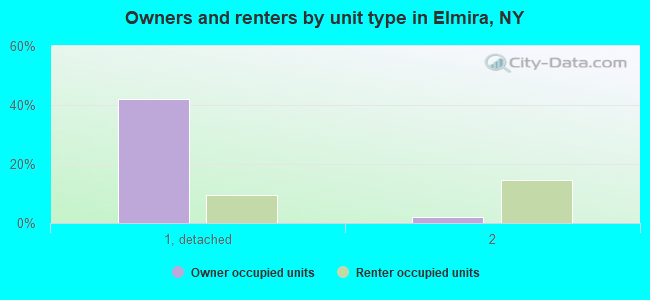
Houses: 12,545 (10,385 occupied: 5,113 owner occupied, 5,063 renter occupied)
| % of renters here: | 50% |
| State: | 46% |
Housing density: 1,715 houses/condos per square mile
Median price asked for vacant for-sale houses and condos in 2022: $108,682.
Median contract rent in 2022: $646 (lower quartile is $505, upper quartile is $906)
Median rent asked for vacant for-rent units in 2022: $1,291
Median gross rent in Elmira, NY in 2022: $818
Housing units in Elmira with a mortgage: 2,815 (107 second mortgage, 0 home equity loan, 89 both second mortgage and home equity loan)
Houses without a mortgage: 100
Median household income for houses/condos with a mortgage: $67,744
Median household income for apartments without a mortgage: $45,066
Median monthly housing costs: $812
Compare current foreclosures near Elmira, NY:
| Photo | Address | Area | Beds / Baths | Price | Details |
|---|---|---|---|---|---|

|
#1
Norton St
Elmira, NY 14901
|
1,161 sq. feet
|
1 baths 2 beds |
$16,900
|
show details |

|
#2
W 2nd St
Elmira, NY 14901
|
3,450 sq. feet
|
4 baths 9 beds |
show details | |

|
#3
Lyon St
Elmira, NY 14904
|
1,267 sq. feet
|
1 baths 3 beds |
show details | |

|
#4
W 2nd St
Elmira, NY 14905
|
2,060 sq. feet
|
2 baths 5 beds |
show details | |

|
#5
Seneca Pl
Elmira, NY 14904
|
1,540 sq. feet
|
1 baths 3 beds |
show details | |

|
#6
Standish St
Elmira, NY 14901
|
2 sq. feet
|
2 baths 3 beds |
show details | |

|
#7
Johnson St
Elmira, NY 14901
|
1,406 sq. feet
|
1 baths 3 beds |
show details | |

|
#8
Post St
Elmira, NY 14904
|
1,466 sq. feet
|
1 baths 3 beds |
show details | |

|
#9
Collins St
Elmira, NY 14904
|
1,296 sq. feet
|
1 baths 3 beds |
show details | |

|
#10
Dubois St
Elmira, NY 14904
|
1,232 sq. feet
|
1 baths 3 beds |
show details |
| Photo | Address | Area | Beds / Baths | Price | Details |
|---|---|---|---|---|---|

|
#11
Rilla St
Elmira, NY 14903
|
912 sq. feet
|
1 baths 3 beds |
show details | |

|
#12
Baylor Cir
Elmira, NY 14904
|
1,175 sq. feet
|
2 baths 3 beds |
show details | |

|
#13
E Clinton St
Elmira, NY 14901
|
1,992 sq. feet
|
2 baths 4 beds |
show details | |

|
#14
Park Ave
Elmira, NY 14901
|
1,360 sq. feet
|
1 baths 3 beds |
show details | |

|
#15
Esty St
Elmira, NY 14904
|
1,396 sq. feet
|
1 baths 3 beds |
show details | |

|
#16
W 15th St
Elmira, NY 14903
|
1,562 sq. feet
|
2 baths 4 beds |
show details | |

|
#17
Redfield Dr
Elmira, NY 14905
|
1,200 sq. feet
|
2 baths 2 beds |
show details | |

|
#18
Oakwood Ave
Elmira, NY 14903
|
2,356 sq. feet
|
2 baths 3 beds |
show details | |

|
#19
Davis St
Elmira, NY 14901
|
2,106 sq. feet
|
1 baths 3 beds |
show details | |

|
#20
Laurel St
Elmira, NY 14904
|
1,292 sq. feet
|
1 baths 3 beds |
show details |
| Photo | Address | Area | Beds / Baths | Price | Details |
|---|---|---|---|---|---|

|
#21
Plymouth Ave
Elmira, NY 14904
|
1,088 sq. feet
|
1 baths 3 beds |
show details | |

|
#22
Merrill Pl
Elmira, NY 14904
|
- sq. feet
|
- baths - beds |
show details | |

|
#23
Lower Maple Ave
Elmira, NY 14901
|
- sq. feet
|
- baths - beds |
show details | |

|
#24
W Clinton St, Apt 1 Pmb 1
Elmira, NY 14901
|
- sq. feet
|
- baths - beds |
show details | |

|
#25
Baty St
Elmira, NY 14904
|
- sq. feet
|
- baths - beds |
show details | |

|
#26
Maple Ave
Elmira, NY 14904
|
- sq. feet
|
- baths - beds |
show details | |

|
#27
Spaulding St
Elmira, NY 14904
|
- sq. feet
|
- baths - beds |
show details | |

|
#28
Owens St
Horseheads, NY 14845
|
1,800 sq. feet
|
1 baths 3 beds |
show details | |

|
#29
Beckwith Rd
Pine City, NY 14871
|
2,540 sq. feet
|
2 baths 4 beds |
show details | |

|
#30
Griffith St
Corning, NY 14830
|
2,100 sq. feet
|
2 baths 4 beds |
show details |
| Photo | Address | Area | Beds / Baths | Price | Details |
|---|---|---|---|---|---|

|
#31
Steuben St
Horseheads, NY 14845
|
1,047 sq. feet
|
1 baths 2 beds |
show details | |

|
#32
Steuben St
Horseheads, NY 14845
|
1,252 sq. feet
|
1 baths 2 beds |
show details | |

|
#33
Chemung St
Waverly, NY 14892
|
2,311 sq. feet
|
1 baths 4 beds |
show details | |

|
#34
Austin Hill Rd
Erin, NY 14838
|
2,282 sq. feet
|
2 baths 3 beds |
show details | |

|
#35
Maple St
Corning, NY 14830
|
1,776 sq. feet
|
1 baths 4 beds |
show details | |

|
#36
W Hill Rd
Waverly, NY 14892
|
2,578 sq. feet
|
2 baths 3 beds |
show details | |

|
#37
Ithaca St
Waverly, NY 14892
|
1,716 sq. feet
|
1 baths 3 beds |
show details | |

|
#38
Reynolds Ave
Corning, NY 14830
|
1,696 sq. feet
|
1 baths 3 beds |
show details | |

|
#39
Eacher Hollow Rd
Horseheads, NY 14845
|
2,024 sq. feet
|
1 baths 3 beds |
show details | |

|
#40
Locust Rd
Gillett, PA 16925
|
- sq. feet
|
- baths - beds |
$1
|
show details |
| Photo | Address | Area | Beds / Baths | Price | Details |
|---|---|---|---|---|---|

|
#41
Gano Rd
Montour Falls, NY 14865
|
975 sq. feet
|
1 baths 2 beds |
show details | |

|
#42
Olcott Rd N
Big Flats, NY 14814
|
2,230 sq. feet
|
2 baths 4 beds |
show details | |

|
#43
Park Ln
Big Flats, NY 14814
|
1,688 sq. feet
|
1 baths 3 beds |
show details | |

|
#44
Wygant Rd
Horseheads, NY 14845
|
1,176 sq. feet
|
1 baths 3 beds |
show details | |

|
#45
Thorne St
Horseheads, NY 14845
|
638 sq. feet
|
1 baths 2 beds |
show details | |

|
#46
Kingsbury Ave
Corning, NY 14830
|
1,159 sq. feet
|
1 baths 3 beds |
show details | |

|
#47
Spring St Apt 4
Waverly, NY 14892
|
- sq. feet
|
- baths - beds |
show details | |

|
#48
Little York Rd
Columbia Cross Roads, PA 16914
|
- sq. feet
|
- baths - beds |
show details | |

|
#49
Creekside Dr Apt 201
Painted Post, NY 14870
|
- sq. feet
|
- baths - beds |
show details | |

|
Check over 1 million property listings on Foreclosure.com!
|
browse all offers | |||

Latest news about housing in Elmira, NY collected exclusively by city-data.com from local newspapers, TV, and radio stations


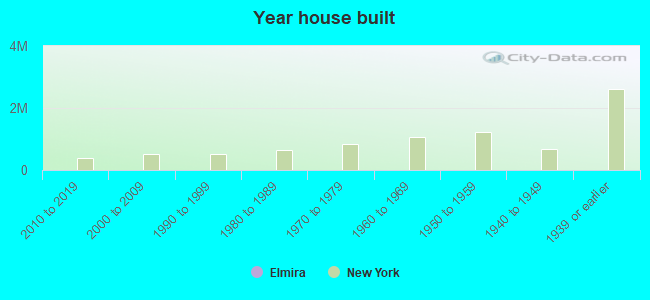
Median year apartment built: 1949
Household type by relationship:
Households: 25,809- Male householders: 3,967 (1,568 living alone), Female householders: 6,078 (2,366 living alone)
3,122 spouses (3,086 opposite-sex spouses), 1,019 unmarried partners, (977 opposite-sex unmarried partners), 6,660 children (6,093 natural, 189 adopted, 377 stepchildren), 629 grandchildren, 273 brothers or sisters, 161 parents, 10 foster children, 289 other relatives, 791 non-relatives
- In group quarters: 2,804
Size of family households: 2,246 2-persons, 1,187 3-persons, 702 4-persons, 559 5-persons, 151 6-persons, 262 7-or-more-persons.
Size of nonfamily households: 4,516 1-person, 609 2-persons, 56 3-persons, 11 4-persons, 20 5-persons.
2,377 married couples with children.
2,626 single-parent households (508 men, 2,118 women).
94.8% of residents of Elmira speak English at home.
2.7% of residents speak Spanish at home (75% speak English very well, 4% speak English well, 14% speak English not well, 6% don't speak English at all).
1.4% of residents speak other Indo-European language at home (55% speak English very well, 42% speak English well, 3% speak English not well).
0.5% of residents speak Asian or Pacific Island language at home (42% speak English very well, 30% speak English well, 28% speak English not well).
0.3% of residents speak other language at home (82% speak English very well, 18% speak English well).
Foreign born population: 736 (2.9%)
(71.3% of them are naturalized citizens)
| Here: | 7.2 |
| State: | 6.3 |
| Here: | 4.4 |
| State: | 3.8 |
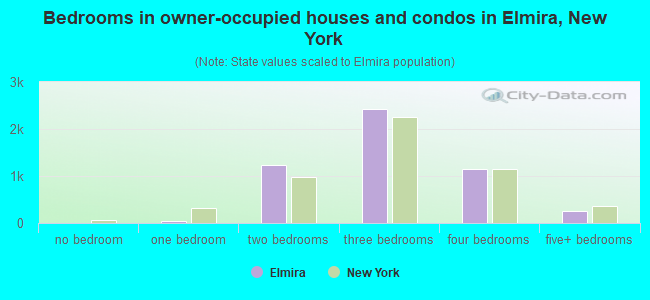
- Bedrooms in owner-occupied houses and condos in Elmira, New York
- 0no bedroom
- 511 bedroom
- 1,2352 bedrooms
- 2,4163 bedrooms
- 1,1574 bedrooms
- 2545+ bedrooms
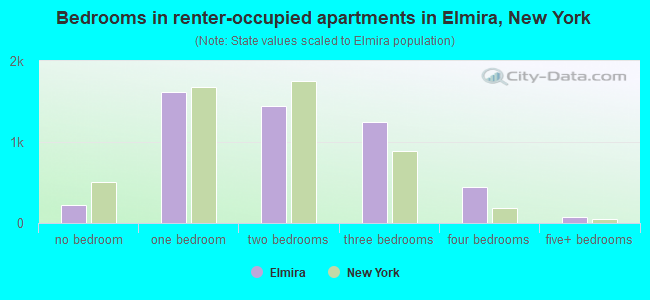
- Bedrooms in renter-occupied apartments in Elmira, New York
- 220no bedroom
- 1,6221 bedroom
- 1,4492 bedrooms
- 1,2523 bedrooms
- 4414 bedrooms
- 795+ bedrooms
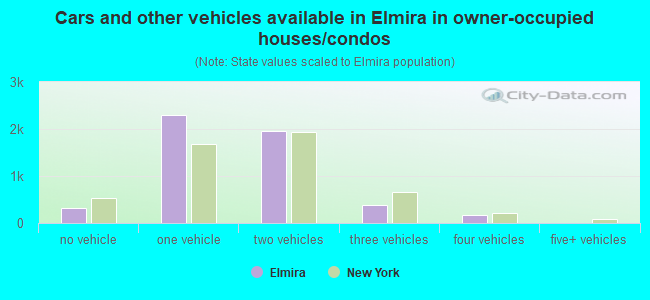
- Cars and other vehicles available in Elmira in owner-occupied houses/condos
- 317no vehicle
- 2,3011 vehicle
- 1,9482 vehicles
- 3773 vehicles
- 1654 vehicles
- 65+ vehicles
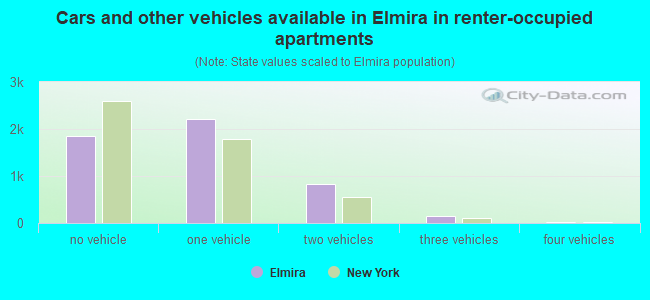
- Cars and other vehicles available in Elmira in renter-occupied apartments
- 1,858no vehicle
- 2,2091 vehicle
- 8352 vehicles
- 1473 vehicles
- 114 vehicles
- 35+ vehicles
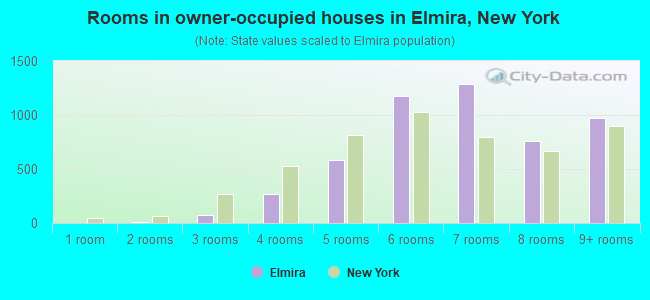
- Rooms in owner-occupied houses in Elmira, New York
- 01 room
- 52 rooms
- 723 rooms
- 2694 rooms
- 5835 rooms
- 1,1726 rooms
- 1,2877 rooms
- 7578 rooms
- 9689+ rooms
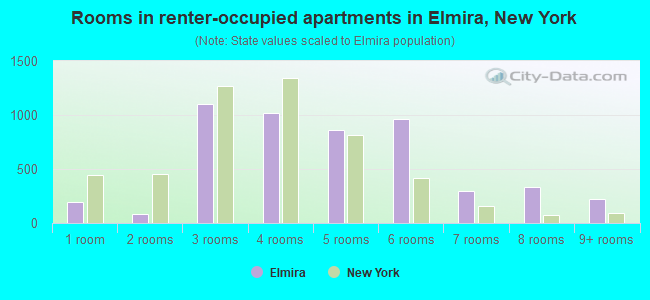
- Rooms in renter-occupied apartments in Elmira, New York
- 1921 room
- 802 rooms
- 1,1053 rooms
- 1,0154 rooms
- 8645 rooms
- 9646 rooms
- 2937 rooms
- 3318 rooms
- 2189+ rooms
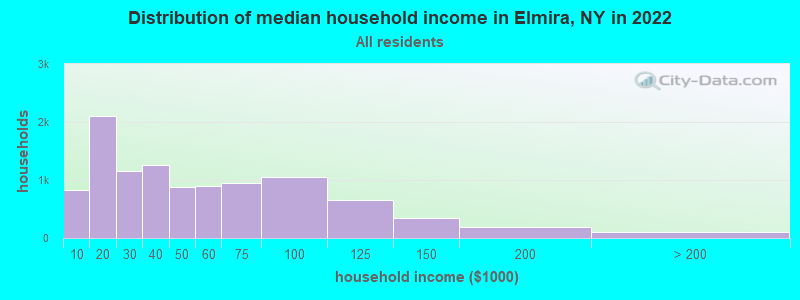
Elmira, NY household income distribution

- 821Less than $10,000
- 2,095$10,000 to $19,999
- 1,147$20,000 to $29,999
- 1,252$30,000 to $39,999
- 884$40,000 to $49,999
- 902$50,000 to $59,999
- 956$60,000 to $74,999
- 1,046$75,000 to $99,999
- 663$100,000 to $124,999
- 345$125,000 to $149,999
- 186$150,000 to $199,999
- 106$200,000 or more
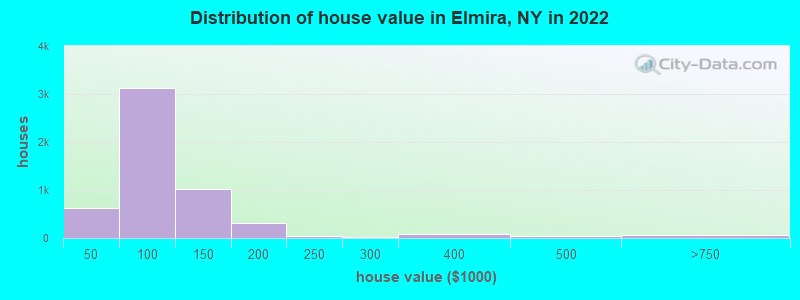
Home value of owner - occupied houses in 2022 in Elmira, NY
-
- 54Less than $10,000
- 50$10,000 to $14,999
- 13$15,000 to $19,999
- 73$20,000 to $24,999
- 64$25,000 to $29,999
- 139$30,000 to $34,999
- 56$35,000 to $39,999
- 170$40,000 to $49,999
- 379$50,000 to $59,999
- 1,010$60,000 to $69,999
- 316$70,000 to $79,999
- 804$80,000 to $89,999
- 448$90,000 to $99,999
- 847$100,000 to $124,999
- 163$125,000 to $149,999
- 202$150,000 to $174,999
- 111$175,000 to $199,999
- 45$200,000 to $249,999
- 28$250,000 to $299,999
- 84$300,000 to $399,999
- 42$400,000 to $499,999
- 34$500,000 to $749,999
- 23$750,000 to $999,999
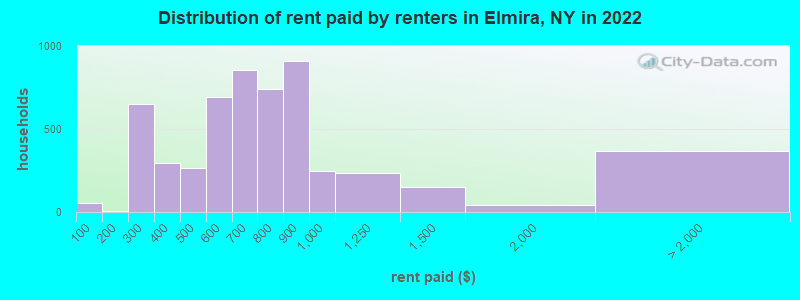
Rent paid by renters in 2022 in Elmira, NY
-
- 55Less than $100
- 6$100 to $149
- 294$200 to $249
- 355$250 to $299
- 109$300 to $349
- 185$350 to $399
- 74$400 to $449
- 193$450 to $499
- 332$500 to $549
- 362$550 to $599
- 453$600 to $649
- 404$650 to $699
- 430$700 to $749
- 310$750 to $799
- 907$800 to $899
- 247$900 to $999
- 236$1,000 to $1,249
- 150$1,250 to $1,499
- 40$1,500 to $1,999
- 189$2,000 to $2,499
- 8$3,000 to $3,499
- 170No cash rent
Percentage of workers working in this county: 76.2%
Number of people working at home: 855 (8.5% of all workers)
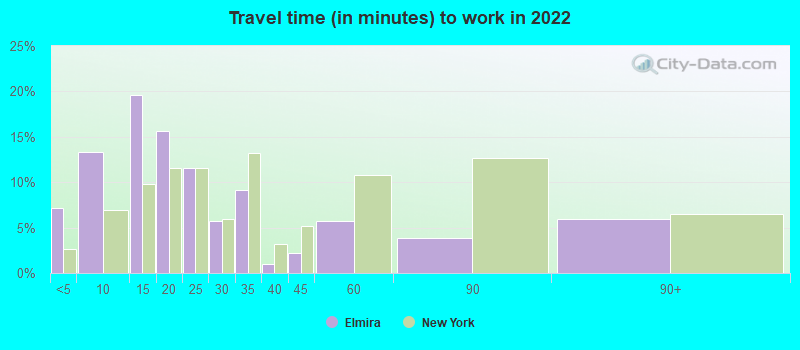
Travel time to work (commute)
- Less than 5 minutes: 738
- 5 to 9 minutes: 1,517
- 10 to 14 minutes: 1,404
- 15 to 19 minutes: 1,393
- 20 to 24 minutes: 1,245
- 25 to 29 minutes: 443
- 30 to 34 minutes: 383
- 35 to 39 minutes: 126
- 40 to 44 minutes: 79
- 45 to 59 minutes: 446
- 60 to 89 minutes: 500
- 90 or more minutes: 294
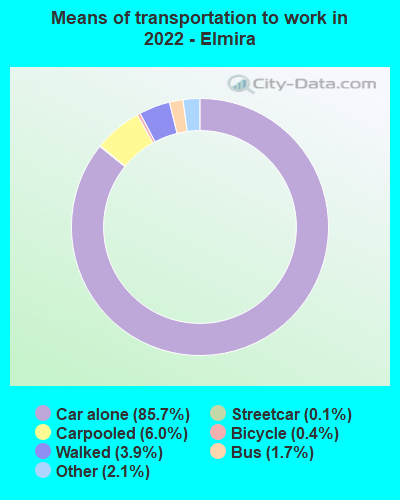
Means of transportation to work:
- Drove a car alone: 12,218 (79.7%)
- Carpooled: 913 (6.0%)
- Bus: 241 (1.6%)
- Subway or elevated rail: 13 (0.1%)
- Taxi: 372 (2.4%)
- Bicycle: 60 (0.4%)
- Walked: 568 (3.7%)
- Worked at home: 855 (5.6%)
- Unemployment by race in 2022
- Unemployment rate for White non-Hispanic residents
- 13.6%Males
- 7.1%Females
- Unemployment rate for Black residents
- 15.7%Males
- 4.1%Females
- Unemployment rate for other race residents
- 1.6%Males
- Unemployment rate for two or more race residents
- 5.6%Males
- 9.5%Females
- Unemployment rate for Hispanic or Latino residents
- 19.8%Males
- 14.8%Females
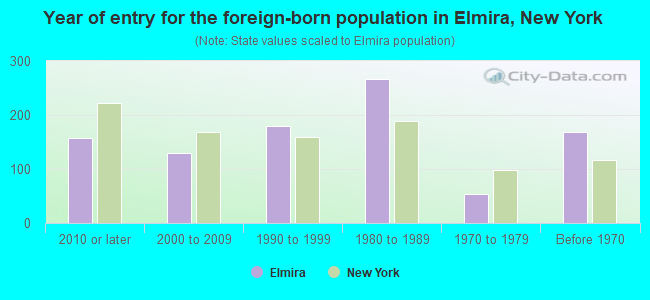
- Year of entry for the foreign-born population in Elmira, New York
- 1572010 or later
- 1292000 to 2009
- 1791990 to 1999
- 2671980 to 1989
- 531970 to 1979
- 169Before 1970
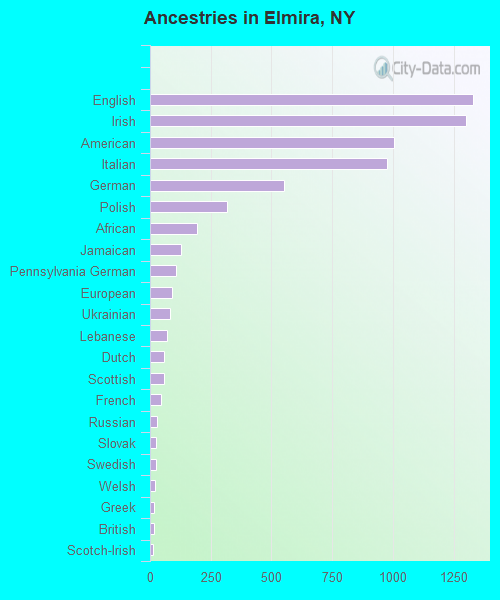
First ancestries reported:
- English: 1,329 (14.2%)
- Irish: 1,300 (13.9%)
- American: 1,006 (10.7%)
- Italian: 976 (10.4%)
- German: 550 (5.9%)
- Polish: 319 (3.4%)
- African: 195 (2.1%)
- Jamaican: 127 (1.4%)
- Pennsylvania German: 107 (1.1%)
- European: 89 (1.0%)
- Ukrainian: 83 (0.9%)
- Lebanese: 69 (0.7%)
- Dutch: 59 (0.6%)
- Scottish: 56 (0.6%)
- French: 44 (0.5%)
- Russian: 27 (0.3%)
- Slovak: 24 (0.3%)
- Swedish: 24 (0.3%)
- Welsh: 21 (0.2%)
- Greek: 17 (0.2%)
- British: 16 (0.2%)
- Scotch-Irish: 14 (0.1%)
- Albanian: 11 (0.1%)
- Norwegian: 10 (0.1%)
- French Canadian: 8 (0.09%)
- Austrian: 7 (0.07%)
- British West Indian: 5 (0.05%)
- Trinidadian and Tobagonian: 3 (0.03%)
Most common places of birth for foreign-born residents (%):
| Elmira: | 21.3% (141) |
| New York: | 5.0% (227,557) |
| Elmira: | 9.7% (64) |
| New York: | 9.1% (410,910) |
| Elmira: | 8.8% (58) |
| New York: | 3.9% (177,448) |
| Elmira: | 8.5% (56) |
| New York: | 11.1% (501,040) |
| Elmira: | 6.5% (43) |
| New York: | 1.3% (59,107) |
| Elmira: | 4.8% (32) |
| New York: | 0.2% (11,219) |
| Elmira: | 4.7% (31) |
| New York: | 0.9% (42,220) |
| Elmira: | 4.5% (30) |
| New York: | 1.7% (78,421) |
| Elmira: | 4.4% (29) |
| New York: | 0.1% (6,415) |
| Elmira: | 3.6% (24) |
| New York: | 2.0% (91,070) |
| Elmira: | 3.3% (22) |
| New York: | 0.1% (3,762) |
| Elmira: | 2.6% (17) |
| New York: | 0.9% (38,713) |
| Elmira: | 2.1% (14) |
| New York: | 1.7% (75,802) |
| Elmira: | 1.8% (12) |
| New York: | 0.0% (333) |
| Elmira: | 1.7% (11) |
| New York: | 1.8% (81,374) |
| Elmira: | 1.7% (11) |
| New York: | 1.8% (82,786) |
| Elmira: | 1.7% (11) |
| New York: | 1.4% (61,245) |
Place of birth for U.S.-born residents:
- This state: 20,121
- Other state: 4,663
- Northeast: 2,122
- Midwest: 554
- South: 1,066
- West: 1,095
85.6% of Elmira residents lived in the same house 1 years ago.
Out of people who lived in different houses, 32.7% lived in this county.
Out of people who lived in different counties, 67.7% lived in New York.
| Elmira: | 85.6% |
| State average: | 89.6% |
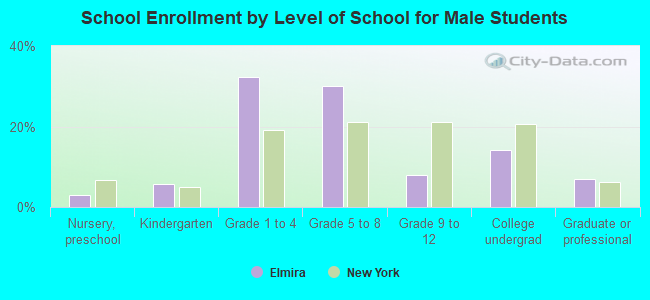
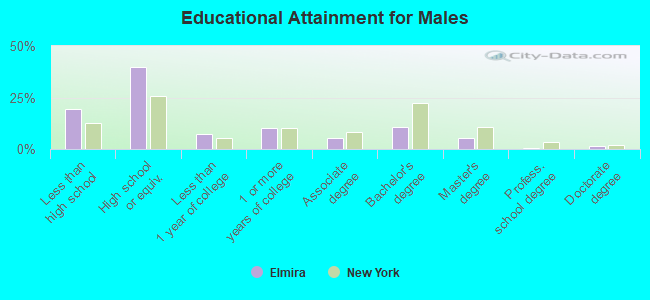
Education attainment for males 25 years and older:
- No schooling: 55
- Nursery to 4th grade: 11
- 5th and 6th grade: 57
- 7th and 8th grade: 207
- 9th grade: 88
- 10th grade: 497
- 11th grade: 288
- 12th grade, no diploma: 394
- High school graduate (or equivalency): 3,261
- Less than 1 year of college: 596
- Some college more than 1 year, no degree: 826
- Associate degree: 448
- Bachelor's degree: 858
- Master's degree: 429
- Professional school degree: 56
- Doctorate degree: 112
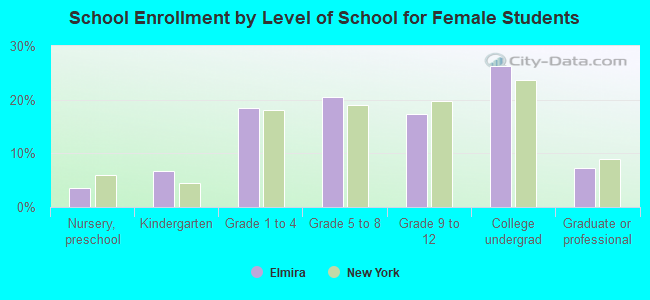
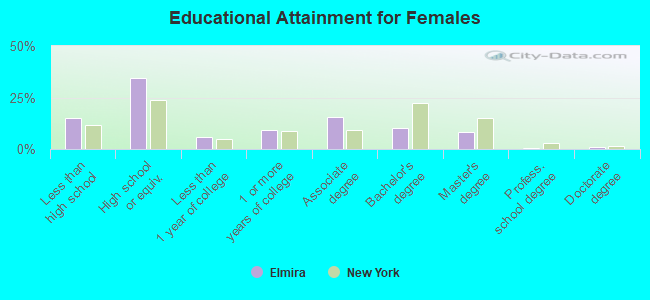
Education attainment for females 25 years and older:
- No schooling: 105
- Nursery to 4th grade: 0
- 5th and 6th grade: 138
- 7th and 8th grade: 113
- 9th grade: 144
- 10th grade: 245
- 11th grade: 355
- 12th grade, no diploma: 238
- High school graduate (or equivalency): 3,032
- Less than 1 year of college: 498
- Some college more than 1 year, no degree: 797
- Associate degree: 1,384
- Bachelor's degree: 880
- Master's degree: 727
- Professional school degree: 54
- Doctorate degree: 100


Housing units in structures:
- One, detached: 5,998
- One, attached: 412
- Two: 2,880
- 3 or 4: 1,140
- 5 to 9: 889
- 10 to 19: 245
- 20 to 49: 366
- 50 or more: 570
- Mobile homes: 34
- Boats, RVs, vans, etc.: 8
Housing units lacking complete kitchen facilities in 2022: 2.2%
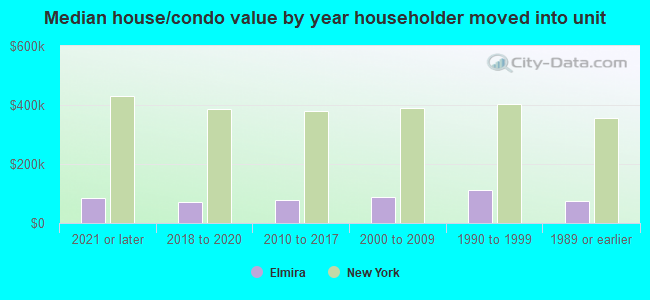
House/condo owner moved in on average 17 years ago
Renter moved in on average 3 years ago
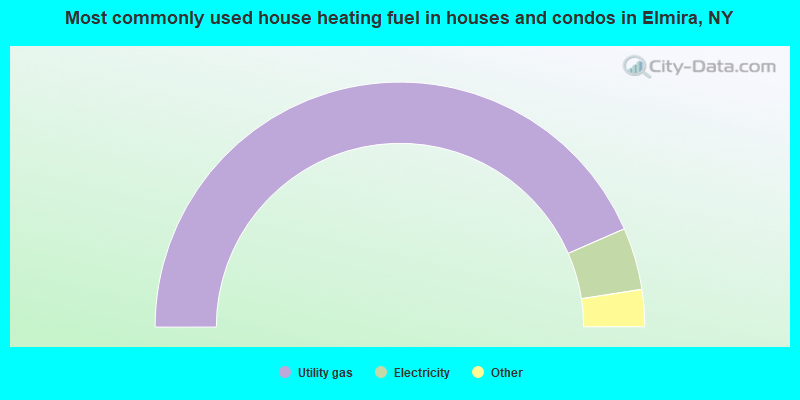
- 86.9%Utility gas
- 8.2%Electricity
- 3.0%Bottled, tank, or LP gas
- 1.0%Fuel oil, kerosene, etc.
- 0.7%No fuel used
- 0.1%Wood
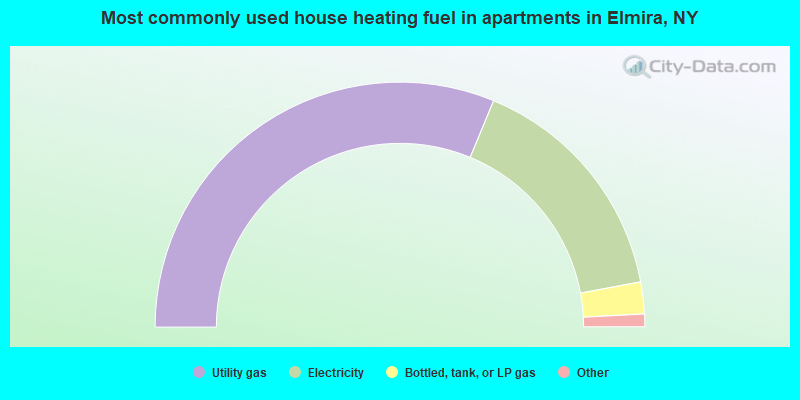
- 62.5%Utility gas
- 31.6%Electricity
- 4.2%Bottled, tank, or LP gas
- 0.9%Fuel oil, kerosene, etc.
- 0.6%Other fuel
- 0.2%No fuel used
Private vs. public school enrollment:
| Here: | 17.2% |
| New York: | 15.6% |
| Here: | 6.9% |
| New York: | 15.0% |
| Here: | 75.5% |
| New York: | 39.2% |